PROSPECTS AND
DEVELOPMENTS
2016
IFOAM EU Group
Rue du Commerce 124, BE - 1000 Brussels, Belgium Phone: +32 2280 1223 - Fax: +32 2735 7381 [email protected]
www.ifoam-eu.org
EDITORS: Stephen Meredith and Helga Willer
PRODUCTION SUPPORT: Eva Berckmans
STATISTICAL DATA COLLECTION, DRAFTING AND EDITING: FiBL Projekte GmbH, Marche Polytechnic University
LANGUAGE EDITING: Ben Tannahill
SPECIAL THANKS FOR THEIR CONTRIBUTIONS TO: Matthias Stolze, Raffaele Zanoli, Julia Lenroud and Diana Schaack
DESIGN AND LAYOUT: fuel.bvba/sprl – www.fueldesign.be
The opinions expressed by the authors are their own and do not necessarily reflect the opinion of IFOAM EU. While all efforts were taken to ensure the accuracy of the publication’s content and to collect statistics and reports from all countries, errors and omissions cannot be entirely ruled out. Corrections and additional content concerning organic production and market trends should be sent in writing to [email protected]. Should revisions or additional content be necessary they will be published at: www.ifoam-eu.org and www.organic-europe.net
DOWNLOAD THIS BOOK FROM THE IFOAM EU WEBSITE: www.ifoam-eu.org © 2016. IFOAM EU and FiBL
ISBN: 978-3-03736-313-3 EDITOR AND PUBLISHER:
PARTNERS:
SUPPORTERS:
Green
IFOAM EU, FiBL, Marche Polytechnic University
and Naturland
PROSPECTS AND
DEVELOPMENTS
2016
FOREWORD
It is my great pleasure to welcome the second edition of Organic in Europe: Prospects and De-velopments 2016. This publication provides an invaluable overview of the latest developments and future prospects for organic production and market development in Europe. It comes at a time of yet another record year of growth for European organic food markets valued at €24 billion in the EU-28 (€26.2 billion across the European continent) in 2014. Indeed the organic market has seen double digit growth in the latest decades, both in terms of the European market and the area of organically managed agricultural land – which now represents 5.7% of total agricultural area in the EU-28 (2.4% in Europe).
At the same time it is important to acknowledge that despite growth demand for organic food amongst European consumers, the development of the EU organic farmland area is slow-ing down and in some cases stagnatslow-ing or even decreasslow-ing. This simply beggars belief when the sustainability challenges facing food and farming systems in Europe and worldwide are becoming ever greater and more acknowledged in the public sphere. These current trends in Europe not only highlight the necessity of a positive policy environment in which farmers and food business can make important investment decisions, but also the importance of having reliable production and market information to hand.
With this in mind this edition of the book is divided into two sections covering both themes. The first chapter takes the form of a think piece which considers the current imbalances in organic supply and demand in Europe and how such gaps should be closed. Such reflections are critically important at time when the organic movement in Europe envisages that 50% of farmland in Europe should be managed based on organic principles within the decade and half as parts of An Organic Vision for Europe in 2030. The second chapter explores the latest production and markets to 2014 accounting for supply and demand patterns are developing in different part of Europe. We are also pleased to announce that this publication is comple-mented by a series of interactive infographic where readers can explore the data through www.ifoam-eu.org.
We wish you and enjoyable read and trust that this edition of the book will be a useful source of reference for organic stakeholders, policymakers, journalists, and other interest parties in working to make Europe more organic.
Christopher Stopes
FOREWORD 5
ORGANIC IN EUROPE: EXPANDING BEYOND A NICHE
12
Matthias Stolze, Raffaele Zanoli and Stephen Meredith
Dynamic market growth – but is organic reaching its full potential? 12 Where does organic food and farming in Europe stand now? 13 What are the obstacles for further development of organics? 15 Considering the solutions for moving organics forward 18
GROWTH TRENDS IN EUROPEAN
ORGANIC FOOD AND FARMING
20
Helga Willer, Diana Schaack, Julia Lernoud and Stephen Meredith
Organic market and production trends 2014 20
Organic market 23
Organic operators 36
Organic agricultural land 40 Organic land use, crops and livestock 48
ANNEXES 62
List of production and market figures
Figure 1: Growth of organic retail sales in Europe, 2005-2014 24
Figure 2: Organic retail sales in Europe by country, 2014 25
Figure 3: Share of organic retail sales in Europe by country, 2014 26
Figure 4a: Distribution of organic retail sales in EU-28, 2014 27
Figure 4b: European distribution of organic retail sales, 2014 27
Figure 4c: Global distribution of organic retail sales by single market, 2014 27
Figure 5: Growth of per capita consumption in Europe, 2005-2014 28
Figure 6: Organic per capita consumption in Europe by country, 2014 29
Figure 7: Organic retail sales by marketing channel in selected EU-28 countries, 2014 30
Figure 8a: Distribution of organic retail sales in Czech Republic by product group, 2013 34
Figure 8b: Distribution of organic retail sales in France by product group, 2014 34
Figure 8c: Distribution of organic retail sales in Germany by product group, 2014 34
Figure 8d: Distribution of organic retail sales in Sweden by product group, 2014 34
Figure 9: Organic producers, processors and importers in Europe by country, 2014 37
Figure 10: Development of organic producers and processors in EU-28, 2005-2014 38
Figure 11: Organic certification in Europe, 2014 39
Figure 12: Organic farmland in Europe by country, 2014 41
Figure 13a: Distribution of organic farmland in EU-28, 2014 42
Figure 13b: European distribution of organic farmland, 2014 42
Figure 13c: Global distribution of organic farmland by country, 2014 42
Figure 14: Share of organic farmland in Europe by country, 2014 44
Figure 15: Growth of organic farmland in Europe, 1985-2014 45
Figure 16: Conversion status of organic farmland in Europe, 2014 46
Figure 17: Conversion status of organic farmland in Europe by country, 2014 47
Figure 18a: Use of organic farmland in EU-28, 2014 49
Figure 18b: European use of organic farmland, 2014 49
Figure 18c: Global use of organic farmland, 2014 49
Figure 19: Growth of organic farmland by land use type in EU-28, 2005-2014 50
Figure 20: Top 10 countries with the largest organic farmland areas
by land use type in EU-28, 2014 50
Figure 21: Development of selected organic crop groups in EU-28, 2005-2014 53
Figure 22: Development of organic livestock in EU-28 by animal type, 2007-2014 56
Figure 23: Development of organic milk production from dairy cows in EU-28, 2007-2014 56
Figure 24: Self-sufficiency rate for organic concentrate feed and crude protein 58
List of production and market tables
Table 1: Organic market and production trends in Europe by country group, 2014 21
Table 2: Organic retail market trends in Europe by country group, 2014 23
Table 3: Shares of organic product groups by total market 31
in selected European countries, 2014
Table 4: Organic producers, processors, and importers in Europe by country group, 2014 36
Table 5: Organic farmland trends in Europe by country group, 2014 40
Table 6: Organic farmland by land use type in Europe by country group, 2014 48
Table 7: Top 10 organic crops in Europe by country group, 2014 51
Table 8: Organic livestock by animal type and total share in EU-28 and Europe, 2014 55
Table 9: Production and demand for organic concentrate feed 57
in selected European countries, 2011
List of production and market annexes
Annex 1: Organic retail market trends in Europe by country, 2014 62
Annex 2: Organic producers, processors, and importers in Europe by country, 2014 64
Annex 3: Organic farmland trends in Europe by country, 2014 66
Annex 4: Organic farmland by land use type in Europe by country, 2014 68
01
ORGANIC IN EUROPE:
EXPANDING BEYOND
A NICHE
DYNAMIC MARKET GROWTH – BUT IS
ORGANIC REACHING ITS FULL POTENTIAL?
Over the last three decades, organic food and farming has continued to grow year-on-year across Europe. Since the mid-1980s, in the European Union (EU) alone the total area of farmland under organic production has increased steadily to 10.3 million hectares (as of 2014). This has been accompanied by buoyant market growth over the last ten years, with the total value of the EU organic retail market doubling from €11.1 billion in 2005 to €24 billion in 2014. Further details about the latest European production and market trends for 2014 can be found in chapter 2.4
Such advances reflect the vibrant and innovative nature of organic food and farming in response to the expectations of policymakers and the demands of EU consumers for high-quality food production that supports the environment, animal welfare and the development of rural areas. More recently, the organic movement has been working towards an organic vision for fairer, more environmentally conscious and healthier food and farming systems by 2030. This vision envisages 50% of Europe’s agricultural land being managed according to the organic principles of health, ecology, fairness and care.5 Yet, despite unprecedented growth, a
significant imbalance continues to exist between the current supply of organic produce and the growing demand for organic food.
Based on current market growth, the increase in organic production over the last number of decades, and the vision that the EU organic movement has set itself, the organic sector still has huge potential to be a flagship for smart, sustainable and inclusive development. However, if the sector does not succeed in closing the gap between organic demand and supply, Europe
Matthias Stolze,1 Raffaele Zanoli2
WHERE DOES ORGANIC FOOD AND
FARMING IN EUROPE STAND NOW?
Organic food markets are
developing at different rates in each country
The growth of the organic market varies between EU Member States. Indeed, while retail sales in 2014 increased by double digits in Sweden (45%) and France (10%), in countries such as Belgium (3.8%) and the UK (4%) organic retail growth rates were below average. Similarly, there are huge differences in per capita consumption of organic food between Member States, with Luxembourg and Denmark leading and Slovakia and Bulgaria at the lower end.Despite these differences, EU consumers have been increasing their average spend on organic food considerably and the organic food market is an important growth area in the EU grocery retail market.
Current trends in the EU organic market
● Dynamic retail market:the EU market for organic products is growing constantly and increased in 2014 by 7.4%. This is exceptional given an average annual growth rate (2006-2012) in grocery retail markets of around 2% to 3%6
● Consumers spending more on organic food: between 2005 and 2014, per capita organic produce consumption increased by 110% from €22.4 to €47.4 In the same period, household consumption of food and non-alcoholic beverages remained almost constant, increasing only by 13%7
● Consumer demand for high-quality produce:certain organic product groups achieve above average market shares
- Organic eggs have a market share of 11-22% in Austria, Belgium, Finland, France, Germany and the Netherlands
- Dairy products hold a market share of between 5 and 10% in Austria, Germany and the Netherlands. Milk alone can reach even higher shares - 15.7% in Austria
Organic market potential not yet fully exploited
Recent research focused on consumers in the United States and Western Europe suggests that women, foodies and younger people are more likely to be interested in organic products.8
At the same time, while nearly all consumers are aware of organic produce, communication can still be improved. For instance, only about half of consumers understand the difference between organic and non-organic produce or the specific organic production conditions required under ‘organic’ labels. In the United States, for example, 92% of consumers believe that organic products taste just as good as conventional products, while in Western Europe the expectation of improved taste appears to be one of the main reasons to purchase organic food. These expectations are also held by professional chefs.9
Dynamic market growth,
but EU organic production lags behind
How does market growth in the EU compare with the development of organically-managed land? In 2014, 10.3 million hectares were managed organically, which corresponds to 5.7% of the total utilised agricultural area in the EU. But annual growth of organically managed land slowed down to 1.1% in 2014. Even though the number of organic producers has increased by almost 60% over the last 10 years, there was not much growth in 2014 in different countries and a slight drop of 0.2% across the EU as a whole. In some organic pioneer countries such as Austria, Denmark, Germany, and the UK the organically managed land area and the number of organic farms is stagnating or even decreasing. One could argue that these slower growth rates and decreases indicate the consolidation of organic farmland area development. However, positive growth is bucking this trend in other Member States. For example in countries such as Belgium, France, Italy, Portugal, Spain, Bulgaria, Croatia and Slovakia, the organic land area increased in 2014 by more than 5% compared to 2013. For some of these countries such as Portugal, Spain, and Bulgaria this growth has come with an increase in the number of organic farms.
WHAT ARE THE OBSTACLES FOR FURTHER
DEVELOPMENT OF ORGANICS?
There are several obstacles that may hinder both farmers and food businesses from capitalising on the growing demand for organic produce in terms of income generation and job creation.
Member States give differing priority to organic farming
Organic farming support through area payments (Measure 11 - conversion and maintenance) under the new Rural Development Programmes (RDPs) varies considerably across the Member States.10 Indeed, the most recent figures for the EU expenditure on organic farming
maintenance and conversion payments range from 0.2% in Malta to 13.2% in Denmark of total EU spending for RDPs, with limited scope for expanding the organic farmland area (see figure below). The Netherlands provide no targeted measures for organic farming under their new RDP.
The total contribution from the European Agricultural Fund for Rural Development (EAFRD), for 2014 – 2020 to organic farming payments amounts to €6.286 billion or 6.4% of the total EAFRD (€98.958 billion). Thus, the EU share of the rural development spending contribution for organic farming is about the size of the 2014 organic farming area which amounted to 5.7% of the EU’s total farmland area. As to the relevance that each Member States gives to organic farming area support compared to its total organic farmland area, there is no common pattern across the different Member States. Countries like Belgium, Bulgaria, Cyprus, Denmark, Germany or Greece, for example, seem to give a higher relevance to organic farming support under the new RDPs than countries like Estonia, Finland, Portugal, Slovenia, Slovakia and the UK. Differences in payment rates also exist between Member States due to factors such as payment differentiations by land-use type, different economic assumptions and different cost and income foregone components in payment calculations. Thus the extent to which Member States give priority to organic farming and the corresponding budget allocations and constraints can determine the payment rates and the policy environment for the development of organic farming.
Whether the organic sector develops proactively or not depends not only on organic area payments, but is also the result of different public support measures, including maintenance and conversion support, marketing support, and training and education.11 Not all national or
United Kingdom Sweden Spain Slovenia Slovakia Romania Portugal Poland Netherlands Luxembourg Lithuania Latvia
Malta Italy Ireland Hungary Greece Germany France Finland Estonia Denmark Cyprus Bulgaria Belgium Austria
0% 5% 10% 15% 20%
Share organic farming area 2014 of total agricultural area
Share organic farming support (Measure 11) of total EAFRD 2014-2020
Share organic farming support (Measure 11) of EAFRD 2014-2020 by Member State
Croatia Czech Republic
Source: DG Agriculture and Rural Development 2016, and own calculations based on Willer et al. 2016
Figure: EAFRD contribution to Measure 11 under CAP 2014-2020 compared to the total
Inefficiencies in organic supply chains
Supply chains suffer from gaps between supply and demand, logistic failures and/or other inefficiencies that do not allow supply and demand to be matched. Most studies on organic supply chains report a number of issues concerning their structure and performance:
● high operating costs
● lack of alignment between supply and demand ● poor reliability of supply
● lack of collaboration among chain members
● different values and motivation among different actors in the chain ● lack of information flow
Currently, there is a large knowledge gap on these issues, and the value chain and the value delivery network in the organic food system often lack transparency in the eyes of both the supply-chain members and the end consumer. While organic supply has shown to be remarkably adaptive to changing demands so far, in the future the organic supply chain will need to adapt itself to rapidly evolving demographics and consumer preferences and to an increasingly complex and global business environment. Improved traceability and assurance systems are needed to keep up with this increasing global complexity. Together with fairer and shorter supply chains, these systems are essential in upholding the integrity of the organic supply chain while maintaining and developing consumer trust. There is some evidence that while organic companies have a collaborative attitude, there is still room for improvement.13
Organic farming has mainly
developed at the level of primary production
Poor market transparency results in
insufficient information to inform future investments
A positive environment for organic sector development requires not only reliable policy support for farmers and food businesses, but also a reliable information system. Despite the efforts of private organic sector institutions and in spite of the fact that EU organic farming legislation requires the collection of relevant statistical information as a tool for market operators and policy makers, organic market data is not nearly as detailed and reliable as general agricultural and food industry statistics. This is the case even in countries with relatively well-developed organic markets.
Indeed, organic market data in most countries is very basic and data on domestic market, international trade, and consumer prices or production volumes does not exist in most EU countries. Incomplete breakdowns by crop or product make data of little use for businesses. What makes things even worse is that there is no harmonised way of aggregating this data.14
Finally, there is also a lack of information on the economic performance of organic farms in the EU. For instance Bulgaria, Malta and Romania do not include any organic farms in the EU Farm Accountancy Data Network (FADN). For around half of Member States the coverage of organic farms in FADN is poor and small sample sizes do not allow for robust conclusions on the competitiveness of organic farms. Consequently, there is a lack of transparency in the organic market, which means it does not attract investments.
CONSIDERING THE SOLUTIONS
FOR MOVING ORGANICS FORWARD
How can we overcome these obstacles so that the entire agriculture and food sector can make more use of the dynamics of organic market growth? Both policymakers and the organic sector itself have an important role to play in addressing obstacles that can hinder farmers and businesses from investing in the further development of organic food and farming.
For policymakers there are several areas where the current policy environment could be improved:
● Shorter organic supply chains that provide environmental and social benefits could
be better supported. As a result national and regional RDPs need to place greater emphasis on local food markets (farmers’ markets) and supply chain management (supply chain special projects). This helps to achieve greater balance between local, regional and international provision of organic products
● Improved statistical processes are required to increase the accuracy of organic market
data collection. In order to avoid choking off the recent dynamic organic market growth, reliable market and economic data – especially beyond the farm gate – are required. The EU should strengthen the institutional framework for the collection, analysis and dissemination of organic market data. Robust and reliable information on the competiveness and the economic performance of organic farms in the EU is essential. Therefore, the EU FADN should include economic data from each Member State on organic farms using a sample size that allows for sound analysis and informed decision-making.
The organic sector can do more in its own right to support organic food and farming development in the EU. Many relevant aspects have already been identified by the EU organic movement in its Organic Vision for Europe. These include:
● Recalling the transformative nature of organic food and farming as a key to the further success of organic agriculture. This requires taking stock of what organic has become and how it can proactively face up to the new political, environmental and socio-economic challenges facing the agro-food sector
● Ensuring that the value chain is strongly linked to the organic principle of fairness based on cooperation amongst all organic actors from farmers, workers, and processors to distributors, traders and consumers. Such developments must remain transformative and collaborative ensuring a balanced approach to local, regional, and international sustainable development, rather than simply conforming or adjusting to existing agro-food systems ● Implementing a paradigm shift in education and learning to scale up the rich body of
expertise and know-how that has already been generated by the organic community over the last decades
● Recognising the need to address the key challenges facing the organic sector. Improvements in modern agro-food systems and knowledge transfer developments must be backed up by further private and public investment in agro-ecological research and innovation.
ORGANIC MARKET AND
PRODUCTION TRENDS 2014
The development of the organic sector in 2014 was characterised by two opposing trends. On the one hand, the market grew at a higher rate than in the two previous years with retail sales in the EU valued at €24 billion (€26.2 billion in Europe). This represented a growth rate of approximately 7.4% (7.6% in Europe) on 2013 figures. Whilst processors and importers numbers increased by 19% and 17% respectively in the EU (18.6% and 16% in Europe), the growth and development of organic agriculture land area in the EU slowed down – growing by 1.1% in the EU (2.3% in Europe) with a drop of 0.2% in the number of producers (a slight increase of 1.4% was recorded in Europe). This chapter serves to outline the latest production19 and market20
trends for 2014 in Europe.21 It focuses primarily on the 28 Member States of the European Union
(EU-28)22 and the EU Candidate and Potential Candidate (CPC)23 countries, and the members
of the European Free Trade Association (EFTA).24 An analysis of the current market trends for
organic in Europe and implications for the further development of organic food and farming can be found in chapter 1.
02
GROWTH TRENDS
IN EUROPEAN
ORGANIC FOOD
AND FARMING
Helga Willer,15 Diana Schaack,16 Julia Lernoud17
Table 1: Organic market and production trends in Europe by country group, 2014
Country
group Retail sales (billion EUR)
Per capita consumption
(EUR)
Producers Land area
(million hectares)
Total land share
EU-28 24 47.4 257,525 10.3 5.7%
Europe 26.2 35.5 339,824 11.6 2.4%
Global 62.6 8.3 2,260,361 43.7 1.0%
EU-15 23.5 58 194,979 7.8 6.1%
EU-13 0.5 4 62,546 2.4 4.7%
CPC 0.005 0.1 73,375 0.5 1.5%
EFTA 2.1 154 8,500 0.2 4.4%
Other European countries
0.1 1 424 0.7 0.2%
Source: FiBL-AMI survey 2016 based on national data sources
Table 1 provides a European and global overview of the latest market and production trends for organic food and farming. A more detailed overview of organic production and market trends by country can be found in annexes 1-5.
Market highlights
● Retail sales in the EU were valued at €24 billion (€26.2 billion in Europe), representing the second largest single market for organic products in the world after the United States (€27.1 billion)
● The EU market recorded a growth rate of approximately 7.4% (7.6% in Europe). The highest growth was observed in Sweden (over 40%). In the past decade, the value of European and EU markets has more than doubled
● EU consumers spent about €47.4 on organic food per person (€35.5 in Europe). Per capita consumer spending on organic food has almost doubled in the last decade. The Swiss spent the most money on organic food (€221 per capita). In the United States, per capita consumer spending was €85 in 2014
Production highlights
● There were almost 260,000 organic producers in the EU (almost 340,000 in Europe), with the largest numbers in Italy (almost 49,000) and Turkey (over 71,000). The past decade has seen the number of producers grow by 57% in the EU (81% in Europe)
● In the EU, there were almost 50,000 processors (almost 51,000 in Europe) and almost 1,700 importers (approximately 1,900 in Europe). The number of processors and importers increased by 19% and 17% respectively in the EU (18.6% and 16% in Europe) and significantly across almost all countries. The country with the largest number of processors was Italy (over 12,000), while Germany had the most importers (326)
● Organic farmland in the EU constitutes 5.7% of the total agricultural land (2.4% in Europe). In the EU, the country with the highest share of organic agricultural land is Austria (19.4%). In Europe, Liechtenstein has the highest share (31%)
● Organic agricultural land grew by 1.1% in the EU (2.3% in Europe). Growth of organic agricultural land, however, has been substantial over the last decade, having increased by approximately 60% since 2005
● In recent years there has been an overall slow down in growth, especially in Greece or the UK. Stagnation was noted in countries such as Austria, Denmark, Germany and Hungary. However, in other countries such as France, Italy, Slovakia and Slovenia the area increased
ORGANIC MARKET
Table 2: Organic retail market trends in Europe by country group, 2014
Country group Retail sales
(million EUR)
Per capita consumption (EUR)
Growth 2013-2014
EU-28 23,963 47.4 7.4%
Europe 26,203 35.5 7.6%
Global 62,631 8.7
EU-15 23,491 58 7.6%
EU-13 472.4 4
CPC 4 0.1
EFTA 2,099.7 154 10.7%
Other European countries 134.5 0.9
Source: FiBL-AMI Survey 2016 based on national data sources
Table 2 provides a European and global overview of the retail sales for 2014. A more detailed overview of organic retail market trends by country can be found in annex 1.
Retail sales growth and market share
The organic market in the EU increased by 7.4% to €24 billion (€26.2 billion in Europe, 7.6%) in 201425 (see figure 1). All countries for which new data was available showed positive
growth. Germany, as the largest market in Europe, had a growth rate of 4.8%. Some countries with very developed markets such as Norway (25%) and France (10%) had double-digit growth rates. Sweden (45%) witnessed unprecedented growth in consumer demand..26 In the United
11.9 13.5
15.0
16.6 18.1 19.5
21.4 22.7
24.4 26.2
11.1 12.6 14.1
15.5 16.9 18.1
19.8 20.8 22.3
24.0
2005
Billion EUR
2006 2007 2008 2009 2010 2011 2012 2013 2014
0 5 10 15 20 25 30
[image:24.454.35.392.58.314.2]Europe EU-28
Figure 1: Growth of organic retail sales in Europe, 2005-2014
0 1,000
Million EUR
2,000 3,000 4,000 5,000 6,000 7,000 8,000
[image:25.454.62.404.54.570.2]7,910.0 4,830.0 2,307.3 2,145.2 1,817.1 1,402.1 1,064.7 1,018.0 965.0 912.0 435.0 277.8 225.0 120.0 105.5 99.3 90.0 80.0 60.0 48.6 25.0 21.0 7.0 6.0 4.8 4.0 4.0 3.6 1.7 1.5 0.3 77.0 Bosnia and Herzegovina (2013) Cyprus (2006) Montenegro (2010) Turkey (2009) Latvia (2011) Slovakia (2010) Liechtenstein Lithuania (2011) Bulgaria (2010) Portugal (2011) Hungary (2009) Slovenia (2013) Greece (2010) Czech Republic (2013) Romania (2011) Luxembourg Croatia Ireland Poland (2011) Finland Norway Belgium Denmark Netherlands Spain (2013) Austria (2011) Sweden Switzerland Italy UK France Germany
Figure 2: Organic retail sales in Europe by country, 2014
0% 1% 2% 3% 4% 5% 6% 7% 8%
0.2%
Latvia (2011)
0.2%
Slovakia (2010)
0.2%
Lithuania (2011)
0.2%
Portugal (2011)
0.3%
Hungary (2009)
1.8%
Slovenia (2013)
0.7%
Czech Republic (2013)
0.7%
Romania (2011)
3.4%
Luxembourg
2.2%
Croatia
0.7%
Ireland (2011)
0.2%
Poland (2011)
1.7%
Finland
1.5%
Norway
1.8%
Belgium
3.0%
Netherlands
7.6%
Denmark
1.0%
Spain (2013)
6.5%
Austria (2011)
6.0%
Sweden
7.1%
Switzerland
2.2%
Italy
4.4%
Germany
[image:26.454.41.374.54.548.2]France 2.5%
Figure 3: Share of organic retail sales in Europe by country, 2014
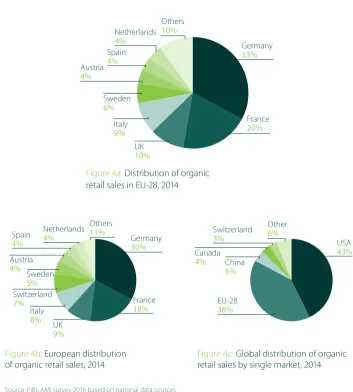
Retail sales distribution
In terms of distribution, Germany (€7.9 billion) remains the largest organic single market in the EU and Europe and second globally after the United States. France (€4.8 billion) held second place in a market that has shown very dynamic growth over the past couple of years.27 The
UK (€2.3 billion) was in third place, followed by Italy (€2.1 billion) (see figure 4a). Switzerland remains the fifth largest market in Europe after Italy (see figure 4b). Comparing organic markets worldwide, the United States was the leading single market (43% of global retail sales), followed by the EU (38%) (see figure 4c).
Source: FiBL-AMI survey 2016 based on national data sources
USA 43% Others 11% France 18% Italy 8% Austria 4% Spain 4% Other 6% Germany 33% Others 10% France 20% UK 10% Italy 9% Sweden 6% Austria 4% Spain 4% Netherlands 4% Netherlands 4% Germany 30% Switzerland 7% Sweden 5% UK 9% Switzerland 3% China 6% Canada 4% EU-28 38%
Figure 4b: European distribution
[image:27.454.58.411.207.599.2]of organic retail sales, 2014
Figure 4a: Distribution of organic
retail sales in EU-28, 2014
Figure 4c: Global distribution of organic
Per capita consumption
Consumer per capita consumption of organic food has almost doubled in the last decade (see figure 5). EU consumers spent around €47 per capita on organic food in 2014 (€36 in Europe, with the Swiss spending the most on organic food (€221)). After Switzerland, the countries with the highest per capita consumption of organic food include Luxembourg (€164), Denmark (€162), and Sweden (€145) (see figure 6). Care must be taken in interpreting these figures as the costs of living across different countries differ quite considerably. Nevertheless, even if adjusted by purchasing power, Switzerland still holds the first place, followed by Luxembourg, Denmark and Sweden.
16.3 18.5
20.6 22.7
24.7 26.5
29.1 30.8
33.0 35.5 22.4 25.5
28.3 31.0
33.7 36.0
39.1 41.3
44.0 47.4
0 5 10 15 20 25 30 35 40 45 50
EUR
2005 2006 2007 2008 2009 2010 2011 2012 2013 2014
[image:28.454.37.388.214.391.2]Europe EU-28
Figure 5: Growth of per capita consumption in Europe, 2005-2014
0 50 100 150 EUR 200 250 Turkey (2009) Bosnia and Herzegovina (2013) Montenegro (2010) Slovakia (2010) Bulgaria (2010) Cyprus (2006) Latvia (2011) Lithuania (2011) Portugal (2011) Hungary (2009) Poland (2011) Romania (2011) Greece (2010) Czech Republic (2013) Spain (2013) Ireland Croatia Slovenia (2013) Italy United Kingdom Belgium Finland EU-28 Netherlands Norway France Germany Austria (2011) Liechtenstein Sweden Denmark Luxembourg Switzerland 221.5 163.7 162.1 145.4 130.1 127.0 96.6 73.4 54.4 57.3 47.4 41.3 38.8 35.9 35.3 26.6 23.4 22.8 21.7 7.3 5.3 3.7 3.1 2.5 2.0 2.0 2.0 1.9 0.9 0.7 0.2 0.1 0.1
Figure 6: Organic per capita consumption in Europe by country, 2014
Marketing channels
A breakdown of different marketing channels in selected European countries shows their relative importance for the sale of organic food (see figure 7). These channels differ in importance from country to country. France, Italy and Germany are good examples of countries with strong market growth. Here, specialised retailers are playing a very important role as a result of growing levels of professionalisation and greater shop space. In the past, countries with established general retailers, largely supermarkets, have recorded steady growth in the organic market (e.g. Austria, Denmark, Sweden, Switzerland, and the United Kingdom). However, the recent economic recession showed the danger of a strong dependence on supermarkets, with the total UK market contracting during 2008-2012. At the same time in countries such as Germany specialised marketing channels grew significantly, while supermarket sales have stagnated, but have started to grow again in 2014.
0% 10% 20% 30% 40% 50% 60% 70% 80% 90% 100%
United Kingdom (2013) Slovenia(2009) Netherlands Luxembourg(2013) Italy Germany France Denmark Croatia Czech Republic (2013) Belgium (2013) Austria (2011)
Marketing channel share (million EUR)
[image:30.454.33.390.274.496.2]General retailers Organic retailers Direct sales Other channels
Figure 7: Organic retail sales by marketing channel in selected EU-28 countries, 2014
Product sales
In many countries, the breakdown of sales value by product is often only available from general retailers, as data is based on trade panel data and does not take other marketing channels into account. At the same time, in countries where trade panel data is used, supermarkets have a market share of 80% to 90%.28
Table 3: Shares of organic product groups by total market in selected European countries, 2014
Product group Austria Belg
ium
Finland Franc
e
G
erman
y
Netherlands (2013) Nor
w
ay
Switz
erland
Beverages 0.9%1 0.6% 3.0%2 1.7% 0.1% 2.7%
Bread and bakery products 1.7% 1.2% 2.5%3 7.1%4 3.2% 1.0% 4.6%
Cheese 8.5% 1.7% 0.9% 1.2% 3.6% 0.5% 6.0%
Eggs 17.2% 11.2% 12.0% 22.1% 16.7% 12.7% 7.5% 22.7%
Fruit 10.7% 3.5% 4.3% 6.7% 1.7% 5 10.1%
Meat and meat products 3.5%6 1.3% 0.6% 1.6% 2.1% 2.8% 0.3% 4.8%7
Milk 15.7% 3.0% 3.2% 10.8% 8.1% 4.0% 18.9%
Milk and dairy products 2.1% 3.2% 8.6% 4.8% 1.8% 11.0%
Vegetables 12.6% 5.4% 3.2%8 4.0% 8.6% 3.9%8 3.6% 14.6%
1 Fruit juices, wine and beer - 2 Vegetable drinks, fruit and vegetable juices, wine and alcohol - 3 Flour was included in previous
data; it is excluded in the new calculations, which also include fresh pastries. Hence this data is not directly comparable with those from 2013. - 4 Bread only - 5 Fruit, berries and nuts - 6 Meat only - 7 Includes fish - 8 Fruit and vegetables
Source: FiBL-AMI Survey 2016 based on national data sources
PRODUCT SALES IN NATIONAL RETAIL MARKETS
There are a number of individual products which have gained considerable shares of their respective total markets in terms of sales value:
● In many countries organic eggs are one of the success stories within the total retail market. Table 3 shows that Switzerland and France, for example, reach market shares in value of over 20%. In most other countries, where data is available, they reach 12% and more
● Organic fruit and vegetables continue to be highly popular purchases among European organic consumers. Organic vegetables have the highest market shares after eggs, representing between 9% and 15% of the sales value of all vegetables sold in Switzerland, Austria, and Germany. Fresh carrots alone, for example, have a 30% market share in Germany
● In some countries, organic dairy products reach market shares of about 5% of all dairy. In Switzerland, they even reach 10%
● Individual products can reach much higher market shares. In Germany organic baby food and meat substitutes, representing over 40% and 60% respectively, are good examples
PRODUCT SALES IN NATIONAL ORGANIC RETAIL MARKETS
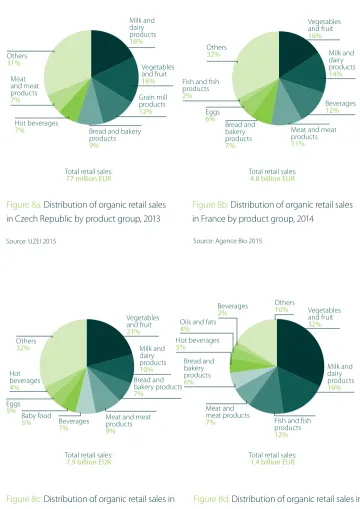
Within the overall organic market in Europe, certain organic products are more dominant than others. A survey carried out as part of the OrganicDataNetwork project30 shows that:
● Fruit and vegetables are pioneering organic products in Europe. They now represent around one fifth of many national organic markets. All over Europe, the organic market is dominated by perishable fresh produce compared to conventional markets. Fresh produce is especially strong in Italy, Ireland, Norway, Sweden, and Germany
● In many countries, and in Northern Europe in particular, animal products, especially milk and dairy products, constitute a high proportion of all organic products sold (up to 20%). Meat and meat products are very successful and constitute around 10% of the organic market in Belgium, the Netherlands, Finland, and France
● Beverages, mainly wine, constitute an important part of the organic market – over 10% in France and Croatia
● Hot beverages (coffee, tea, and cocoa) make up 3% to 5% of the organic market in many countries
● Grain mill products31, which are easily sold and stored in supermarkets, reach high market
shares in the Czech Republic as well as in Finland and Norway
● Bread and bakery products are very important in the organic product range, with a market share of up to 10% in Switzerland, the Netherlands, France, Sweden, Finland, and Germany
Looking more closely at distribution of organic retail sales in the Czech Republic, France, Germany and Sweden (see figure 8a-d)32 shows that – with the exception of the Czech
Source: UZEI 2015 Milk and dairy products 18% Vegetables and fruit 21% Vegetables and fruit 16% Vegetables and fruit 32% Milk and dairy products 14% Milk and dairy products 16% Grain mill products 12% Vegetables and fruit 16% Milk and dairy products 10% Beverages 12%
Meat and meat products
11%
Meat and meat products
7%
Bread and bakery products
9%
Total retail sales:
77 million EUR
Total retail sales:
7.9 billion EUR
Total retail sales:
4.8 billion EUR
Total retail sales:
1.4 billion EUR
Bread and bakery products 7% Bread and bakery products 6%
Meat and meat products 9% Hot beverages 7% Beverages 7% Meat and meat products 7% Eggs
5% Baby food
5% Hot beverages 4% Hot beverages 5%
Oils and fats
4% Others 31% Others 32% Bread and bakery products 7% Eggs 6%
Fish and fish products 2% Others 32% Others 16% Beverages 2%
Fish and fish products
[image:34.454.34.394.67.576.2]12%
Figure 8a: Distribution of organic retail sales
in Czech Republic by product group, 2013
Figure 8c: Distribution of organic retail sales in
Germany by product group, 2014
Figure 8b: Distribution of organic retail sales
in France by product group, 2014
Figure 8d: Distribution of organic retail sales in
Exports and imports
There is almost no data is available on exports and imports. Up to now, organic and conventional items are not differentiated in most countries. In Italy, for example, import volumes are available from third countries using customs data. Germany also uses a multi-method approach to cover organic import volumes of products.33
Denmark is the only country with an additional indicator for organic and conventional products. This provides information on organic imports and exports by product group, country of origin and destination, and can be directly compared to conventional import and export flows.34 Available data for Denmark show that organic imports have quadrupled from
400 million to 1.9 billion Danish crowns between 2005 and 2014. Until now there is no other country that uses this approach for its international trade statistics. This is mainly because it requires amendments in law or is deemed to be complicated for the responsible agencies.
ORGANIC OPERATORS
Table 4: Organic producers, processors, and importers in Europe by country group, 2014
Country group Producers Growth
2013-2014 Processors Growth 2013-2014 Importers Growth 2013-2014
EU-28 257,525 -0.2% 49,968 19.0% 1,650 17.3% Europe 339,824 1.7% 50,774 18.6% 1,847 15.7% Global 2,260,361 13.4% 61,977 20.9% 2,190
EU-15 194,979 0.3% 47,636 19.4% 1,382 14.1%
EU-13 62,546 -1.7% 2,332 11.8% 268 36.7%
CPC 73,375 9.8% 190 -11.6% 70 -5.4%
EFTA 8,500 -3.7% 516 -1.1% 67 -9.5%
Other European countries
424 1.2% 100 -2.9% 60 46.3%
Source: FiBL-AMI surveys 2006-2016 based on Eurostat and national data sources
Table 4 provides a European and global overview of organic operators working in 2014. A more detailed overview of organic producers, processors and importers by country can be found in annex 2.
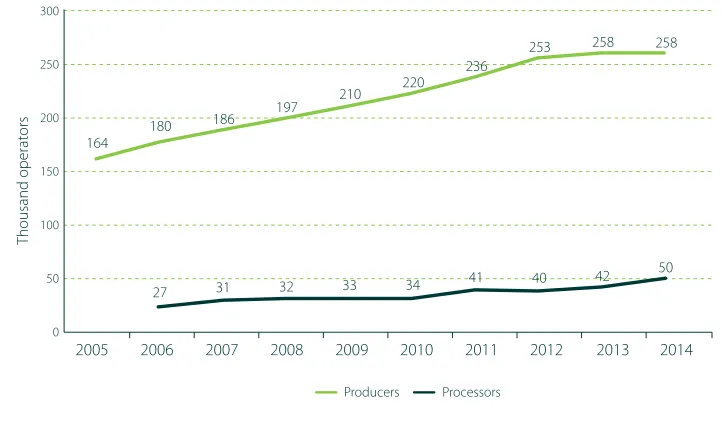
Producers, processors and importers
In 2014, there were almost 260,000 organic producers in the EU and almost 340,000 in Europe. In the EU, the country with the largest number of producers is Italy (almost 49,000), in Europe it is Turkey (over 71,000 – see figure 9). Although there was not much growth in the number of producers in 2014, over the past decade the number of producers in the EU grew by 57% and in Europe by 81% (see figure 10). Almost 15% of the world’s organic farmers are in Europe.36
The number of processors and importers increased in almost all European countries in 2014. In the EU, there were almost 50,000 processors (almost 51,000 in Europe) and almost 1,700 importers (almost 1,900 in Europe). The number of processors and importers increased by 19% and 17% respectively in the EU (18.6% and 16% in Europe) and significantly across almost all countries. The country with the largest number of processors is Italy (over 12,000), and the country with the most importers is Germany (326).
Malta LiechtensteinKosovo Iceland Bosnia and HerzegovinaAlbania
Operators
0 10,000 20,000 30,000 40,000 50,000 60,000 70,000 80,000
Producers Processors
Austria
Belgium Bulgaria
Croatia
Cyprus Czech Republic
Denmark
Estonia Finland France
Germany
Greece
Hungary
Ireland Italy
Lithuania
Luxembourg FYROM Montenegro Netherlands Norway Poland
Portugal Romania
Serbia
Slovakia Slovenia Spain
Sweden Switzerland Turkey
United Kingdom
[image:37.454.60.406.57.460.2]Latvia
Figure 9: Organic producers, processors and importers in Europe by country, 2014
164 180
186 197
210 220 236
253 258 258
27 31 32 33 34 41 40 42
50
0 50 100 150 200 250 300
Thousand operat
ors
2005 2006 2007 2008 2009 2010 2011 2012 2013 2014
[image:38.454.37.398.59.270.2]Producers Processors
Figure 10: Development of organic producers and processors in EU-28, 2005-2014
Source: FiBL-AMI surveys 2006-2016 and OrganicDataNetwork surveys 2013-2015
Certification and control systems
Certification and control systems for organic operators in Europe have been strongly influenced by the development of organic private standards and legal requirements for organic production, as set out in EU legislation since 1991.
Private control bodies Public control authorities Both private control bodies & public control authorities
Figure 11: Organic certification in Europe, 2014
ORGANIC AGRICULTURAL LAND
Table 5: Organic farmland trends in Europe by country group, 2014
Country group Land area
(hectares)
Total land
share Growth 2013-2014 Growth2005-2014
EU-28 10,250,742 5.7% 1.1% 59.5%
Europe 11,625,001 2.4% 2.3% 67.4%
Global 43,662,446 1.0% 1.2% 49.5%
EU-15 7,832,820 6.1% 1.1% 44.0%
EU-13 2,417,922 4.7% 1.1% 144.7%
CPC 508,942 1.5% 6.8% 435.8%
EFTA 196,108 4.4% 2.9% 18.0%
Other European countries
669,209 0.2% 19.4% 159.3%
Source: FiBL-AMI Survey 2016 based on Eurostat and national data sources
Table 5 provides a European and global overview of organic agricultural land38 in 2014. A more
detailed overview of organic farmland trends by country for 2014 can be found in annex 3.
Land area and distribution
As of 2014, 10.3 million hectares of agricultural land in the EU and 11.6 million hectares in Europe are organic (this figure refers to agricultural land that is fully converted or in-conversion). The countries with the largest areas of organic land are Spain (1.7 million hectares, one sixth of organic farmland in Europe), Italy (1.4 million), France (1.1 million) and Germany (1.05 million) (see figure 12 and 13a-c).
34 114 353 1,135 3,146 3,289 3,887 4,490 9,548 11,174 41,237 49,159 49,827 50,054 51,871 66,704 74,351 124,841 133,973 155,560 164,390 165,773 180,307 203,443 212,346 212,653 256,131 289,252 472,663 491,977 501,831 521,475 525,521 657,902 1,047,633 1,118,845 1,387,913 1,710,475 Malta Kosovo Bosnia and Herzegovina Liechtenstein 515 Albania FYROM Montenegro Cyprus Luxembourg Serbia Iceland Slovenia Netherlands Norway Croatia Ireland Belgium Bulgaria Hungary Switzerland Estonia Lithuania Denmark Slovakia Latvia Portugal Finland Greece1 Romania Czech Republic Turkey Sweden United Kingdom Austria Poland Germany France Italy Spain Hectares 500,000
0 1,000,000 1,500,000 2,000,000
1 The figure reported in this book was provided by the Greek Ministry of Agriculture and differs from the figure reported by
[image:41.454.59.414.50.576.2]EUROSTAT, which is 362,826 hectares.
Source: FiBL-AMI survey 2016 based on Eurostat and national data sources Australia 39% Argentina 7% USA 5% Others 27% France 10% Poland 6% Germany 9% Italy 12% UK 4% Sweden 4% Other 29% Spain 17% Italy 14% Others 22% France 11% Germany 10% Poland 6%
Total organic farmland:
10.3 million hectares
Total organic farmland:
11.6 million hectares Total organic farmland: 43.7 million hectares
UK 5% Sweden 5% Czech Republic 5% Austria 5% Spain 15% Turkey 4% Austria 5% Spain 4% Italy 3% France 3% Uruguay 3% Germany 2% China 5% Czech Republic 4%
Figure 13a: Distribution of organic
farmland in EU-28, 2014
Figure 13b: European distribution of
organic farmland, 2014
Figure 13c: Global distribution of
[image:42.454.36.390.59.547.2] [image:42.454.113.304.91.226.2]Total land area share
In the EU, organic land constitutes 5.7% of the total agricultural land (2.4% in Europe). In the EU, the country with the highest share of organic agricultural land is Austria (19.4%), Liechtenstein (31%) has the highest share in Europe (see figure 14). In the EU-15, 6.1% of agricultural land was organic, representing a higher share than in the EU-13 (4.7%). Among the new Member States, over 10% of agricultural land in Estonia, the Czech Republic, and Latvia is organic. Despite high share of organic land in some of the new Member States, overall organic production remains low due to the high share of grassland in some countries and a lack of processing facilities. For candidates and potential candidates for EU membership, shares of organic land are still low, whereas shares are very high for two EFTA countries, namely Switzerland (12.7%) and Liechtenstein (31%).
0.02% 0.03% 0.04% 0.3% 0.3% 0.5% 0.6% 1.3% 2.0% 2.1% 2.4% 2.5% 2.7% 2.7% 3.0% 3.1% 3.4% 3.8% 4.1% 4.3% 4.9% 6.3% 6.3% 6.3% 6.9% 8.9% 9.4% 9.5% 10.8% 11.1% 11.2% 12.7% 16.2% 16.4% 19.4% 30.9% Bosnia and Herzegovina Kosovo Albania FYROM Malta Iceland Montenegro Ireland
0% 5% 10% 15% 20% 25% 30% 35%
[image:44.454.34.399.59.566.2]Turkey Romania Bulgaria Netherlands Cyprus Hungary United Kingdom Greece Luxembourg Croatia France Poland Belgium Denmark Germany Portugal Spain Slovenia Finland Slovakia Italy Czech Republic Latvia Switzerland Estonia Sweden Austria Liechtenstein 0.2% Serbia 5.7% Lithuania 5.7% EU-28 4.6% Norway
Land area growth
Despite the dynamic development of organic farmland in Europe over the last number of decades, in 2014 there was little growth of agricultural land in the EU (1.1%, 110,000 hectares) and in Europe (2.3%, 260,000 hectares) (see figure 15).
The countries with the largest increase in organic land were Spain (100,000 hectares), Italy (70,000 hectares), and France (60,000 hectares). A major decrease was noted for Greece (130,000 hectares) and the United Kingdom (37,000 hectares).
Since 2005, organic agricultural land area has increased by 60% in the EU (70% in Europe). In the EU-15, growth was slower (44%), whereas in the new Member States, organic land area increased by 144%. In many EU-15 countries, the organic farmland had already grown to a comparatively high level before 2005. For candidates and potential candidates for EU membership, high growth (over 400%) was noted in that time period. Most of the growth of the past years was in Turkey, whereas, in the EFTA countries, growth was modest (18%, 2005-2014). However, with 2.9%, the EFTA countries showed stronger growth than the EU in 2014.
2.5 5.0 7.5
M
illion hec
tar
es
10.0 12.5
1986 1988 1990 1994 1996 1998 2000 2002 2004 2006 2008 2010 2012 2014
Europe EU-28
[image:45.454.55.396.326.567.2]0.0
Figure 15: Growth of organic farmland in Europe, 1985-2014
Land area in conversion
In the EU, of the 10.3 million hectares of organic agricultural land, 7.3 million hectares were fully converted (7.7 million in Europe) and 1.4 million were under conversion (1.6 million in Europe). Most, but not all, countries provided data on their fully converted and under-conversion areas – no details are available for Austria, Germany, and Switzerland. In the EU, the fully converted area has increased by more than 300,000 hectares compared to 2013, which is greater than the overall increase in organic farmland.
Figure 17 shows that in Spain, Italy, France, Poland, Romania and Turkey, large areas were under conversion, and therefore a major increase in supply may be expected from these countries in the near future.
In the EU and in Europe, almost 0.5 million hectares of permanent grassland were under conversion as well as 0.52 million hectares of arable land (0.6 million in Europe) and 0.27 million hectares of permanent crops (0.36 million in Europe).
EU‐28 Europe
0 2,000,000 4,000,000 6,000,000 8,000,000 Hectares
10,000,000 12,000,000 14,000,000
[image:46.454.34.390.299.526.2]Area fully converted Area under conversion Not specified
Figure 16: Conversion status of organic farmland in Europe, 2014
Hectares
0 500,000 1,000,000 1,500,000 2,000,000
UK
Turkey
Switzerland Sweden Spain
Slovenia Slovakia
Serbia Romania
Portugal Poland
Norway Netherlands
Montenegro
Malta FYROM Luxembourg Lithuania
Liechtenstein Latvia
Kosovo Italy
Ireland
Iceland Hungary Greece Germany France
Finland
Estonia Denmark Czech Republic
Cyprus Croatia Bulgaria
Bosnia and Herzegovina Belgium Austria
Albania
[image:47.454.55.405.59.553.2]Area fully converted Area under conversion Not specified
Figure 17: Conversion status of organic farmland in Europe by country, 2014
ORGANIC LAND USE, CROPS AND LIVESTOCK
Table 6: Organic farmland by land use type in Europe by country group, 2014
Land use type
(million hectares)
Arable
crops Total land use share
Perma-nent crops
Total land use share
Perma-nent grass-land
Total land use share
Total land1
EU-28 4.11 3.80% 1.19 10.03% 4.6 6.96% 10.25 Europe 5.06 1.82% 1.36 8.88% 4.8 2.71% 11.63 Global 8.51 0.60% 3.42 2.08% 27.46 0.82% 43.66 EU-15 3.04 4.27% 1.08 10.35% 3.41 6.52% 7.83 EU-13 1.07 2.89% 0.11 7.67% 1.19 8.65% 2.42
CPC 0.34 1.30% 0.16 4.18% 0.02 0.11% 0.51
EFTA 0.06 3.14% 0.002 6.26% 0.12 4.10% 0.20
Other European
countries 0.54 0.33% 0.01 0.39% 0.05 0.05% 0.67
1 Includes other agricultural land
Source: FiBL-AMI survey 2016 based on Eurostat and national data sources with shares calculated based on FAO data.
Table 6 provides a European and global overview of organic agricultural land use in 2014.A more detailed overview of organic land use by country can be found in annex 4.39
Land use
For all countries in Europe, land use and crop details are available. In this respect, Europe differs substantially from other parts of the world, for which such data is often not available.
In 2014, in the EU-28, 4.1 million hectares or 40% of farmland (5.1 million hectares in Europe), were used for arable crops, and 4.6 million hectares or 45% of farmland were used as grassland (4.8 million hectares in Europe). Approximately 1.2 million hectares, or 12% of farmland, were used to grow permanent crops (1.4 million hectares in Europe) (see figure 18a-c).
All categories of land use have grown steadily since 2004. The largest increase was for permanent crops, which have almost doubled since 2004 (see figure 19).
Apart from agricultural land, there are large areas of wild collection in the EU (12 million hectares) and Europe (16.3 million hectares). The largest area is in Finland (berries) followed by a number of countries in Southeast Europe.
Source: FiBL-AMI survey 2016 based on Eurostat and national data sources
Permanent grassland
45%
Permanent grassland
63%
Other agricultural land
3%
Other agricultural land
10%
Arable crops
40%
Arable crops
19%
Permanent crops
12%
Permanent crops
8%
Permanent grassland
41%
Other agricultural land
4%
Arable crops
43%
Permanent crops
12%
Figure 18a: Use of organic
farmland in EU-28, 2014
Figure 18b: European use of organic
farmland, 2014
Figure 18c: Global use of organic
[image:49.454.49.411.121.543.2]2.5 2.6
2.9 2.9 3.2
3.5 3.7
3.9 4.0 4.1
0.7 0.6 0.6 0.7 0.8 0.9
1.0 1.0 1.2 1.2 3.0
3.2 3.2
3.8 4.0 4.3
4.5 4.7 4.5 4.6
0.0 0.5 1.0 1.5 2.0 2.5 3.0 3.5 4.0 4.5 5.0
Arable crops Permanent crops Permanent grassland
M
illion hec
tar
es
[image:50.454.36.398.50.309.2]2005 2006 2007 2008 2009 2010 2011 2012 2013 2014
Figure 19: Growth of organic farmland by land use type in EU-28, 2005-2014
Source: FiBL-AMI surveys 2006-2016 and OrganicDataNetwork surveys 2013-2015
Million hectares Spain Italy France Poland Greece Portugal Germany Bulgaria Romania Austria
0 0.5 1.0
Spain Germany France Italy UK Austria Poland Portugal Slovakia Million hectares
0 0.2 0.4 0.6 Million hectares
PERMANENT GRASSLAND ARABLE CROPS PERMANENT CROPS
France Italy Germany Poland Sweden Spain Austria Romania Finland UK
0 0.2 0.4 0.6
0.82 0.57 0.41 0.41 0.40 0.37 0.33 0.21 0.15 0.12 0.60 0.57 0.44 0.39 0.38 0.24 0.19 0.18 0.17 0.15 0.54 0.34 0.10 0.06 0.05 0.03 0.02 0.01 0.01 0.01 Czech Republic
Figure 20: Top 10 countries with the largest organic farmland areas by land use type in EU-28,
[image:50.454.38.399.374.557.2]Crop production
Table 7: Top 10 organic crops in Europe by country group, 2014
Country
groups Crop Land area (hectares) Growth 2013-2014 Growth 2005-2014
EU-28 Plants harvested
green 1,825,988 1.5% 104.3%
Europe 2,040,924 2.6% 117.7%
EU-15 1,393,619 2.1% 88.0%
EU-13 432,370 -0.3% 183.5%
CPC 128,979 -1.0%
EFTA 44,749 -0.7% 2.4%
Other European countries
41,208 184.3%
EU-28 Cereals 1,525,662 -0.3% 37.8%
Europe 1,911,506 3.1% 70.7%
EU-15 1,098,430 1.2% 15.6%
EU-13 427,232 -4.1% 171.6%
CPC 163,794 0.2%
EFTA 14,295 -3.4% 15.8%
Other European countries
208,281 42.6%
EU-28 Olives 416,021 -0.1% 61.2%
Europe 492,183 2.6% 90.8%
EU-15 413,212 -0.1% 60.5%
EU-13 2,809 -6.0% 355.2%
CPC 76,162 20.1%
EU-28 Dried pulses and
protein crops 255,019 25.2% 244.0%
Europe 299,229 25.0% 302.1%
EU-15 205,153 16.4% 234.9%
EU-13 49,865 29.3% 287.6%
CPC 21,577 156.7%
EFTA 726 -10.7% 145.1%
Other European countries
21,907 42.2%
EU-28 Grapes 251,514 2.4% 220.5%
Europe 266,212 2.7% 204.6%
EU-15 242,523 2.9% 213.8%
EU-13 8,991 -8.0% 661.6%
CPC 9,257 8.9% 99.9%
EFTA 643 15.5% 125.4%
Other
Country
groups Crop Land area (hectares) Growth 2013-2014 Growth 2005-2014
EU-28 Nuts 154,175 -6.0% 180.9%
Europe 180,802 -4.2% 220.9%
EU-15 144,143 -2.9% 164.8%
EU-13 10,032 -35.2% 2088.4%
CPC 26,288 7.7%
Other European countries
340 25.5%
EU-28 Oilseeds 168,783 10.1% 129.4%
Europe 245,693 25.1% 232.7%
EU-15 84,613 5.9% 108.5%
EU-13 84,170 14.8% 155.1%
CPC 5,064 30.7%
EFTA 576 16.0% 281.6%
Other European countries
71,270 84.2%
EU-28 Vegetables 118,606 7.3% 76.3%
Europe 131,896 9.4% 92.1%
EU-15 85,853 6.5% 41.0%
EU-13 32,753 9.5% 412.7%
CPC 2,748 9.0%
EFTA 2,211 15.2% 68.0%
Other European countries
8,331 47.6%
EU-28 Temperate fruit 108,059 -12.4% 122.1%
Europe 127,478 -8.5% 150.4%
EU-15 47,684 -13.3% 37.3%
EU-13 60,375 -11.7% 333.3%
CPC 16,359 22.3% 879.6%
EFTA 724 -5.1% 30.8%
Other European countries
2,337 33.0%
EU-28 Citrus fruit 37,753 2.1% 72.8%
Europe 38,232 2.0% 75.0%
EU-15 37,691 2.2% 72.6%
EU-13 61 -7.4% 365.2%
CPC 479 -8.4%
[image:52.454.33.392.52.549.2]Source: FiBL-AMI survey 2016 based on Eurostat and national data sources
1826 . 0 894 . 0 1107 . 3 1525 . 7 258 . 0 416 . 0 74 . 1 255 . 0 78 . 5 251 . 5 73 . 6 168 . 8 54 . 9 154 . 2 67 . 3 118 . 6 48 . 7 108 . 1 21 . 9 37 . 8 0 200 Plants har vest ed gr een Cer eals Oliv es Dr ied pulses and pr ot ein cr ops
Grapes Oilseeds Nuts
[image:53.454.55.411.49.387.2]Vegetables Temperat e fruit Citrus fruit 400 600 800 1,000 1,200 1,400 1,600 1,800 2,000 Thousand hec tar es 2005 2014
Figure 21: Development of selected organic crop groups in EU-28, 2005-2014
Source: FiBL-AMI surveys 2006-2016 and OrganicDataNetwork surveys 2013-2015
ARABLE CROPS
Plants harvested green from arable land account for 1.8 million hectares of the arable land among the EU-28 (2 million hectares in Europe), followed by 1.5 million hectares of cereals (1.9 million hectares in Europe) (see table 7). Italy, Germany, and Spain have the most land for cereal production in the EU-28 (see annex 5).
In 2014, organic vegetables were grown on 118,600 hectares of land in the EU-28 (131,000 hectares in Europe). The largest areas were in Poland, Italy, France, and the United Kingdom (note that for some countries potatoes are included in the vegetable category).
Organic dried pulses and protein crops achieved the highest share (21.5% in the EU-28, 7.3% in Europe), mainly because the conventional crop area has been decreasing for many years due to the availability of cheap soybeans for both animal feed and human consumption on the world market.
Organic vegetables represent 5.5% of the total organic farmland in the EU-28 (2.7% in Europe) and 7.2% of the area for temperature fruit (2.7% in Europe) have achieved comparatively high shares in meeting the high consumer demand for fresh vegetables and fruit.
PERMANENT CROPS
Livestock
Table 8: Organic livestock by animal type and total share in EU-28 and Europe, 2014
Animal type
EU-28 Europe
Animals (per
head) Total animal share Animals (per head) Total animal share
Cattle1 3,273,285 4.1% 3,487,237 2.8%
Goats 697,015 5.7% 730,647
Sheep 4,256,342 4.3% 4,483,164 2.9%
Pigs 845,305 0.5% 877,463 0.4%
Poultry 35,116,136 2.3% 36,941,068 1.4%
1 Includes beef and dairy cattle, buffalo
Source: FiBL-AMI Survey 2016 based on FAOSTAT, Eurostat and national data sources
Table 8 provides a European overview of organic livestock in 2014.40 In many countries, organic
animal husbandry began with beef, milk and sheep production. Livestock products continue to have the highest organic share of the overall sector. In the EU-28, 3.3 million bovine animals, 4.3 million sheep, 0.8 million pigs, and 35 million poultry were kept.
The greatest increase between 2007 and 2014 was for poultry, which must partly be attributed to the high demand for eggs (see the chapter on the organic market) (+83%). However, beef and dairy cattle also grew substantially (+57%), as did pigs (+36%) and sheep (+30%) (see figure 22). Organic animal livestock numbers remain limited in comparison with the total animal production in Europe and the EU-28 (between 0.5% and 4%, depending on the animal species). Monogastric animals (pigs and poultry) have the lowest shares, partly because of the difficulties posed by the insufficient internal supply of organic feeds, the difficulties in the provision of traceable certified feed imports and the high price premiums consumers have to pay. The highest shares are found for organic sheep and cattle. These meat types are considered to be of premium value in the conventional market and realise higher prices; therefore organic premiums are lower.
Milk production has almost doubled since 2006 in order to meet rising demand for milk and dairy products. Organic dairy cows milk production now stands at 3.8 million metric tons, constituting more than 2.6% of EU milk production from dairy cows in 2014.41Some of this
growth, however, must be attributed to improved data availability (see figure 23).
Cattle1 Pigs Sheep Poultry
2007 2008 2009 2010 2011 2012 2013 2014
2,500,000 0 5,000,000 7,500,000 10,000,000 12,500,000 15,000,000 17,500,000 20,000,000 22,500,000 25,000,000 27,500,000 30,000,000 32,500,000 35,000,000 37,500,000
[image:56.454.28.382.50.293.2]1 Includes beef and dairy cattle, buffalo
Figure 22: Development of organic livestock in EU-28 by animal type, 2007-2014
Source: FiBL-AMI surveys 2006-2016 based on FAOSTAT, Eurostat and national data sources
2007 2008 2009 2010 2011 2012 2.4 2.4 2.6
2.8
3.0 3.1
3.3
3.8
2014 2013
M
illion metr
ic t
onnes
0 1 2 3 4 5
[image:56.454.35.381.363.580.2]ANIMAL FEED
Fresh and conserved forage from grassland is the primary source of animal feed for organic ruminants such as bovines and sheep supplemented by concentrate feedstuffs as an additional source of protein and energy. However, for organic monogastrics such as pigs and poultry, the availability and suitability of organic feedstuffs remains a challenge for developing 100% organic feeding strategies that comply with organic principles in terms of animal health and welfare and overall sustainability. Currently a complete picture of demand and supply for organic animal feed is unavailable in any EU Member States or other European countries.
[image:57.454.56.414.361.520.2]Estimates based on 2011 data indicate that the total demand for dry matter organic concentrate feed in Europe was 2,350,000 metric tonnes. 2011 data for selected European countries – which accounted for the majority of organic livestock: pigs (85%), poultry (80%) and cattle (70%) – showed a total dry matter demand of 1,923,000 metric tons with over 50% fed to bovine animals, 16% to pigs and 30% to poultry. In these countries the overall demand for crude protein was 300,000 metric tons with 49% fed to bovine animals, 34% to poultry and 17% to pigs42 (see table 9).
Table 9: Production and demand for organic concentrate feed in selected
European countries, 2011
Country Concentrate feed production
in dry matter (metric tonnes) Total demand for concentrate feed in dry matter (metric tonnes)
Austria 143,127 161,928
Denmark 125,899 194,761
Finland 26,021 20,815
France 334,084 323,959
Germany 305,141 445,074
Netherlands 9,142 146,461
Sweden 182,610 227,476
Switzerland 8,959 60,803
United Kingdom 140,502 330,428
Total 1,275,485 1,911,705
European total (est.) 2,350,000
Source: FiBL calculation based on information from ICOPP partners (Früh et al. 2015)