Computational Techniques
for Automated Tracking
and Analysis of Fish
Movement in Controlled
Aquatic Environments
Tomasz Hubert Pinkiewicz, BComp(Hons)
Submitted in fulfilment of the requirements for the Degree of Doctor of Philosophy
Declarations and Statements
Declaration of Originality
This thesis contains no material which has been accepted for a degree or diploma by the University or any other institution, except by way of background informa-tion and duly acknowledged in the thesis, and to the best of the my knowledge and belief no material previously published or written by another person except where due acknowledgement is made in the text of the thesis, nor does the thesis contain any material that infringes copyright.
Authority of Access
This thesis may be available for loan and limited copying in accordance with Copyright Act 1968.
Statement of Ethical Conduct
The research associated with this thesis abides by the international and tralian codes on human and animal experimentation, the guidelines by the Aus-tralian Government’s Office of the Gene Technology Regulator and the rulings of the Safety, Ethics and Institutional Biosafety Committees of the University.
Acknowledgements
A lot of people supported me throughout my candidature but perhaps the most important was the support of my family. My children, Monique and Michael, have always known me as the “Uni student” and while I can never recoup the time I have missed out with them, at least now I will be able to to devote my time to them. My wife’s initial enthusiasm turned into “Hurry up and finish” but she was always there for me, putting up with my moods. Thank you for letting me accomplish this, you will have your old Tom back now. To our parents, for helping our young family during these years - great thanks.
This thesis would not be possible without the great support from my super-visors - Dr. Mike Cameron-Jones, Professor John Purser and Dr. Ray Williams (ret.). Early on, the guidance and our exchange of ideas with John and Ray gave me a two path approach to my research, sea cages and tanks, something which I persevered with for the rest of the thesis. Throughout, our regular meetings kept pushing me forward even in times of poor discipline and feedback was al-ways around the corner. In final stages, the feedback from Mike and John on the structure and content of the thesis was invaluable and helped me get to the end in a timely manner.
Thanks go to support staff at School of Computing and Information Systems and National Centre for Marine Conservation and Resource Sustainability. They have spent lots of time helping me setup software and hardware required for my work. Also thanks go to the administration staff for assistance with all things big and small. Great appreciation to Denis for his very valuable proof-reading in the final stages of thesis writing.
During my travels I have met many people in the area of aquaculture. On the industry side, perhaps the greatest thanks go to staff at Van Diemen Aquaculture Pty Ltd for letting me carry out my recordings on the farm, even when at times I was a nuisance. I also met several aquaculture researchers who have provided me with feedback and encouragement in regards to my work. Thanks Neil, Chris and Sunil.
Abstract
This thesis presents research on automated video analysis using computer vision systems, for analysing fish movements and behaviours in sea cages and tanks.
Video technology is widely used in aquaculture to observe fish movements, however these observations can be subjective and fish can only be observed for short periods due to the manual labour required and observer fatigue. In research, the analysis of video footage is tedious and very time consuming, requiring sam-pling to make it feasible. It is therefore desirable to automate such analysis and provide users with a tool that can gather data about fish movements in real-time, continuously, objectively and at a high sampling rate. The aim of this thesis is to develop and validate computer vision systems to track fish automatically in sea cages and tanks.
Three computer vision systems are proposed, one for sea cages and two for tanks, and they consist of two major stages. The first stage extracts fish images from complex backgrounds in video footage through the process of segmentation. The second stage is responsible for tracking multiple detected fish by associating newly extracted objects with existing tracks of fish. The system developed for use in sea cages tracks fish for short periods and generates measures of fish movement - their average swimming speed and direction. The first system used in tanks tracks a small number of fish over a long period of time with the purpose of long-term observation of spatial location and agonistic behaviours between individuals. The second system used in tanks is based on the one developed for sea cages and is used to track small groups of fish, with the purpose of observing groups’ spatio-temporal patterns rather than movements of individuals.
When using the sea cage system, variations in swimming speed and direction were observed within days and between days. Some of these variations could be attributed to water current changes due to tides, but no consistent patterns were observed in relation to time of day or feeding. During the transfer of Atlantic salmon smolts from a freshwater hatchery to sea cages, a pattern of non-schooling behaviour during the first 3-5 weeks was observed, followed by a sharp transition to schooling behaviour.
inlet.
The sea cage system has a potential application in the commercial setting, where it can be used to develop behavioural profiles of fish and act as an alarm system if unusual behaviours are detected. From the research point of view, use of these automated systems improves the process of gathering data about fish movements, provides a high level of sampling and increases the speed of video processing, which is currently based on manual observation of fish movement. Time can be spent on analysing the data rather than on extracting it from video. While there is some requirement for data analysis in this system, the benefits in extracting data from the video automatically far outweigh the requirement for data analysis.
Keywords: target tracking, image and video processing, aquaculture, fish
Contents
Declarations and Statements ii
Acknowledgements iii
Abstract v
1 INTRODUCTION 1
1.1 Research Background . . . 1
1.2 Justification for Research . . . 2
1.3 Research Aims . . . 3
1.4 Key Assumptions and Limitations . . . 3
1.5 Animal Ethics Approval . . . 4
1.6 Outline of the Thesis . . . 4
2 THE USE OF TECHNOLOGY IN FISH BEHAVIOUR RE-SEARCH 6 2.1 Introduction . . . 6
2.2 Behaviours in Sea Cages . . . 7
2.3 Behaviours in Small Research Tanks . . . 10
2.4 Computer Vision in Aquaculture/Marine Science . . . 11
2.4.1 Size Measurement and Stock Assessment . . . 11
2.4.2 Fish Behaviour . . . 13
2.5 Other Technologies . . . 14
2.5.1 Acoustics and Acoustic Telemetry . . . 14
2.5.2 Radio Telemetry . . . 17
3 IMAGE AND VIDEO SEGMENTATION 20
3.1 Introduction . . . 20
3.1.1 Computer Vision Applications . . . 20
3.2 Image Segmentation Techniques . . . 22
3.2.1 Image Pre-processing . . . 22
3.2.2 Thresholding . . . 23
3.2.3 Edge Detection . . . 25
3.3 Motion segmentation . . . 26
3.3.1 Temporal differencing . . . 27
3.3.2 Background subtraction . . . 27
3.3.3 Hybrid methods . . . 28
3.4 Camera Stabilisation . . . 30
3.5 Summary . . . 31
4 TARGET TRACKING AND DATA ASSOCIATION 33 4.1 Introduction . . . 33
4.2 State Estimation of Dynamic Systems . . . 34
4.2.1 Kalman Filter . . . 34
4.2.2 Kalman Filter Variations . . . 36
4.2.3 Particle Filter . . . 38
4.2.4 Colour Particle Filter . . . 41
4.2.5 Joint Multi-target Probability Density . . . 45
4.3 Data Association . . . 46
4.3.1 Validation Gate . . . 48
4.3.2 Global Nearest Neighbour (GNN) . . . 48
4.3.3 Multidimensional Assignment Problem (MDA) . . . 49
4.3.4 Other Data Association Methods . . . 50
4.4 Global Motion Patterns . . . 50
5 ESTIMATING FISH MOVEMENT IN SEA CAGES 54
5.1 Introduction . . . 54
5.2 Image and Video Segmentation . . . 55
5.2.1 Global Thresholding . . . 55
5.2.2 Adaptive (Local) Thresholding . . . 57
5.2.3 Edge Detection . . . 57
5.2.4 Median Background Estimation . . . 57
5.2.5 Mean Background Estimation . . . 58
5.2.6 Day/Night Detection . . . 58
5.2.7 Object Extraction . . . 59
5.3 Tracking and Data Association . . . 59
5.3.1 Kalman Filter . . . 59
5.3.2 Data Association . . . 63
5.4 Target management . . . 63
5.4.1 Target selection . . . 63
5.4.2 Target confirmation . . . 64
5.4.3 Target deletion . . . 64
5.5 Target Statistics . . . 65
5.5.1 Buffer-based approach . . . 65
5.5.2 Time-based approach . . . 65
5.5.3 Data Storage . . . 66
5.5.4 Data Display . . . 67
5.6 Accuracy of the System . . . 67
5.6.1 Recording Details . . . 68
5.6.2 Accuracy Test . . . 68
5.7 Camera Stabilisation . . . 71
5.8 Global Motion Patterns . . . 71
5.9 Summary . . . 73
6.2 Materials and Methods . . . 74
6.2.1 Experiment 1 - Influence of tidal cycle on fish movement . 75 6.2.2 Experiment 2 - Daily swimming profile in the summer dur-ing an outbreak of AGD . . . 78
6.2.3 Experiment 3 - Smolt behaviour post-transfer from hatch-ery to sea cage . . . 78
6.2.4 Experiment 4 - Relation between water current flow, tides and fish movement . . . 80
6.3 Results . . . 81
6.3.1 Experiment 1 - Influence of tidal cycle on fish movement . 81 6.3.2 Experiment 2 - Daily swimming profile in the summer dur-ing an outbreak of Amoebic gill disease (AGD) . . . 88
6.3.3 Experiment 3 - Smolt behaviour post-transfer from hatch-ery to sea cage . . . 91
6.3.4 Experiment 4 - Relation between water current flow, tides and fish movement . . . 107
6.4 Discussion . . . 118
6.4.1 Experiment 1 - Influence of tides on fish movement . . . . 118
6.4.2 Experiment 2 - Daily swimming profile in the summer dur-ing outbreak of AGD . . . 119
6.4.3 Experiment 3 - Smolt behaviour after transfer from hatch-ery to sea cage . . . 120
6.4.4 Experiment 4 - Relation between water current flow, tides and fish movement . . . 122
6.5 Summary . . . 123
7 TRACKING INDIVIDUAL FISH IN TANKS 125 7.1 Introduction . . . 125
7.2 Materials and Methods . . . 126
7.2.1 Background Estimation and Motion Segmentation . . . 126
7.2.2 Colour Particle Filter . . . 127
7.2.3 Data association . . . 133
7.2.5 Compilation and Display of Data . . . 135
7.3 Results . . . 136
7.3.1 Sequence 1 . . . 136
7.3.2 Sequence 2 . . . 144
7.4 Discussion . . . 149
8 TRACKING A SMALL GROUP OF FISH IN TANKS 151 8.1 Introduction . . . 151
8.2 Materials and Methods . . . 151
8.2.1 Experiment Set-up . . . 152
8.2.2 Tracking System . . . 153
8.3 Results . . . 153
8.3.1 Feeder Activation Patterns . . . 153
8.3.2 Speed . . . 154
8.3.3 Distance From the Feeding Area . . . 156
8.3.4 Direction . . . 156
8.3.5 Single Day Analysis . . . 158
8.4 Discussion . . . 161
8.5 Summary . . . 162
9 CONCLUSIONS 163 9.1 Summary of Results . . . 163
9.1.1 Technology Development . . . 163
9.1.2 Analysis of Fish Movement in Sea Cages . . . 165
9.1.3 Tracking of Fish in Research Tanks . . . 166
9.2 Limitations of Video Analysis in Aquaculture . . . 167
9.2.1 Video Limitations . . . 167
9.2.2 Computer Vision Limitations . . . 168
9.3 Significance . . . 169
Appendices 173
A PARTICLE FILTER PSEUDO CODE 174
B TIDAL, FEEDING AND ENVIRONMENTAL DATA FOR SEA
CAGE EXPERIMENTS 177
B.1 Tide experiment - 10-15 April 2008 . . . 177
B.2 Freshwater bathing experiment - 21st Jan - 19th Feb 2009 . . . . 178
B.3 Smolt experiment - 21st April 2009 - 31th May 2009 . . . 180
C SMALL GROUPS IN TANKS GRAPHS 183
List of Tables
4.1 More common data association techniques. . . 47
4.2 Assignment Matrix for GNN algorithm - distances with stars min-imise the total cost of assignment (Ristic, 2007). . . 49
5.1 SQL database table for sea cage data . . . 66
5.2 Descriptive statistics of differences between automated and man-ual estimations. Median and inter-quartile range (IQR) were used to reduce the influence of outliers. . . 69
5.3 Source of errors within the tracking system. . . 71
6.1 Response variables for the smolt dataset. . . 80
6.2 Change in swimming speed observed in the middle of the ebb tide. 84 6.3 Change in swimming speed observed in the middle of the rising tide. . . 84
6.4 Low-to-high tide amplitude before and after bathing. . . 91
6.5 Moon phase percentage and tide amplitude during Experiment 4. 113 7.1 Colour Particle Filter Pseudo-Code. . . 128
9.1 Limitations of video technology in marine environment and con-siderations required when applying computer vision techniques in aquaculture research. . . 167
A.1 Colour Particle Filter Pseudo Code. . . 174
A.2 Independent Partition Pseudo Code. . . 175
A.3 Coupled Partition Pseudo Code. . . 175
A.4 Adaptive Partition Pseudo Code. . . 175
A.5 Regime Transition. . . 176
B.1 Tide times for tide recording. . . 177
B.3 Tide times for freshwater bathing recordings. . . 178
B.4 Meal times for freshwater bathing recordings. . . 179
B.5 Environmental data for freshwater bathing recordings. . . 179
B.6 Tide times for smolt recordings. . . 180
B.7 Meal times for smolt recordings. All meals were 20% of the daily intake. . . 181
List of Figures
3.1 Grey-scale, unthresholded image . . . 23
3.2 Global thresholding of Figure 3.1 . . . 24
3.3 Adaptive thresholding of Figure 3.1 . . . 25
3.4 Edge detection of Figure 3.1 . . . 26
4.1 Two stages of the Kalman Filter providing a recursive solution able to process data sequentially. . . 35
5.1 Simulink based tracking system to analyse fish movement in aqua-culture sea cages. . . 56
5.2 Target tracking module. . . 60
5.3 Histograms of differences between manual estimates and auto-mated estimates. (i) Direction, (ii) Length, (iii) Speed in pix-els/second, (iv) Speed in body lengths/second. . . 69
5.4 Influence of length and speed errors, for each sample, on the body lengths per second errors. . . 71
5.5 Generation of sink paths . . . 72
5.6 Generation of supertracks . . . 73
6.1 Van Diemen Aquaculture farm in relation to the Tamar River (oriented North). . . 76
6.2 Current farm layout at Van Diemen Aquaculture. . . 77
6.3 Direction during 10-15 April 2008 in Cartesian and polar coordi-nates . . . 82
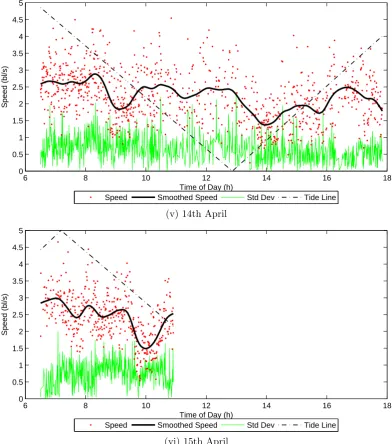
6.4 Speed during 10-15 April 2008. . . 85
6.5 Swimming speed before bathing and after bathing. . . 89
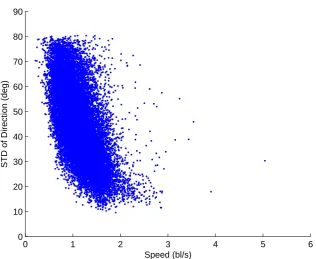
6.7 Scatter plot of speed vs standard deviation of direction. . . 92
6.8 Variations in swimming direction for each day in 2009 dataset. . 93
6.9 Variations in swimming direction for each day in 2010 dataset. . 94
6.10 Visualisation of differences in direction between non-schooling be-haviour on 28 April (i) and schooling bebe-haviour on 28 May (ii). Red fish represent feeding periods, blue fish non-feeding periods. 96 6.11 Standard deviations of daily direction samples for 2009 dataset. . 97
6.12 Mean of daily standard deviations of direction samples with SE for non-schooling and schooling behaviour. . . 98
6.13 Daily means of speed for 2009 dataset. . . 99
6.14 Averages of daily mean of speed with SE for non-schooling and schooling behaviour. Means are statistically significantly different from each other. . . 100
6.15 Direction (blue) and standard deviation (red) of direction in re-lation to tides (black line). . . 101
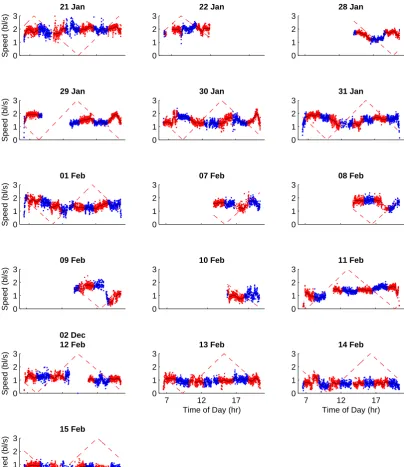
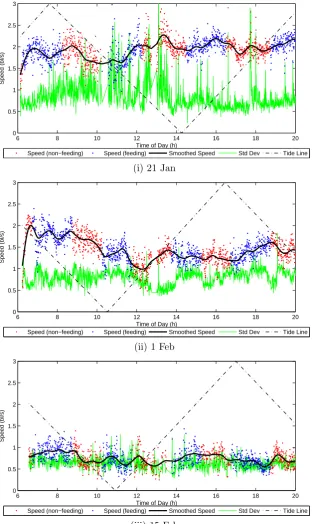
6.16 Swimming speed in relation to tides (red broken line). Red points represent fish during feeding times. Blue points represent fish during non-feeding times. . . 104
6.17 Average Speed per Tide Value for 2009 dataset. . . 106
6.18 Average Speed vs Time of Day for 2009 data set. There is a visible ramp up in speed in the morning and slow down in the evening. . . 106
6.19 Speed vs Feeding/Non-feeding for 2009 dataset. . . 107
6.20 Water current direction (blue) as measurement by the meter and tide value (red) as reported for Sidmouth, Tasmania. The current direction is more variable on the incoming tide than outgoing. Upstream direction is at around 135◦. . . 109
6.21 Water current flow magnitude (blue) as measurement by the me-ter and tide value (red) as reported for Sidmouth, Tasmania. The current flow is more variable on outgoing tide and on days around 4 March, the incoming tide shows minimal current flow. . . 110
6.22 Average flow per hour measured by the current meter. . . 111
6.23 Average flow per tide value . . . 112
6.25 Swimming speed and current flow. . . 115
6.26 Swimming direction and current direction. . . 116
6.27 Swimming direction and current flow. . . 117
7.1 Tracking results for Sequence 1 comparing GNN and MDA. . . . 136
7.2 Probability of detecting zero, one or two targets during Sequence 1.137
7.3 Certainty about the accuracy of position estimates is expressed by calculating the estimation variance. . . 138
7.4 Error distance between the ground truth and the tracking system. 139
7.5 Avoidance Manoeuvre in Sequence 1 (Timestep 1-20). . . 140
7.6 Fish Passing By Manoeuvre in Sequence 1 (Timestep 25-45). . . 142
7.7 Complex manoeuvres in Sequence 1 (Timestep 50-100). . . 143
7.8 Tracking results for Sequence 2. Strength of the colour determines the temporal order. Lighter points are at the beginning of the sequence, darker points are at the end of the sequence. . . 144
7.9 Complex manoeuvres in Sequence 2. . . 146
7.10 Swimming past a stationary fish first time in Sequence 2. . . 147
7.11 Swimming past a stationary fish second time in Sequence 2. . . . 148
8.1 Classic actogram of demand feeder activations. . . 154
8.2 Coloured actogram of demand feeder activations. . . 155
8.3 Actogram of swimming speed. . . 157
8.4 Heat maps of activity on 24 Feb 2010 starting from 0700h (each colour image represents 30 min. of activity). Images (iii), (iv) show activity when food from the demand feeder was available. The feeding area is located roughly at the bottom of each image. 159
8.5 Mean swimming speed of 10 fish in a research tank on 24 Feb 2010.160
8.6 Median distance from the feeding area of 10 fish in a research tank on 24 Feb 2010. . . 160
C.1 Average swimming speed from 10 fish in a research tank during 35 days (27 Jan - 2 March 2010). . . 183
CHAPTER 1
INTRODUCTION
This thesis describes research on computer vision systems to automatically analyse fish behaviours in aquaculture sea cages and tanks.
1.1
Research Background
Finfish aquaculture research attempts to understand relationships between fish and their surroundings (Oppedal et al., 2011). This knowledge can be used to evaluate and improve aquaculture management practices and fish welfare. From the commercial point of view, an aquaculture business aims to maximise revenues and minimise operating costs in order to maximise profits, while maintaining en-vironmental sustainability. This is achieved by maintaining healthy stock which grows optimally, while reducing the wastage of feed. Different fish species require different conditions to grow optimally; locality of the site, water flow, tempera-tures, oxygen levels, and preferred feeding patterns are some major considerations (Ashley, 2007).
Fish vary their behaviour in response to environmental changes, therefore observation of fish behaviour and movement is often a focus of experimental studies (Juell, 1995). Today’s advances in technology provide various ways of observing fish behaviour, but possibly the most accessible and cheapest is video technology, due to its widespread commercial and private use, and very large volume of sales. Underwater video cameras are most widely used in aquaculture, because most fish activity is not visible from the surface.
results differ depending on the level of operator training and experience. Contin-uous observation of fish is also impractical in aquaculture research but desirable because sampling of observations may affect outcomes of experiments.
1.2
Justification for Research
The finfish aquaculture sector is growing worldwide and farm operators are always interested in technologies which can improve farm operations and maintain a high level of quality of fish and environment. In some countries there is already a requirement to monitor the environment around fish farms through legislation and more countries will soon follow (Oppedal et al., 2011). Practical, on farm monitoring of fish welfare through Operational Welfare Indices is the current focus of fish welfare researchers (First International Workshop on Fish Welfare, Madrid - http://www.fishwelfare.com) and one of the economical ways of doing that is through observation of fish behaviour using video technology. However the observation of fish behaviour is currently a manual process and not cost-effective for commercial purposes.
In aquaculture research, sampling is used when observing fish over long time periods, as it is not practical to undertake continuous observation. For exam-ple, Kadri et al. (1991) when investigating daily feeding rhythms, sampled video observations every two hours and observed swimming speeds every hour for 10 days. Observing feeding behaviours usually involves recording only the actual feeding events (Petrell and Ang, 2001).
1.3
Research Aims
The main aim of this project is to investigate the automation of the analysis of fish behaviour in sea cages and tanks by using video technology. This is achieved by the development of computer vision software and subsequent validation ex-periments.
The computing aspect of the thesis involves researching existing computer vision techniques, modifying, combining and applying them to suit the unique marine environment where quality of footage is often poor due to various fac-tors outside of experimental control. In sea cages where short term tracking is investigated, visibility is often poor due to restricted light and turbidity and the camera is exposed to constant movement. In tanks, where the aim is to uniquely track small number of fish for prolonged periods of time and also track a small group of fish for prolonged periods of time without identifying individuals, the presence of light reflections and water movement affects the ability to track fish effectively.
The aquaculture aim of the thesis is to demonstrate that computer vision systems developed for sea cages and tanks can effectively monitor fish movement and behaviour. In sea cages, the goal is to analyse dataset generated by the system and combine it with environmental and farm management data. The analysis identifies any patterns of behaviours in relation to time of day, feeding, tides, temperature and visibility. In tanks, the aim is to identify individual fish uniquely and track them for prolonged periods of time. This allows identification of agonistic behaviours between fish, which would inform about social hierarchies. The secondary goal is to observe a group of fish during a self-feeding experiment to observe fish behaviours in relation to the feeder.
1.4
Key Assumptions and Limitations
1.5
Animal Ethics Approval
The experimentation reported in this thesis was conducted with the approval of the University of Tasmania Animal Ethics Committee, approval numbers A0007720 and A0009439.
1.6
Outline of the Thesis
The research project is a combination of computer science and aquaculture re-search. While separating the manuscript in two parts, one for each discipline, would at first seem intuitive, it would create an divide between the two areas that would be difficult to follow. The goal of the thesis structure is to bridge the gap between the disciplines and focus on two areas in the analysis of fish behaviour: analysis in sea cages and analysis in tanks. While work conducted in sea cages is concerned with large numbers of fish in a commercial setting, the work carried out in tanks is concerned with individual fish or small numbers of fish.
The thesis is structured as follows. The first three chapters of the body of the thesis (Chapters 2, 3, 4) provide a literature review for both disciplines. Chapter 2 introduces the aquaculture research on fish behaviours and research methods used to analyse fish movements and behaviours. This chapter also outlines the current use of computer vision and other technologies in aquaculture research and their relevance to the thesis.
The process of separating foreground objects from background is called seg-mentation. Chapter 3 reviews how objects can be extracted from video sequences and several methods of segmentation are presented, some of which use individ-ual image frames, and others that use the motion within the video sequence to extract shapes. Chapter 4 describes how extracted objects can be tracked within a video sequence. The chapter reviews tracking algorithms such as the Kalman filter and the Particle filter and also covers multi-target tracking where multiple measurements need to be assigned to multiple targets at each time step. These two chapters provide the necessary background for the computer vision algorithms described in later experimental chapters.
from the tracking system, how they are manipulated, the accuracy of the system and how data is presented. Chapter 6 focuses on the output generated by the tracking system in the aquaculture context. Four experiments are presented to validate the system by discussing the observed patterns of behaviour.
The second part of the experimental chapters focuses on fish movement in research tanks, with Chapter 7 examining tracking of individual fish in tanks, while Chapter 8 examines tracking of a small group of fish in a tank. Chapter 7 presents a unique tracking system designed to track individuals in a small tank and results from analysing two video sequences are shown to demonstrate the capability of the system and problems encountered. Experiments in Chapter 8 track groups of fish within a tank without a focus on individuals. The tracking system is a modification of the system mentioned in Chapter 5, so the focus is on validating the system in an experiment involving a group of naive fish in a tank adapting to use a demand feeder by pulling on a bead.
CHAPTER 2
THE USE OF TECHNOLOGY IN FISH
BEHAVIOUR RESEARCH
2.1
Introduction
Fish behaviour plays a crucial role in aquaculture. Farm operators need to recog-nise different behaviours and understand their significance, and encourage cer-tain behaviours, like fish schooling, that are desirable for effective fish production (Brown et al., 2006). Failure to recognise changes in behaviour, or failure to es-tablish certain behaviours, may result in poor growth, poor health and increased mortality rate - an undesirable outcome from both a fish welfare and commercial perspective.
While the definition of fish welfare is still under debate (Damsg˚ard et al., 2006; Ashley, 2007; Huntingford and Kadri, 2008), aquaculture operators and researchers agree that good welfare is important to successful commercial opera-tion, while poor welfare is not desirable. Many issues mentioned in this chapter have a great influence on the welfare of fish. Stress and welfare are related, though the exact relationship is still not well understood (Huntingford and Kadri, 2008). However it is understood that long term stress causes slow growth through loss of appetite and decreases resistance to disease (Ashley, 2007). Another problem facing farmers and researchers is how to measure welfare given different defini-tions and different perspectives. Experienced farmers can identify which farming practices, fish behaviours and environmental conditions may cause poor welfare and which conditions promote good welfare but the process is subjective and differs between individuals. Recently a focus has been on how to quantify fish welfare through the development of Operational Welfare Indices (Branson, 2008). Researchers are now acknowledging that continuous monitoring of fish welfare is desirable and are looking for methods which can help quantify fish welfare.
Section 2.2 describes research on fish behaviours in sea cages while Section 2.3 describes research on fish behaviours in small tanks, where the focus is on indi-viduals and small group interactions. Section 2.4 further narrows the topic to the use of computer vision in aquaculture and marine science. As video technology is not the only technology used in aquaculture, Section 2.5 provides background on acoustic and radio telemetry and acoustic based detection.
2.2
Behaviours in Sea Cages
Research on fish behaviours in sea cages has focused mainly on the impact of farm operation on fish behaviour, and an understanding of how these behaviours impact on fish welfare. Management practices such as feeding, cage maintenance and protection from predators have an impact on, or are influenced by, fish behaviour. Feeding behaviours form an important part of aquaculture research because they directly impact the efficiency of aquaculture businesses, where the main objective is to optimise fish growth and minimise food wastage. Feeding behaviours may be observed as activity at the water surface, though observations using underwater video cameras give a better indication of feeding activity (Ang and Petrell, 1997). Underwater cameras can also be used to detect uneaten pellets as they sink towards the bottom of the cage. Operators use this information to cease feeding and minimise wastage. To further increase efficiency, automated feeding systems have been developed and waste feed minimisation technologies also developed (Blyth et al., 1993).
and decreases the swimming speed, and therefore decreases the variation in size and improves growth (Andrew et al., 2002). On-demand feeding also results in different search strategies being applied by fish with resultant lower swimming speeds (Andrew et al., 2002). Thus, swimming speed can be used as a descriptor of fish behaviour.
Another aspect of sea cage aquaculture is the impact of the environment on the welfare of fish and on their ability to feed and grow optimally. Fish react to their surroundings in a behavioural way, therefore the observation of fish behaviour becomes important to understanding the relationship between fish farming and the environment. In salmonid aquaculture, the main influencing environmental variables are dissolved oxygen (DO) levels, temperature, water current speed and direction, salinity, turbidity and algal concentration. These variables may be manually or automatically sampled on a regular basis, providing good historical data, or may be observed on an ad-hoc basis. Dissolved oxygen levels are inversely related to temperature and salinity, and are critical to the survival of fish. Higher temperatures cause lower DO levels and often aeration is required to maintain sufficient oxygen supply, especially during periods of low water flow or exchange. Care also needs to be taken when feeding fish in higher temperatures, as the post-prandial oxygen requirement increases substantially (Purser and Forteath, 2003).
While video technology provides a suitable method of observing fish behaviour directly, currently it requires manual analysis, making it time consuming and costly. Researchers can use other tools to indirectly observe fish behaviours in relation to environmental changes. For example, the analysis of feed intake us-ing adaptive feeder technology (AQ1 Systems, Tasmania, Australia) has allowed researchers to examine the relationship between feeding habits and day-length, seasons, and water temperature. Daily ration was used as an indirect repre-sentation of feeding activity and it was analysed against the above mentioned variables. Analysis showed that feeding rhythms change with seasons and are influenced by temperature changes and the length of day (Noble et al., 2007). Another element important in cage-rearing is light intensity, which can include the use of artificial lights to delay the maturation process. Swimming at depths displaying a high intensity of light forces fish to compromise between increased risk of predators and hunger (Juell and Fosseidengen, 2004). Investigating these relationships can be difficult, as it requires continuous observation of fish, which is only feasible if an automated system exists to analyse such behaviours.
nets), it is possible for fish to be stressed due to the presence of predators at-tempting to breach cage defences (Br¨ann¨as et al., 2001). Prolonged exposure to predators may cause chronic stress and this will inhibit growth and affect fish wel-fare (Purser and Forteath, 2003). Researchers are investigating the link between predation risk, feeding and environmental conditions, and farmers employ mea-sures to minimise exposure to predators, to avoid or minimise long term stress (Ashley, 2007). The understanding of farmed fish anti-predator behaviours often comes from observing natural behaviours of wild fish. However it has been ob-served that anti-predator responses of wild origin brown trout differed from those of sea-ranched origin trout (Petersson and J¨arvi, 2006). Two possible explana-tions were offered. The first was a non-genetic maternal influence, the second plausible explanation was a genetic difference which might occur within a single-year class despite both wild and sea-ranched fish coming from a very similar genetic pool.
An important aspect of aquaculture research focuses on fish welfare. The re-search community has been trying to reach a consensus on what constitutes fish welfare (Damsg˚ard et al., 2006), with the focus shifted towards the measurement of fish welfare in a practical manner on commercial farms. This led to the devel-opment of Operational Welfare Indices (OWIs), a set of indicators which can be measured on farms to provide farmers with real-time and historical feedback of fish welfare (Oppedal et al., 2011). Rather than trying to measure all variables which may contribute to the evaluation of fish welfare, the challenge is to pick a limited number of indices which can provide an effective evaluation of welfare at an affordable cost to farmers. Fish movement could be one of these indicators. Oppedal et al. (2011) used echo sounders to evaluate the vertical distribution of fish in sea cages and suggested that an OWI could be based on these vertical behaviours, where the fish welfare index would relate to the deviation from ex-pected behaviour. Another method of observing fish movement could be using video technology, but until now there has been no automated way to observe fish behaviour using video. While the above mentioned indicators relate to groups of fish in sea cages, it is also important to understand fish welfare for individuals (Juell, 1995). This leads to the use of RF, acoustic and video technologies on a smaller scale where individuals are observed.
2.3
Behaviours in Small Research Tanks
Tanks offer a smaller scale and controlled environment, providing an ideal set-ting in which to conduct behavioural research on fish. The smaller scale lets researchers examine how individuals and small groups respond to experimental stimuli. It is also easier to achieve replication in space for experimental purposes.
Feeding behaviours have been investigated in tanks in order to understand which methods of feed delivery yield optimal fish growth. Observations of rainbow trout (Oncorhynchus mykiss) interactions have shown that when using demand feeders, only a few individuals are responsible for activating the feeder (Br¨ann¨as and Alan¨ar¨a, 1993), which leads to uneven feed intake and consequently uneven growth (G´elineau et al., 1998). A high reward level might mitigate this, allowing feeding by fish from low-weight classes. In a hand fed scenario, trout had better access to feed, with better growth and better size distribution (G´elineau et al., 1998). However when feeding, the rate of delivery has to be considered, because low rations may cause increased competition and low growth, while high rations when fish are fed to satiation lead to decreased competition and better growth but increased waste (Andrew et al., 2004).
Fish also establish social hierarchies, with dominant fish having better access to feed, often forcing subordinate fish to forage at times of increased predation risk, trading off safety for hunger (Alan¨ar¨a et al., 2001). Comparison between wild origin and sea-ranched origin brown trout fry revealed that the number of agonistic behaviours was higher in wild origin fish (Hedenskog et al., 2002). One explanation offered by Hedenskog et al. (2002) was that the selection of fish for rapid growth may indirectly select for passiveness. Another was that wild fish may be more aggressive due to competition for food or space.
Another topic that is suitable for small scale tank research is fish adaptability and ability to learn. For example Atlantic salmon can adapt to stimuli of light flashes during feeding within 6 days (Bratland et al., 2010). On a commercial farm, this knowledge can be used to condition salmon to various farm manage-ment practices. Another application of light stimuli is for exercise purposes. Herbert et al. (2011) exposed Atlantic salmon to moving lights in the centre of the tank at a speed of 1.5 Body Lengths/s. Fish increased the swimming speed from the original 0.6 BL/s to≥1.8 BL/s after 28 days. Swimming at such speeds for sustained periods of time improved the growth, and the quality (slender body shape), and lowered stress (lower cortisol levels).
of fish is one of the variables which can affect fish welfare (Ashley, 2007). For adult Atlantic halibut (Hippoglossus hippoglossus L.) a high density may induce unusual surface activity, lower feed intake and inhibit growth (Kristiansen et al., 2004). Movements of rainbow trout in a high density system caused fish to alter direction often, and a higher incidence of fin damage was also observed (B´egout Anras and Lagard`ere, 2004). Crowding also forced fish to swim within the inner part of the tank, while fish in a less crowded tank had an ability to swim in the outer areas of the tank where the feeder and water inlet were located. Crowded fish also lost their day-night activity rhythm, something that was visible in less crowded fish (B´egout Anras and Lagard`ere, 2004).
2.4
Computer Vision in Aquaculture/Marine Science
Video technology is widely used both in commercial aquaculture and in aqua-culture research (Kadri et al., 1996; Ang and Petrell, 1997). The technology is appealing because its cost is continually decreasing due to commercial demand (high volume) and quality is increasing due to advances in manufacturing. Farm operators mainly use cameras during feeding events to observe fish movement and pellet wastage. Observations at other times are carried out on an ad-hoc basis only. With advances in computer technology, the ability to use computers to analyse images and video sequences has improved. Current technology allows real-time video processing for long periods of time. Aquaculture researchers have realised this potential and began developing systems which would make farm management and research easier (Israeli and Kimmel, 1996; Dunn, 2008). This section will review the field and include technologies peripheral to the framework of the thesis in order to place the behavioural work in the context of current advances and technologies.
2.4.1
Size Measurement and Stock Assessment
stereo images and provided a length measurement for detected fish. At the same time, a semi-automated system called Fish Image Capturing And Sizing System (FICASS) was developed, as real-time processing of images was not viable at the time (Petrell et al., 1997). FICASS allowed an operator to manually mark important features of a fish within a video frame (using a computer mouse) and the program would then calculate fish weight according to a mathematical relationship with the length and height of the fish specific to fish species. The key objective since then has been to replace manual marking with automated marking allowing a biomass system to gather more samples with less effort and provide more accurate estimates of fish biomass within a sea cage.
More recent work has focused on this specific aspect of detecting and extract-ing fish shapes in a reliable manner. Point Distribution Models have been used to accurately extract fish shapes (Tillett et al., 2000). The concept was based on the Active Shape Model (ASM) (Cootes et al., 1995) where a fish shape can be described as a statistical model using training images. The method was capable of statistically deforming the model to deal with variations in shape. Applied to testing images, the system was capable of wrapping the model around the candidate fish and giving its correct shape as an output. This shape was then used to calculate fish dimensions and therefore the biomass.
of light) by modifying a histogram transformation to even out the illumination and contrast in each row. Accounting for uneven illumination allows for a more accurate extraction of fish shapes and therefore better size estimation.
2.4.2
Fish Behaviour
Computer vision has been used to analyse fish behaviours and this subsection introduces current research trends and relates them to the research carried out in this thesis. Early work on behavioural research using computer vision was undertaken by Kato et al. (1996) and Israeli and Kimmel (1996). Kato et al. (1996) developed an image processing system to track a single goldfish in three dimensions using two orthogonal cameras. This was an advance on previous rodent tracking systems, which worked in two dimensions. However data storage capacities were low compared with those of today, so tracking was carried out for only 60 minutes. Israeli and Kimmel (1996) investigated how goldfish in a tank dealt with hypoxia, by detecting the school of fish within each video frame from two perpendicular cameras. This produced a three dimensional distribution of the school and allowed researchers to observe variations in the school size. In addition, frame differencing was used to create a motion image called a Projected Mobility Picture (PMP) to describe the changing location of the fish. The system detected fish movement to the surface when subjected to the effect of hypoxia. PMP was further improved in another study to produce a numerical indication of Tilapia activity - speed normalised in terms of body lengths per unit of time (Xu et al., 2006). The authors used a glass aquarium in which to conduct the experiment and contented with shadows, uneven illumination and turbidity. As fish quickly adapt their colour to surroundings, a blue background was used for better contrast out of white, blue and green colours investigated. This experiment showed that with careful consideration of experimental set-up (suitable light and background), computer vision techniques can provide useful research data with a small number of fish. However as the number of fish increased, problems of occlusion occurred and these needed to be addressed to differentiate individual fish.
How-ever Miller and Gerlai (2007) used a semi-automated approach where the fish were marked manually on each image frame and a computer vision system then calculated statistics of the shoal behaviour. This compromise allowed generation of an accurate set of measurements and increased speed of calculations.
Automated behavioural analysis of large numbers of fish has described verti-cal distribution of fish in tanks (Stien et al., 2007). Thick markers were painted on the side of the wall, and software was used to detect the level of coverage of these markers by the fish. The result of the analysis was an activity graph showing the percentage of the marker coverage. As a case study Stien et al. (2007) observed the process of fish being exposed to flashing lights, with the aim of determining the length of time for fish to associate lights with feeding. In a study by Duarte et al. (2009) the activity of flatfish was described using frame differencing. While the density of fish was high and tracking of individuals was not possible, the frame difference between two consecutive frames did provide an activity index. The index was a ratio between the total number of pixels and the number of pixels deemed to represent motion. There was a high correla-tion between the activity determined by the automated method and the manual method (operator measurement). Though the automated method was not able to distinguish different types of activities, it could be used as an alarm to detect unusual behaviours.
2.5
Other Technologies
While the use of video technology has been widespread due to its relatively low cost, other technologies which complement or often outperform video technology are used in aquaculture. This section will review some of the aquaculture research carried out using these technologies outlining their advantages but also discussing their limitations. The studies in this section will be outlined individually, in turn, to highlight applications.
2.5.1
Acoustics and Acoustic Telemetry
ultrasonic tags on rainbow trout to monitor fish swimming behaviour at differ-ent densities. They tracked nine fish in three tanks of 116, 333 and 583 fish, three tagged fish per tank. The tracking system sampled every 5 seconds with an accuracy to < 10cm producing data on distance travelled, turning angles, swimming trajectories, space utilisation and activity patterns. In other work La-gard`ere et al. (2004) recorded the feeding sounds of brown trout, rainbow trout and turbot using hydrophones. The aim of the experiment was to identify sounds characteristic of feeding, specifically suction feeding, which is commonly associ-ated with teleost fish. While the research identified some unique sounds relassoci-ated to feeding, the authors observed noise generated by aquaculture systems (water flows, pumps, etc.) and meteorological noise.
Fitting between the above mentioned areas of studies was a non-invasive way of tracking fish in tanks using acoustics (Conti et al., 2006). The problem however was scattering of acoustic signals within a tank. Conti et al. (2006) developed a set of equations that would allow a system to differentiate between a true signal and its echo. They suggested this technique may be suitable to track the activity of fish in tanks and fish growth, and be used as an alarm if unusual events are detected.
Sea cage aquaculture usually involves larger fish to which acoustic tags could be attached. Cubitt et al. (2003) used acoustic tags to track the movement of 39 chinook salmon within 3 cages (with an average of 6000 fish in each) - 13 fish per cage. Using 8 hydrophones in total, they were able to provide three-dimensional data of fish movement. Their results showed differences in fish movement between day and night, and also change in activity during feeding. The influences of var-ious sources of noise (eg. boats, feeders, generators and natural noise within the environment) were identified, as noise affected the possible frequency of sampling as well as the accuracy. In addition the positioning of hydrophones, which had an effect on the triangulation, influenced the signal, with a recommendation that arranging hydrophones in a cube gives better accuracy than a rectangular box arrangement.
tag used, minimising the effect on physical attributes of fish. The tag operated at a different frequency to that which is traditionally used, which resulted in a smaller detection range (not a problem due to the size of the cage) but the accuracy of the system allowed fine movements of tracked fish, like turns and accelerations to be recorded - something not achievable with traditional systems where tags are larger, and also made the system applicable to juvenile fish.
While tagging systems can provide accurate three dimensional data, there are draw-backs especially when considering widespread commercial use. These systems are expensive and they are difficult to set-up (especially compared with video systems) because they require careful positioning in three dimensions and calibration. The implantation of tags is an invasive procedure and while the above mentioned research has not found evidence that the procedure was detrimental to the fish, it is possible that in larger scale commercial settings stress levels could increase. This would mean that tagged fish would behave differently from non-tagged fish, e.g. non-tagged fish which are stressed may not feed as much or occupy the same area of the cage as non-tagged fish. In a commercial system this has obvious problems as a management tool because the fish being used as a representative sample of the population, are not actually representing the behaviour of the majority of the fish in the whole system. Also tags have a limited life span and would require continuous maintenance and costly replacement. While the cost of the technology will decrease over time, currently such systems are restricted to research-oriented deployments.
anal-ysis of acoustic video sequences with only minor modifications. DIDSON could provide a powerful all weather monitoring system capable of tracking fish move-ments in sea cages. While the effectiveness of DIDSON has been praised in the reports, personal communications with researchers revealed that DIDSON is not capable of penetrating through the school of fish and so it may be of limited use. Additionally the cost of the device (which was AU$120,000 in March 2010) means that substantial funding would be required to purchase a unit for research purposes and it is likely not to be feasible for commercial aquaculture use on a per cage basis.
2.5.2
Radio Telemetry
The use of radio and acoustic telemetry has been reviewed by Baras and La-gard`ere (1995). The review covered active tags which use batteries to power circuitry sending out periodic signals. Tagging involves handling fish (Baras and Lagard`ere, 1995) and can have an effect on fish physiology and behaviour of fish (Bridger and Booth, 2003). While radio tags can perform reasonably well in freshwater, salt water operation is limited due to the conductivity of salt water (Koehn, 1999), hence acoustic tags are preferred in salt water (Section 2.5.1). Also the cost of equipment (tags and readers) is somewhat more expensive than video because the price of radio tagging systems is dependent on demand. Higher volumes of production usually mean lower costs. While this is achievable in video technology where consumer demand is high, radio tagging systems are not di-rectly sought by the general public. However the advent of Radio Frequency Identification (RFID) technology is bringing radio telemetry to the mainstream population through supermarkets and other sectors wanting to tag their products for the purpose of identifying and streamlining supply systems. This will increase the demand for radio telemetry and drive the cost down, potentially making it more attractive to researchers and farmers.
Advances in RFID development have produced tags which have no battery of their own but are activated by an energy signal sent from the scanner. This technology is called Passive Integrated Transponders (PIT). Because there is no need for a battery, tags are very small and can be easily inserted into the fish. Also, the effects on fish physiology and behaviour are negligible (Prentice et al., 1990). However the main downside of the tags is the limited detection range (< 30cm), requiring experiments to have strategic points such as near demand feeders (Cov`es et al., 2006) and water inlets, where antennae will be located such that the system will determine the presence of fish close to the point of interest.
their presence. A narrow channel ensures fish passing through will be registered by the readers. Using this setup, Alan¨ar¨a et al. (2001) examined the passage of Brown Trout between foraging and refuge areas and determined the influence of social rank and temperature on foraging fish behaviours. They noted patterns in foraging behaviours with dominant fish feeding mainly during the night, while subordinate fish either fed in the later part of the night at lower temperatures or during the day at higher temperature, thereby compromising between the risk of predators and the need to feed. A PIT system was used to observe habitat selec-tion by juvenile burbot between four different quadrants with different habitats (Fischer et al., 2001). The use of passageways between habitats allowed fish to swim to a different habitat through an electronic gate, which was used to decide if the transition actually occurred or if fish withdrew to a previous habitat. A study of bottom dwelling Atlantic halibut used PIT tags to examine the surface activity (Kristiansen et al., 2004). The PIT antenna was placed just under the surface of the water and it was used to detect fish swimming on the surface. They found a negative correlation between surface activity and growth rate and suggested that surface activity might be an indication of poor welfare.
PIT systems have also been used to tag a subset of fish in a larger experimental system. Dempster et al. (2008) tagged 400 fish out of a population of 2000 to ensure that these 400 fish could be identified during later stages of the experiment. During transfers, tagged fish were identified and dealt with according to the experiment design. There was no attempt to track or detect fish in water, tags were simply used to identify tagged fish from non-tagged fish. This is the most common application of PIT systems in aquaculture research (Dempster et al., 2008).
2.6
Summary
CHAPTER 3
IMAGE AND VIDEO
SEGMENTATION
3.1
Introduction
The previous chapter introduced the use of computer vision in aquaculture in Section 2.4. This chapter’s aim is to introduce the computer vision techniques used in extraction of foreground objects from complex backgrounds.
Advances in computing over the last two decades and decreasing hardware costs have had a significant impact on image and video processing especially in real-time situations. The main objective of image and video segmentation in the context of the thesis is to extract regions of interest (foreground objects) from video sequences, while ignoring background areas (remaining areas of an image not relevant to the application). Research in image and video segmentation has been driven by several major applications and these are discussed in Section 3.1.1. Section 3.2 introduces the concepts behind segmentation of single images while Section 3.3 discusses segmentation of sequences of images and how the temporal dimension is utilised to improve segmentation outcomes. A stabilisation of camera to enhance segmentation outcomes is covered briefly in Section 3.4. A summary in Section 3.5 provides an explanation of how motion segmentation can link with tracking methods, which are described in the next chapter.
3.1.1
Computer Vision Applications
back-grounds may be static (a motorway for example), more often backback-grounds will vary with time (especially outdoors). Movement of trees, rain and fog, as well as movement of the camera (intentional or unintentional) all cause the background to be of a dynamic nature. In addition some objects may not be relevant to the application and will need to be treated as background. Even static backgrounds will change their appearance over time due to illumination changes, caused by sunlight and cloud cover. The number of objects to be detected can be high (e.g. heavy traffic) and often these objects are close together (e.g. people in a crowd). This poses a challenge in detecting and separating individual objects, as occlusions will be unavoidable. In addition, objects of interest will cast shadows and this further complicates the computer vision task. Rosin and Ellis (1995) proposed a shadow detection method based on a region growing algorithm. Xu et al. (2004) used colour-based information combined with texture information to reconstruct foreground shapes without shadows included.
3.2
Image Segmentation Techniques
3.2.1
Image Pre-processing
Images are often captured in less than ideal conditions. Before they can be anal-ysed they require some form of “cleaning” to reduce the effects of noise, blur or uneven illumination. This is known as image pre-processing or image en-hancement. Simple contrast adjustment is the linear scaling of an image between specified lower and upper limits. This may allow the brightness of darker areas of the image to be increased and decrease the intensity in bright areas. More complex contrast adjustment can also be carried out, such as using histogram equalisation which works by evaluating the histogram of the original image and transforming it into a histogram with uniform intensity levels (Gonzalez et al., 2004). The original image is then remapped using the new histogram to create a contrast enhanced image. A further improvement of this method, called Adap-tive Histogram Equalisation (AHE), uses multiple histograms for different parts of an image to provide more local contrast adjustment. However the drawback of this method is that it produces additional noise in parts of the image. To deal with this problem Contrast Limited Adaptive Histogram Equalisation (CLAHE) was proposed by (Pizer et al., 1987). More recently Jin et al. (2001) offered an alternative method called Multi-scale Adaptive Histogram Equalisation (MAHE) based on wavelets.
Many images are captured with noise which filtering can be used to remove. A spatial filter uses a mask which is centred around a pixel and extracts neigh-bouring pixels for processing. Filter operations are then carried out on this neighbourhood of pixels. A spatial filter algorithm moves through each pixel in an image and based on the mask and the filter operation, it generates a new, transformed image. Blurring is one of the most commonly used operations in im-age filtering. It allows the removal of small details from an imim-age, reducing the effect of noise on segmentation (Gonzalez and Woods, 2008). An averaging filter (or low pass filter) can be used to blur (smooth) an image by averaging pixels contained in a neighbourhood mask. A very different, commonly used type of filter, is the sharpening filter, where the aim is to highlight intensity transitions. It can be used in photograph enhancement to alleviate blur caused by a shaky camera.
and edge detection.
3.2.2
Thresholding
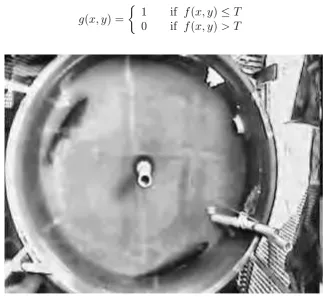
Image thresholding is a basic method for examining an image’s intensity levels and deciding on an appropriate threshold that may allow differentiation between foreground and background. The thresholding operation transforms a grey-scale imagef (Fig. 3.1) into a binary imagegwhere the value of each transformed pixel
g(x, y) is determined by the value of the original pixel f(x, y) and the threshold value. This transformation generates a black and white image g, in which pixels in areas detected as foreground will have value of 1 (white) and pixels in areas detected as background will have value of 0 (black) (Eq. 3.1).
g(x, y) =
1 if f(x, y)≤T
[image:40.595.144.468.313.611.2]0 if f(x, y)> T (3.1)
Figure 3.1: Grey-scale, unthresholded image
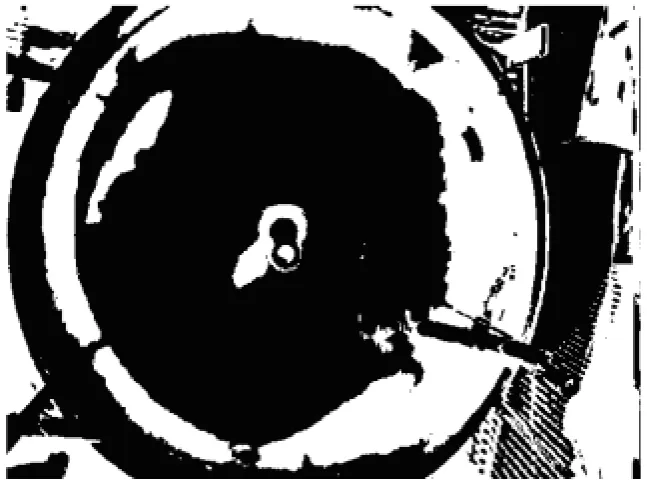
Global Thresholding
global threshold is the one proposed by Otsu (1979). It operates directly on the histogram of the grey-level image. The main assumption of this method is that the histogram is bimodal. This is a statistical method which maximises between-class variance of the histogram values (Gonzalez and Woods, 2008, p. 742). Global thresholding can be used in images where there is a clear distinc-tion between the foreground and background (the histogram is bimodal) and the image has constant illumination levels. Otherwise the threshold achieved will not separate objects of interest from the background completely. Because thresholding requires relatively low computing resources this method can be used effectively in industrial inspection applications. In this case illumination levels can be controlled and background can be adjusted so that foreground objects can be easily detected by thresholding. Global thresholding may also be enhanced by prior smoothing of an image to eliminate noise.
Figure 3.2: Global thresholding of Figure 3.1
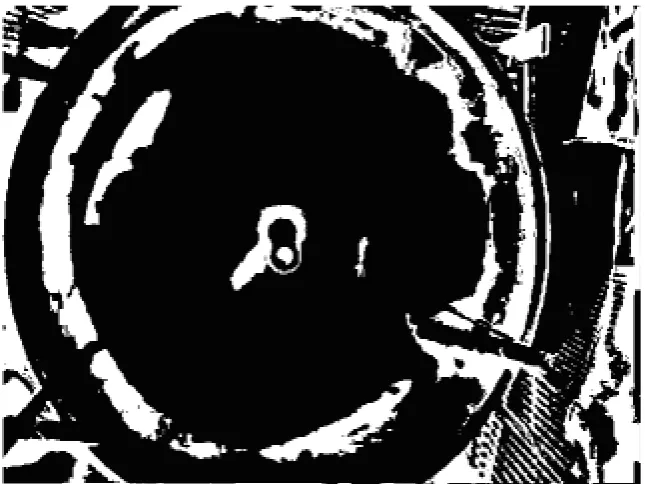
Adaptive Thresholding
Local thresholding is an adaptive thresholding method and can deal better with varying illumination levels (Fig. 3.3). It works by finding the mean and maximum of the neighbourhood surrounding each pixel and calculating the local threshold according to the following equation (Davies, 2005):
The key choice here is to select a neighbourhood size that will cover enough fore-ground and backfore-ground pixels. This neighbourhood size is problem dependent and often it will be a compromise between accuracy (satisfactory segmentation) and performance (speed of execution). This type of thresholding is useful when illumination across the image is non-uniform. An example can be optical charac-ter recognition (OCR), where an image of a page of text has varying illumination levels due to the position of the light source and the objective is to extract the bi-nary image including all the text. The light source produces a white background that is brighter closer to the light source and darker further away from the source blending in with the dark text. While global thresholding would produce poor results in this case, segmenting bright background from dark background with-out effectively segmenting the text, adaptive thresholding will be applied locally and it will produce a better result by successfully extracting text from regions of different background intensity.
Figure 3.3: Adaptive thresholding of Figure 3.1
3.2.3
Edge Detection
second-order derivatives which for two-dimensional images provide a gradient of change. Two popular algorithms for edge detection are the gradient detection algorithm and Canny edge detector. A gradient detection algorithm based on the Sobel operator uses a simple 3x3 mask to calculate a gradient based on the first-order derivative. This has some noise suppression capabilities that make it slightly preferable to older operators (Roberts and Prewitt operators). The Canny edge detector is a more sophisticated method which applies a Gaussian mask to calculate the gradient and also uses corrective measures to thin edges and decrease the error rate of detection (Fig. 3.4). Gonzalez and Woods (2008) give a fuller description of gradient and Canny algorithms and references to original papers. They also describe other gradient operators like Roberts, Prewitt and the Marr-Hildreth edge detector. It is important to note that although the Canny edge detector is a superior algorithm, it is also more computationally intensive. Therefore simpler methods (such as using the Sobel operator) may be preferred for real-time image processing.
Figure 3.4: Edge detection of Figure 3.1
3.3
Motion segmentation
do not become part of the background. The assumption of moving objects and a static background may still be used during the initialisation stage when the initial background is being established. The background may then be modified over time to include changes in illumination e.g. associated with movement of the sun or changes in cloud cover. The following two subsections (3.3.1 and 3.3.2) describe two methods of extracting foreground objects from a sequence of images. Subsection 3.3.3 describes methods which combine various other methods to provide a hybrid solution for motion segmentation.
3.3.1
Temporal differencing
The most basic way of detecting motion in a sequence of images is by taking an absolute difference between a frame at time k and a frame at time k−1. The difference image shows which areas have changed between frames. However this method does not detect the entire object, leaving undesirable holes. In addition the difference image may contain noise from background motion or sensor errors. To reduce the effects of this noise three-frame differencing can be applied rather than just comparing two frames. Let Ik(x, y) be a pixel intensity at time k. The pixel at (x, y) is determined to be moving if
|Ik(x, y)−Ik−1(x, y)|> Tk(x, y) and|Ik(x, y)−Ik−2(x, y)|> Tk(x, y) (3.2)
whereTk(x, y) is a threshold, which may be constant or evolve over time (Collins
et al., 2000). As mentioned above, the inability to extract the entire object, means that frame differencing needs to be augmented by another method so that the whole object can be extracted. In this case frame differencing acts as a marker which provides some boundary co-ordinates of foreground objects.
3.3.2
Background subtraction
will be updated and should depend on the dynamics of the scene.
Bk+1(x, y) =αBk(x, y) + (1−α)Ik(x, y) (3.3)
The current frame, Ik, can then be subtracted from the background, Bk, and the
absolute difference is thresholded to produce foreground objects.
|Ik(x, y)−Bk(x, y)|> Tk(x, y) (3.4)
This method works well when objects are always moving through the scene. However problems arise when objects become stationary as they will eventually become part of the background. Alternatively objects which were stationary at the beginning of the sequence, may start to move which leaves holes in the background which are later detected as foreground objects. Therefore a more sophisticated way of maintaining the background is required.
3.3.3
Hybrid methods
Hybrid methods combine several different motion detection methods to provide background management and extraction of foreground objects. This subsection describes the two methods which have influenced the work undertaken in this thesis but it also briefly mentions other work for completeness.
The Video Surveillance and Monitoring (VSAM) Project
The report written by Collins et al. (2000), as part of the VSAM project, provides a comprehensive motion segmentation strategy that was applied to surveillance of people and cars in parking areas. This system combines background subtraction with three frame differencing to provide an effective way of detecting moving objects. Equation 3.3 is modified to update a background pixel only if the pixel has been deemed as non-moving. This update takes into account the existence of both background pixels and foreground pixels. If a pixel is deemed as moving, i.e. as part of the thresholded frame differencing result, then the previous background pixel is used without any changes (Eq 3.5). This scheme allows the background to evolve over time and maintain accurate detection rates.
Bk+1(x) =
αBk(x) + (1−α)Ik(x) xis a non-moving pixel
Bk(x) xis a moving pixel
(3.5)
Collins et al. (2000) also mention an adaptive way of calculating a threshold
Tk+1(x) for each pixel x. Furthermore they provide a layered detection scheme
Fast Video Segmentation
The second system of interest was proposed by Chien et al. (2004). This back-ground management scheme was intended for use in hardware based, real-time, content-based MPEG-4 encoding. The aim of the algorithm is to create the Ini-tial Object Mask (IOM), which represents all foreground objects detected in the image frame. Because objects can be stationary, it is important that the algo-rithm deals with objects that have stopped, and objects which began to move during the sequence. Initially the algorithm relies on a frame difference (F D) between two frames to detect areas of the image frame which are in motion. This frame difference image is then thresholded to create a Frame Difference Mask (F DM).
F Dk(x, y) = |Ik(x, y)−Ik−1(x, y)| (3.6)
F DMk(x, y) =
1 if F D≥T h
0 if F D < T h (3.7)
where Ik(x, y) and Ik−1(x, y) is the intensity of a pixel at time k and k −1
re-spectively, F D is a binary frame difference image, and F DM is a binary frame difference mask. Chien et al. (2004) also offer a scheme for determining an adap-tive threshold T hautomatically. The information from frame differencing is then used to produce a Stationary Index (SI) and this in turn is used to produce the background (BG). SI represents how infrequently the pixels change. Higher values of SI mean that pixels in a range have remained static and are therefore part of the background. Background pixels are updated with frame pixels when
SI values reach a certain threshold, otherwise “old” background pixels are used. The initial background is usually the first frame in the image or a black image (all pixels with value 0).
SIk(x, y) =
SIk−1(x, y) + 1 if F DMk(x, y) = 0 0 if F DMk(x, y) = 1
(3.8)
BGk(x, y) =
Ik(x, y) if SIk(x, y) =F th BGk−1(x, y) otherwise
(3.9)
Once the background image is created, a background difference (BD) is cal-culated in conjunction with the current image frame. BD is then thresholded to generate the background difference mask (BDM). This mask represents fore-ground objects which have been successfully detected as a result of backfore-ground subtraction.
BDk(x, y) = |Ik(x, y)−BGk(x, y)| (3.10)
BDMk(x, y) =
1 if BD≥T h
0 if BD < T h (3.11)
To establish the Initial Object Mask (IOM), first a background indicator (BI) needs to be calculated, which indicates areas where background has been successfully established. For those areas which do not have a reliable background, frame difference mask (F DM) provides information about foreground objects.
BIk(x, y) =
1 if SIk(x, y) =F th BIk−1(x, y) otherwise
(3.12)
IOMk(x, y) =
BDMk(x, y) if BIk(x, y) = 1 F DMk(x, y) otherwise
(3.13)
Finally a post-processing operation ensures that the stationary index of a pixel (SI) is reset to 0 if the pixel’s Initial Object Mask is 1. This ensures that if a foreground object stops it does not get incorporated into the background.
SIk(x, y) = 0 if IOMk(x, y) = 1 (3.14)
This scheme deals successfully with various situations where the foreground object becomes stationary, or the background becomes uncovered as a result of an object moving. Chien et al. (2004) further enhanced this baseline system with a shadow detection scheme, an adaptive threshold and a global motion compensation to deal with camera movement.