8-1963
Influence of rate of loading on the tensile properties
of normal alpha uranium
Philip Arthur Loretan Iowa State University Glenn Murphy Iowa State University
Follow this and additional works at:http://lib.dr.iastate.edu/ameslab_isreports Part of theMetallurgy Commons
This Report is brought to you for free and open access by the Ames Laboratory at Iowa State University Digital Repository. It has been accepted for inclusion in Ames Laboratory Technical Reports by an authorized administrator of Iowa State University Digital Repository. For more information, please [email protected].
Recommended Citation
Loretan, Philip Arthur and Murphy, Glenn, "Influence of rate of loading on the tensile properties of normal alpha uranium" (1963). Ames Laboratory Technical Reports. 52.
uranium
Abstract
Forty t ensile tests were carried out on normal alpha uranium in order to determine the influence of the rate of loading and temperature on its tensile properties . These tests were conducted at eleven different temperatures in the temperature range from 25 1to 600°C for three constant loading rates (0 . 0017 min -l, 0 . 0130 min- , and 0. 0400 min -1) . The properties considered were tensile strength, per cent elongation (in 1. 5 in. gage length), percentage reduction in area, yield strength, and modulus of elasticity. All of these properties were more strongly affected by a change in temperature than they were by a change in rate of loading. Graphs showing data for each of the five properties vs temperature and also as a function of rate of loading are ·displayed to indicate specific effects. Original stress-strain curves included along with graphs indicating the slopes of each of these. curves (subsequent to the initial elastic strain portion) as a function of temperature and rate of loading.
Disciplines Metallurgy
IOWA STATE UNIVERSITY
INFLUENCE OF RATE OF LOADING ON THE TENSILE PROPERTIES OF
NORMAL ALPHA URANIUM
by
Philip Arthur Loretan and Glenn Murphy
RESEARCH AND
DEVELOPMENT
REPORT
UNITED STATES ATOMIC ENERGY COMMISSION Research and Development Report
INFLUENCE OF RATE OF LOADING ON THE TENSILE PROPER TIES OF
NORMAL ALPHA URANIUM
by
Philip Arthur Loretan and Glenn Murphy
August, 1963
Ames Laboratory at
Iowa State University of Science and Technology F. H. Spedding, Director
This report is distributed according to the category Engineering and Equipment (UC-38) as listed in TID 4500, June 1, 1964.
Legal Notice
This report was prepared as an account of Government sponsored work. Neither the United States, nor the Commission, nor any person acting on behalf of the Commission:
A. Makes any warranty of representation, express or implied, with respect to the accuracy, completeness, or usefulness of the information contained in this report, or that the use of any information, apparatus, method, or process disclosed in this report may not infringe privately owned rights; or B. Assumes any liabilities with respect to the use of, or for
damages resulting from the use of any information, apparatus, method, or process disclosed in this report.
As used in the above, "person acting on behalf of the Commission" in-cludes any employee or contractor of the Commission, or employee of such contractor, to the extent that such employee or contractor of the Commission, or employee of such contractor prepares, disseminates, or provides access to, any information pursuant to his employment of contract with the Commission, or his employment with such contractor.
TABLE OF CONTENTS
Page
INTRODUCTION... 1
REVIEW OF LITERATURE.. . . . 3
OBJECTIVES OF THE INVESTIGATION... 9
MATERIAL AND APPARATUS... 10
EXPERIMENTAL PROCEDURE AND RESULTS... 16
DISCUSSION OF RESULTS... 45
SUMMARY AND CONCLUSIONS... 54
SUGGESTED TOPICS FOR FURTHER INVESTIGATION... 56
LITERATURE C I T E D . . . 57
INFLUENCE OF RATE OF LOADING ON THE TENSILE PROPER TIES OF
.,, · NORMAL ALPHA URANIUM'''
Philip A. Loretan and Glenn Murphy
ABSTRACT
Forty tensile tests were carried out on normal alpha uranium in order to determine the influence of the rate of loading and tempera-ture on its tensile properties. These tests were conducted at eleven different temperatures in the temperature range from 25 1to 600°C for three constant loading rates (0. 0017 min -l, 0. 0130 min- , and 0. 0400 min -1). The properties considered were tensile strength, per cent elongation (in 1. 5 in. gage length), percentage reduction in area, yield strength, and modulus of elasticity. All of these properties were more strongly affected by a change in temperature than they were by a change in rate of loading. Graphs showing data for each of the five properties vs temperature and also as a function of rate of loading are ·displayed to indicate specific effects. Original stress-strain curves included along with graphs indicating the slopes of each of these. curves (subse-quent to the initial elastic strain portion) as a function of
tempera-ture and rate of loading. ·
INTI:ODUCTION
A number of experinental analyses have been conducted on
uranium because of the usefulness of the material. Several
investigators have even eathered extensive data in order to
establish the tensile properties of uranium. However, as far
as can be found in the literature, no one has ever tried to
observe the influence that the rate of loading has on the
tensile or mechanical properties of uranium.
The author became interested in the subject as a result
of work he had carried out on the flexural creep properties
of uranium. Initially, he wondered whether or not the
short-time tensile test could be used to predict the flexural creep
stress in a beam. Por plastic flow, the equation
E •
Aomi€,T
.
relating stress (a) to plastic strain (E), strain rate (E) and temperature (T) with the constant A, seems to hold well
for uranium in a short-time tensile test. Thus, it was felt
that it might be possible to utilize m, the slope of the
stress versus strain curve on log paper, to predict the stress
in a beam at any position, for any temperature. To do so,
one would utilize the derived flexural creep formula,
-[Mh( £.y
1
2m+l0y - 2I 11 )m
<-sm->J
where m is normally the slope taken from a tensile creep test. In this formula, .oy is theedge of the beam and I is the moment of inertia. If m is
found to be the same for a short time tensile test as it is
during a tensile creep test, then using the slope from either
test would be considered valid in the afor~mentioned formula.
Of course, a short-time tensile test is much more easily per•
formed and this is where the advantage is apparent. However,
since a low strain rate during a short-time tensile test can
be classified as a creep test (1), the interest will lie in
what happens when the rate is increased. If the higher rate
of loading changes the slope considerably at a given
tempera-ture, one would in that case, not be permitted to interchange m•s. However, if the slope does not change appreciably, then
one could validly use the slope found at any rate of loading.
Thus, a principal objective of this analysis was to determine
the effect of the rate of loading on the slope, ie •. actually
on the stress-strain curve.
So a single investigation prompted the analysis considered
in this thesis but the ·results of the effort were of a broader
nature. Not only were data collected on the tensile properties
of normal alpha uranium but the work performed ~ovided insight
into twin and slip mechanisms of deformation in uranium and
REVIEW OF LITERATURE
r.:.-.ny reports on the investigations of the influence of the rate of loading on a wide variety of materials have been
published. Rather than consider the publications on each
material separately however, reports and articles were sought
which principally considered the overall influence of the
loading rate on several materials. Thus, the following re•
views will be primarily oriented to such an approach.
Bernett (1) found that changes in the speed of testing,
especially at higher temperatures, produced great differences
in tensile and compressive strengths. His analysis of the
mechanical properties of four metallic sheet materials were
carried out at speeds from 0.00001 to 0.1 inch/inch/sec., at
various temperatures. Some of his conclusions were
1. For limited amounts of strain, the compressive and
tensile behavior of these materials is similar.
2. In evaluating both tensile and compressive strengths,
the speed of testing, ie. strain rate, is very
im-portant, particularly at high test temperatures.
3. The modulus of elasticity was insensitive to strain
rate in all cases except at elevated temperatures on
one particular material.
4. Creep at high temperatures and high stress levels is
a critical factor both in tension and compression.
can occur in a time interval of the order of a few
seconds.
5. At high temperatures, creep rates can be roughly
es-timated from the tensile stress-strain curves, ie.
at the stress level \'lllcre the stress-strain curve
is essentially horizontal, the creep rate is
approxi-mately equal to the tensile testing strain rate.
Moon and Campbell (2) have dra\"m stress versus strain
rate plots from tensile data for many metals and alloys. The
tests \>Jere perfort1ed at room teuperature and also at elevated
temperature for the purpose of illustrating the effects of
increasing strain rates. They found the general trends of the
analysis for each material \'lere as follows:
1. At room temperature, yield and tensile strengths of
the material either are not affected or are increased
slightly with increasing strain rate.
2. At slightly elevated temperatures the effect is, in
general, similar to that at room temperature, if the
material has negligible tendency to creep at stresses
lower than the yield strength and remains in a stable
condition. However, the yield and tensile strengths
arc usually lm-;er, dependent on temperature. Under
these conditions, the length of title at which the
specimen is maintained at the testing temperature
3. At high temperatures, substantial increases are
caused in yield and tensile strengths with
increas-ing strain rate, if the material tends to creep at
stresses lower than the yield strength. Yield and
tensile strengths tend to coincide for a given
ma-terial as testing temperature is increased.
4. At a given temperature, the elastic modulus of a
ma-terial is relatively constant regardless of strain
rate.
S. Effects of strain rate on ductility are not constant.
6. Reactions which change the structure of the material
will affect its properties when it is h~ated to a
temperature at which the reaction can proceed. The
reactions considered may be precipitation hardening,
strain aging, overaging, tempering,
recrystalliza-tion, and grain growth, or other reactions or
com-binations of them.
Steidel and Makerov (3) used static strain rates of 10-5,
10-4 and 10-2 inch/inch/sec. on the engineexing materials •ith
which they worked. All the materials showed an increase in
yield strength and tensile strength with strain rate increases.
Most of the materials displayed an increase in elongation at
fracture with increased strain rate. The per cent reduction
in area was found to be greater as strain rate increases for
Davis (4) found that plots of stress and yield point
elongation as functions of the rate of loading, displaying
ultimate strength, yield point and yield point elongation are
definitely influenced by the rate of loading. The effect is
very noticeable especially at the faster rates.
He further stated that since stress is a function of
both strain and strain rate, an increase in stress may be
caused by an increase in either the strain or the strain rat~
Thus, the rate of strain hardening must be expressed by the
partial derivative
~~
instead of the general expression~~
• Morrison (5) worked principally with steels. His resultsindicated that all the stress values tend to rise with
in-creased speed of testing; however, the form of the
stress-rate of strain curves differs. The value of the yield stress
seemed to approach asymptotically, at low speeds, a definite
minimum value, and rose very rapidly at the other end of the
rate-of-strain scale. The plastic yield and ultimate stresses,
on the other hand, seemed to suggest that the material, after
yield, behaves like an extremely viscous fluid. These values
did not increase so rapidly at hi~·h speeds, but they gave
little indication of approaching a fixed minimum value at the
lowest speeds used as was the case with the yield stress
dis-cussed above.
Jones and Moore (6) in their work on a number of metals
found that the rate of strain had an appreciable effect on
stain-less steel specimens, the extent of this effect might be
ex-pressed by the statement that a variation of rate of strain
from N per cent per minute to 2N would introduce a variation
not greater than 1% in the value of the yield or the tensile
strength and not greater than 3~ in elongation or reduction
of area.
Pry (7) performed over 300 tensile tests at various speeds
on a number of testing machines to study how the rate of
pulling affects the yield point and tensile strength at room
temperature. He observed that the tensile strength was not
greatly influenced by the strain rate but that there was a
considerable effect on the yield point. His general
conclu-sions were
1. Yield point values.determined under normal teating
conditions· show a scatter considerably greater than
can be attributed to variations in th~ quality of
the material.
2. Yield point values tend to increase with an increaae
in the ra.te at which the test· specimen is 'strained.
J. Yield point values increase generally in a
straight-line relation with the logarithm of the rate of
~ straining. There is also some indication that for
the same increase in the rate of straining, tbe rise
in yield point is less rapid with specimens that
Austin and Steidel (8) worked with a nethod to detert:line
the dynamic tensile properties of materials at hiGh strain
rates. They found that for most engineering materials,
dy-namic strength increases with increasing strain rate and
de-creases with increasing temperature. Under adiabatic
condi-tions of high-speed plastic deformation experienced in impact
loading, the observation was that the effects of strain rate
and temperature apparently act simultaneously.
Pe\'1 experimenters have actually tried to relate the· effect
of strain rate to the other variables involved in tensile
. testing. However, Lubahn (9) has derived an equation relating
stress (a) for plastic flow, plastic strain ( €), strain
.
rate (E) and temperature (T). Three basic equations are
utilized in the derivation.
E=
AamJ ·
E,T
a=
n~j
€,T
B
=
T(P - lnE>/The general expression,
cr,s
a
=
c
GT(E/€.>DT
~E
- Fl'lnE/E.)
(1)
(2)
(3)
(4)
OBJECTIVES OF THE I~~ESTIGATION
The paramount purpose of this investigation was to ob-serve the effect which an increase in the rate of loading had on the tensile properties of normal alpha uranium. Three
M.\TERIAL AND APPARATUS
It has been brought out by Hueschen (10) that the
proper-ties of uranium are sensitive to orientation, which is
con-trolled by prior heat treatment and fabrication history.
Such sensitivity to orientation is due to anisotropy, ie. the
properties of uranium are dependent on the crystallographic
direction. in which the measurement is made.
It has further been reported by Hueschen (10) and also
by Kaufmann (11, p. 65) that variations in chemical
composi-tion are known to have a marked effect on the mechanical or
tensile properties of uranium.
Holden (12, p. 66) states that uranium, like many·other
metals, can have a wide variation in tensile properties
depend-ing on many factors such as grain size, preferred grain
orienta-tion, previous work history, impurity content, testing procedure
and testing temperature.
So it becomes necessary to define· the condition of the
specimen being tested and the method of ·te~ting quite
care-fully. if the tensile properties are to have any meaning at all.
lo1aterial
Mallinckrodt Chemical Works manufactured the normal alpha
uranium which was utilized in the tensile tests considered
for this report. The uranium was prepared .by reduction from
the salt with magnesium to a 3,400 lb. dingot. The dingot
was gamma extruded to a 7-inch diameter round which was then
heat treated in a salt bath for 30 minutes at 1200°P and
alpha extruded to rods approximately 1 3/8 inch in diameter.
It was received as slugs 1 3/8 inch in di.ameter by 8 inches
in length.
Analysis of the impurity c·ontent is given in Table 1.
Table 1. Spectrographic and chemical analysis of impurity content in test material as furnished by fabricator
Element )1n B Mg Ni Cr N H C Pe Si 14
<:s
12 1.3 . 20 .PPM <::10<0.10 <10
Wt. ,, 0.0053 0.0027
The density of the material at room temperature waa
19.Q3
gm/~m
3 • .Specimen Preparation
None of the specimens were annealed before teatins ao
it was important to prepare the specimens so that they··•ould
be as similar in grain structure as possible.. This was done
· by first cutting the a-inch slugs into 4-inch lengths. By
cutting along two perpendicular diameters, each 4-inch slug
was then sawed into quarters providing the rough pieces from
which the specimens were subsequently machined. Therefore,
[image:20.614.56.517.273.737.2]since they were all made out of material equidistant from
the surface of the slug.
The 4-inch specimen was prepared so that the reduced testing section at the center two inches of the specimen had a 0.357 inch diameter as recommended for tensile testing by
the ASTM standards (13). The remainder of the specimen was
threaded.
1/2 - 13UNC threads were cut approximately one inch
long on each end of the specimen immediately after rough
turn-ing was completed and then the center 2-inch test section was
machined. By means of interchangeable carbide tips and an
advance of 0.001 inch, the 0.357 (+0.001, -0.000) inch speci•
fication was met in this test section of the specimen. A finish pass then gave the piece a smooth appearance.
The tool was fed very slowly for the duration of the
machining of the specimen since uranium is spontaneously
flammable at temperatures caused by fast machining and also
in order to minimize the amount of cold work affecting the
piece.
Testing Bquipment .
The tensile testing of uranium, especially at higher
temperatures requires a unique testing facility since this
material is easily oxidized (14). The equipment used in
Much ~£ the apparatus was specially designed by Bohn
and Murphy (15).
Test facility
Load application for the tensile tests was provided by
a 60, 000-lb. Bald'tdn-South'l.\'ark hydraulic testing machine.
This was used in conjunction with a Tate-Emery load
indica-tot, an electronic proportioning furnace controller, a high
temperature vacuum test chamber, an extensometer - LVDT
strain indicator, a Mosley Autograf x-y recorder for load• .
strain recording, vacuum pumping and measuring instruments
and temperature indicating and recording potentiometers. · A
platinum resistance thermometer, wound integrally with furnace
beater windings,provided temperature sensing for control.
Four chro~el-alumel thermocouples attached to the specimen
pro~ided temperature measurements.
.
.
A specimen was set up in the total test assembly by first
having it secured in the Baldwin testing machine. With ·
ex-tensometer and thermocouples attached, it·was then enclosed
in the vacuum system where it in turn underwent thorough .. heat-ing by a furnace located outside the vacuum system. With the
temperature set at the correct level as seen on the recorder,
str.aining the specimen caused the extensometer-LVDT strain
indicator to be activated. The strain and load indications
then were plotted on the stress-strain coordinates of the
\'las obtained.
Test chamber
To provide protection against oxidation, a vacuum chamber,
as mentioned above (15), housed the specimen and its
extenso-meter mechanism. This chamber was attached by means of the
lower load application rod to the lower stationary cross-head
of the tensile machine and thus did not affect the tare weight
of loading. During loading, elongation of the chamber was
permitted by means of a bellows at the top of the chamber.
Pressures between 1 and 5 x 10⁻⁶ mm Hg could be realized
by the pumping system which consists of a mechanical fore
pump, an oil diffusion pump and a liquid nitrogen cooled cold
trap. With pressures such as these, tbe furnace could go to
temperatures up to 1000°C without oxidation effects on the
uranium. Only chamber components, which were ·primarily 316
stainless steel prevented higher temperatures.
Bxtensometer - LVDT strain indicator
The testing system utilized a linear variable
differen-tial transformer (LVDT) to transfer strain measurements through
the vacuum wall of the test chamber (15). The movable core
of the LVDT.is positioned on the inside of a flexible well
of the vacuum chamber and the voltage developed as this core
moves gives an indication of the strain in the specimen. Of
of the flexible well. By means of the well, the motion was
transmitted from the knife edges that are rigidly attached
to the tensile specimens. Thus, strain was actually read out
through the LVDr. The ac output voltage of the LVDr was
rec-tified to de and both load (stress), from the Tate Emery
in-dicator, and strain could be sensed and plotted on tbe Moaiey
Autograf recorder. .
.
.
.
.
EXPERIMENTAL PROCEDURE AND RESULTS
In order to carry out a tensile test on normal alpha
uranium, a specimen was set up with a 1.5-inch gage length
between the knife edges in the apparatus previously described.
Next, tl:c vacuum system was started and when a sufficient
vacuum had been achieved, the furnace was turned on. The
specimen was then brought up to a predetermined temperature
while the system was kept evacuated properly. ~~en the
de-sired temperature was achieved, as recorded from the
thermo-couple at the center of the specimen, the tensile test could
finally be performed. Eleven different temperatures in the
range from room temperature to 600°C were utilized (25°C,
80°c, 150°C, 200°c, 250°c, 300°C, 350°C, 400~,
soo
0c, sso
0c
and 600°C). Three different constant rates of straining were
also employed at each temperature (0.0400 min.-1 , 0.0130
min.-1 and 0.0017 min.-1). To maintain these rates, the
operator adjusted the Baldwin machine properly over intervals.
Forty tensile tests were carried out but some data on
several tests \'lere disregarded because of inoperation .of
some part of the apparatus.
The results of each of the forty tensile tests are
re-ported in Table 2. ~he temperatures shown in this table were
those listed on the tempe~ature recorder. Such temperatures
-·
Test Temp. Strain Tensile Percentage Percentage 1/m Modulus Yield no. (OC) rate .
1 stren~th elongation reduction of elas- . strength
(min- ) (ksi in 1.5 inch in area ticity at 0.2%
gage length (psi x 106 ) offset
(ksi)
1 25 0.0!30 . 95.6 8.7 11.2 0.355 25.2 42.0
2 25 0.0400 98.2 6.7 9.1 0.299 27.5 40.5
3 25 0.0017 93.5 8.7 9.6 0.284
4 80 0.0130 96.8 26.7 22 .. 1 0.319
5 80 0.0400 97.7 28.1 20.1 0.300 29.1 37.6
6 80 0.0017 95.1 18.0 15.0 0.306
7 150 0.0130 74.8 0.239
8 150 0.0017 78.4 27.3 29.3 0.301 20.8 31.7
...
9· 150 . 0.0130 . 74.4 31.7 27.8 0.264 ~
10 150 0.0400 79.0 31.7 31.1 0.257 30.3 34.2
11 150 0.0130 74.6 27.7 37.6 0.253
12 150 0.0017 76.5 29.5 29.3 0.232 27.5 34.7
13 200 0.0130 65.7 28.8 49.7 0.222 24.3 32.6
14 200 0.0400 65.2 31.1 48.5 0.246 26.3 31.6
15 200 0.0017 65.3 31.3 44.8 0.204 20.7 33.7
16 200 0.0400 64.2 29.6 37.6 0.230
17 250 0.0130
sa.o
. 28.7 52.4 0.198 21.7 30.218 250 0.0400 52.4 31.3 59.7 0.195 26.1 31.4
19 250 0.0400 55.2 28 .• 3 52.0 0.223 24.4 29.9
[image:26.614.63.697.93.551.2]Test Temp. Strain Tensile Percentage Percentage 1/ru Modulus Yield
no. (°C) rate 1 stren~th elongation reduction of elas-· strength
(min- ) (ksi in 1.5 inch in area ticity at 0.2%
gage length (psi x 106 ) offset
(ksi)
21 300 0.0130 47.2 31~3 50.1 0.193 17.9 30.4
22 300 0,0017 46.2 24~1 48.1 0.166 16.6 29.2
23 300 0.0400 47.6 30~8 57.3 ·0.143 . 22.6 . 32.6
24 350 0.0400 36.6 20.0 57.7 0.142 19.4 27.6
25 350 0.0130 37.4 . 25~7 59.1 0.153 22.0 27.0
26 350 0.0400 39.8 25.3 57.7
27 350 0.0017 36.3 15~9 56.2 0.139 16.4 26.5
28 400 0.0130 33.7 22.6 63.0 0.149
....
29 400 0.0400 31.6 20.0 56.2 0.123 17.4 26.5 co
30 400 0.0017 32.9 22.7 65.3 0.139 16.7 24.6
31 500 0.0130 . 16.3 29.9 74.5 0.103 15.4 13.8
32 500 0.0400 19.1 27.2 71.6 0.089 15.3 16.2
33 500 0.0017 0.094 10.7 10.8
34 500 0.0017 11.0 30.3 81.1 0.067 9.8 10.0
35 550 0.0400 10.2 34.1 83.7 0.089 15.5 10.4
36 550 0.0130 10.1 88.1 0.117
fo.s
8.937 550 0.0017 8.3 36.1 92.6
38 600 0.0400 6.0 48.0 92.4 0.177 9.5 4.5
39 600 0.0130 5.4 46.7 91.8 0.107 11.4 4.5
[image:27.612.57.702.68.597.2]I
I ,The rate of loading was defined by that strain rate found
in timing the progression of the x-y recorder as it plotted
the stress-strain curve.
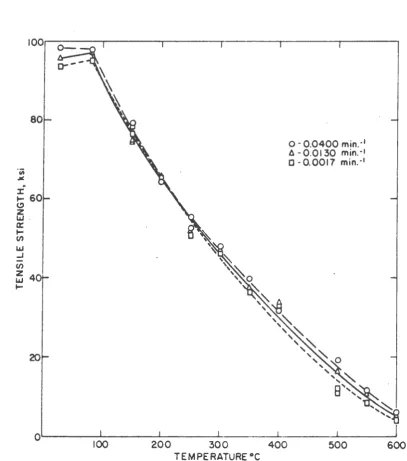
The tensile strength was determined by reading the maxi•
mum position of the hand on the load indicator. A plot of tensile strength versus temperature for the three different .
rates of loading is shown in Figure 1. Figure 2 displays tensile strength versus strain rate with temperature as the parameter.
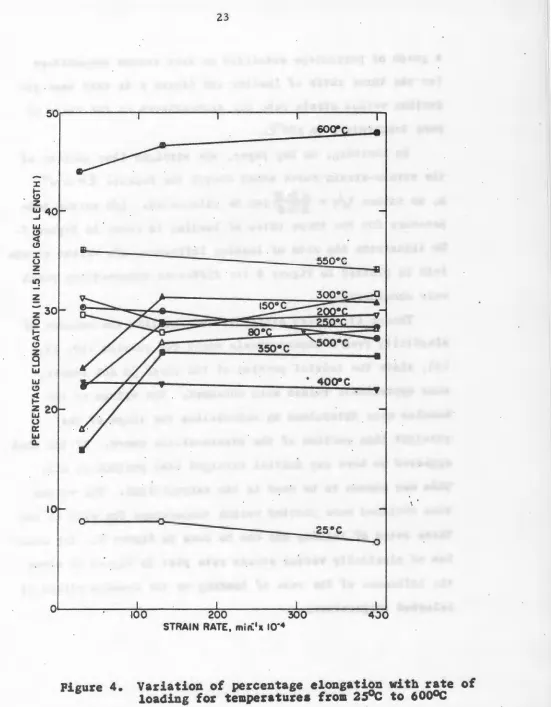
Percentage elongation of a specimen for a 1.5~inch gage length was calculated by measuring the distance between the
! .
: knife edge mark& for the broken specimen and comparing this length to the original 1.5-inch gage length. Pigure 3 dis-plays plots of percentage elongation (in l.S inch gage length) versus temperature fo'r . the three rates of straining. Pi:gure 4 then shows t~s percentage elongation as a fUnction of strain rate for .various tempera.tures up t.o 600°C.
80
-:t:1- 60 C) z
w .
a:
l-en
w ...J
en
a4
1-20
0-0.0400 min. -I
6-0.01 ~0 min.·•
C -0.0017 min.·•
0,~---~---~---~---~---~---~
100 200 ~00 400 500 600
Figure 1.
TEMPERATURE •c
[image:29.614.108.516.191.653.2]·;;;
~
-:r ... C)
z
Lt.J 0:
... (/)
Lt.J .J
c;; z
Lt.J
...
I00~---.---.---~2~5-..c~----~~~
=e
\eo•c
80
0- ~~·c:
-o
'"1J-=
v v
2oo•c
v60
2so•c:
•
•
•
30o•c
40
3so•c
•
•
4oo•c
20
li
o~---~~~o~o---~2~o~o---~3o~o~---4~oo~
STRAIN RATE, min.·1 11 10·4
C>
z
LLJ
..J
~ 40
~ r u
z
~· z 30
z 0 t= <l C> z
9
20LLJ w C> ~ z w
~ 10 w
Q..
I .
0
/0
~~~o-~~----
~e,
~
I'
... /. /' ..._ D
', 0... /
0 '
'
...-
"' / " ' /' , - - ? .•. ~ ...
' ... _£> ___ ;..,"t>
0
0 0.0400 min:1
t:. 0.0 130 min.-'
0 0.0017 min.-1
0 .100 200 300 400 500 600
TEMPERATURE , "C
Pigure 3. Percentage elongation as a function of temperature·for three
differ-ent rates of loading ·
50r---~---,---~---.---~
[image:32.612.57.608.53.760.2]:r
...
(.!)
z
w 40 ..J w (.!) < (.!) li :r
u sso•c
z -II
ll1 z ... 30 z 0 ~ (.!) z 9 w
w • 40o-C
(.!)
::
Z2 w u a: w ~ 10 o~---~o---~2~5~·c~ --o o~--~--~~--~--.d~---~~---_u100 200 300 4JO
Figure 4.
STRAIN RATE, min:1x 10"4
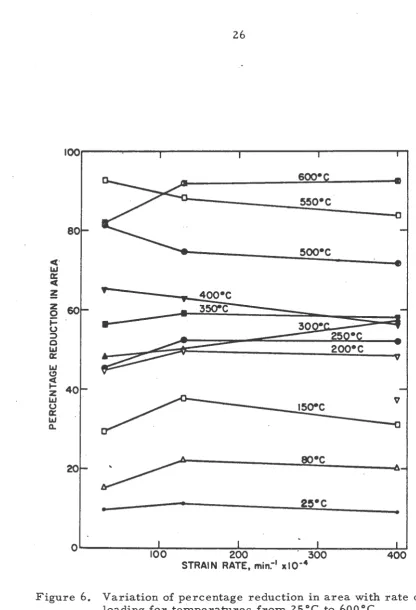
a graph of perce~tage reduction in area versus temperature
for the three rates of loading 3nd Figure 6 is that same
re-duction versus strain rate for temperatures in the range of
room temperature to 600°C.
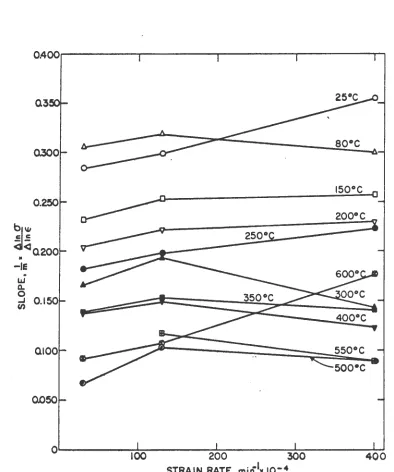
By locating, on log paper, the straight line portion of
the stress-strain curve \'lhich obeyed the formula E = A om,
m, or rather 1/m = All\ 6" can be calculated. 1/:m versus
tem-A 1, E'
perature for tt~ three rates of loading is shown in Figure 7.
To illustrate the rate of loading influence, 1/m versus strain
rate is plotted in Figure 8 for different temperatures which
were considered.
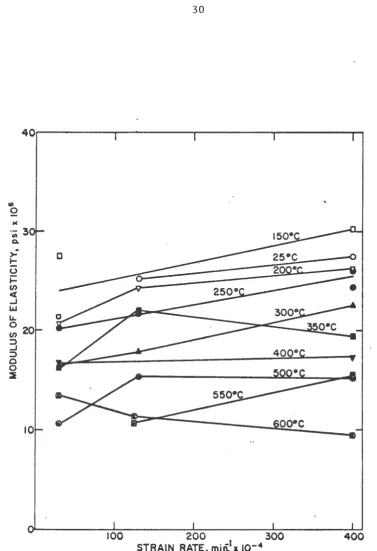
Though it is very difficult to establish the modulus of
elasticity from a stress-strain curve for uranium (10, 12,
16}, since the initial portion of the curve is not linear,
some approximate values were obtained. The va1ues of the
modulus were determined by calculating the slope of the
straight line portion of the stress-strain curve. If the plot
appeared to have any initial straight line portion at all,
this was chosen to be used in the calculations. The values
thus obtained were plotted versus temperature for each of the
three rates of loading and can be seen in Figure 9. The modu•
lus of elasticity versus strain rate plot in Figure 10 shows
the influence of tbe rate of loading on the modulus values at
8
ct
~
I
z I
~so
-l
It- '
0 I =>
I
0 !
1&.1 I
a:: I
~
40rl 1&.1 0 a:: 1&.1 Cl.. 20~_JJ ~
/
/
,." 7
/ 0
,." /
D" /
ll"
~ /
..--:~ / - - \ , l -o_.
0 0.0400 m 1"1.·1
6 0.0130 mm -: 0 0.0017 m1r. -·
I
1
I
I
II
i I--i
I0 100 200 300 400 500 600
Pigure
s.
TEMPERATURE, °C
Percentage reduction in area as a function of temperature for three different rates of loading
N
.· 100 soo• 55o•c 80 5oo•c c(• w a: <
~ 4oo•c
z 60 35Q-C
0 ~ 0 ::J 0 w a: w (.!)
~ 40
z
w
0 15Q-C
a:
w
a..
eo•c 20
..
25•c-
•0
100 200 300 400
[image:35.614.74.491.78.689.2]STRAIN RATE, min.-1 xlo-4
Figure 6. Variation of percentage reduction in area with rate of loading for temperatures from 25 °C to 600 °C
':.
0.30
0.250
bl\1.1 c::: c:::
<l<l 0.200
•
-le
0.150
0.100
0.
Pigure 7.
0
0
0 0.0400 min:1
6 0.0130 min:•
0 0.0017 min.·•
0
0
-IE
.
w
0.
0
...J
(/)
OAOO~---r---~r---,---~~
03
o~---~,~oo~---~2~oo~---~30~o~---~~
[image:37.612.109.503.180.652.2]STRAIN RATE. miri.1x 10-4
..
i
.
~
t: 20 u ~ ~
_,
w ~ 0 U)3
:;) 010 0 2 0..D---...,
... []'
0~
0 ' 06.
'
---..., [] ... ..."
o,
[] ... [] ...
.
:-... 6. ... ~ ...[] ... _Q
0 0.0400 min.-1
6. 0.0130 min.-•
[] 0.0017 min.-•
---
---___ .,.--...
..._
[] [] 0'" I
~6.6. I
0
0 100 200 300 400 500 600
Plgure 9.
TEMPERATURE, °C
Modulus of elasticity as a function of temperature for three
differ-ent rates of loading
N
40.-~---,---~---~---~
Ill
0
)I(
"iii 3 Q.
.;
..,_
0 ~
(/)
<
...J
LIJ 1.1..
0 20
(/) 3
: l
0
0
:i
10
100 200 300
STRAIN RATE, mili1x I0-4
400
Figure 10. Variation of the modulus of elasticity with rate of loading
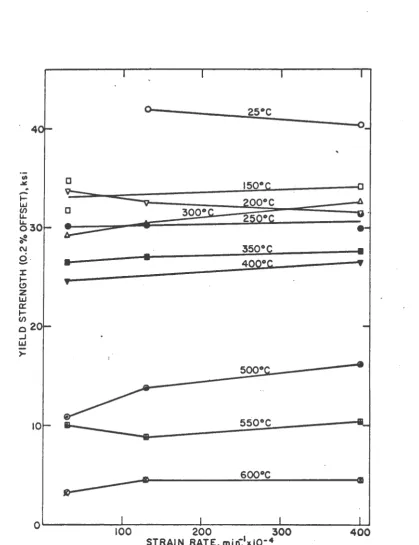
[image:39.614.115.493.96.648.2]The yield strength at 0.21 offset was located iD each of
the.tests for •bi.ch a modulus of elasticity bad been deter•
mined. The yield strength was eYaluated at 0.21 offset in
order to be certain that the aaterial bad actually undersooe
permanent deformation and in accordance with AS!M
apeciflca-tlons. Figure 11 is a graph of yield strength (0.21 offset)
as
a function of temperature for the three rates of loadins.However, the rate of loading effect on the yield strenstb can
be observed aore clearly in Pisure 12 wbere yield atrenstb
versus strain rate is plotted with teaperatare a•
tbe
para•meter.
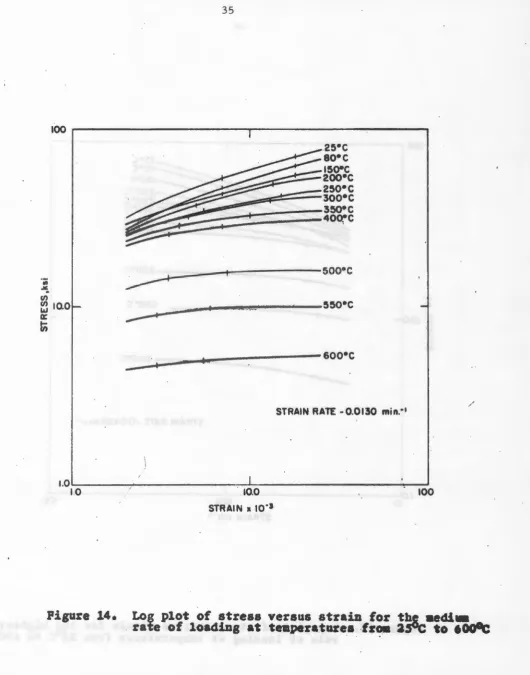
Figures 13, 14 aDd 15 are los plots of stress Ye£saa
strain with a parameter. of teaperature ~r• each grapb was
plotted for a different rate of loading. The portion of the
curves tba t obeys the formula € • A fiA la incUcated in each
of the figures.
A log plot of stress Yersua strain is presented in Pigure
16 for temperatures in the
aSOc
to 600~ ranse and for certaindefinite strains at these temperature••
Figures 17, 18 and 19 were drawn to display the original
stress-strain curvea out to a atrain of 20 x 10~3• Thus,
they are the actual results of the experimental work. Bach
figure shows the curves for one particular rate of loadlns
only, with temperature as a parameter.
·;; .>1!
-
... w Cl) It 0 ~ ~-
J:~
w ct: ... Cl) 0 _J w)-Pl&ure ·11.
D
0 0.0400 min.-1 A 0.0130 min.-•
D 0.0017 min. -t
1oo·· 200
R--...
~
...,
o,
D '\.300 400
TEMPERATURE,•c
'
',
'o
',
''a
'-o~
',,
~',
',, ~',-.a
500 600
Yield strength as a function of temperature for three different rates
of loading
o--. 4
fit
~ tso•c
~
..
....
1-:
zoo•cI.LI
~ 3oo•c
2so•c
~30
•
~
0
(\j 350°~
;
c).:
•
4oo•c....
::r: 1-C) z I.LI a: 1-(/)c 20 ..J
I.LI
>-
..
soo•
10
0~---~~---~---~---~ 100 200 300 400
STRAIN RATE, min~1xto-4
Figure 12. Variation of the yield strength with rate of loading for
[image:42.614.98.518.136.682.2]100~---,.---~
.iii
.:.
u; 1o.o
__ ...,_----+---
soo•cen
L&J a:
~
en
~--+---+--- soo•c
STRAIN RATE ·0.0017 min."1
I.OL0---:-:10~0=-· ____ :....__ ______________ ~100
I. .
Pigure ll.
STRAIN x 10·s
100 ~---,---~---,
Ill
~
en ~ 10.0
a:
t;
~----+---5oo•c
_.---+
. ~---+---55o•c
___..
~-+---....---:---soo•c
STRAIN RATE- 0.0130 min.·•
I.OL---;"---:-. ~:---""t""--~100
1.0 10.0
Figure 14.
STRAIN x Jo·s
[image:44.594.50.581.52.727.2]100~---~---~
~ 10.0
....,
a:
...
(I)~....---+---5oo•c
..--~---soo•c
.STRAIN RATE -0.0400 min.-1
1.0..__ ______________________ ..._ ____________________ ....,--~
~ ~ ~ ~
Figure 15.
STRAIN xi0"3
[image:45.612.25.559.81.729.2]'
1000
R
f
"iii
.lit
10
rh
II) w
a: ....
(/)
r
10
to·:s
Figure 16.
~ ~
:
I
..
•
-.
o zs•c
l
• 350•cl
ll aooc E • o.o1s ~ 400° C E • 0.007
c 1500C • 500-t
v 2000C
l
• sso•c}• 2so•c E •o.o1o • 6000C E •0005 • 300"C
10"2 to·•
STRAIN RATE, min.-•
[image:46.612.113.520.177.590.2].:
40r-(/)
Lal
10
STRAIN RATE- 0.0017 min:1
//
~-=---;{~
2.5 5 7.5 10.0
STRAIN xi0"3
2oo•c
-
2so•c300°
350°C
j
4oo•c
soo•c
soo•c
12.5 15 17.5 20
Plgure 17. Stress-strain curves over range of temperatures for lowest rate
of loading
"
• ~
u;
(/)
w
a::
1-(/)
.,..
70r---.---.---.---~---~---~---=---,
STRAIN RATE-0.0130 min."1
250°C
300°C
350°C 4oo•c
2
5oo•c
55o•c
600°C
0 2.5 5 7.5 10 12.5 15 17.5 20
STRAIN • 10"3
. fisure 18. Stress-strain curves over range of temperatures for medium rate of loading
w
STRAIN RATE -0.0400min.-1
30QO
- -.vr / / ~ ~ ~
..
.JC
(/)
(/)
1&.1 0::
~
(/)
~J
~
35o•c
I
4oo•c
10
Plsure 19.
5 7.5 10
STRAIN x
10
-!12.5
50o•c
550•c
6Qo•c
15 17.5 20
Stress-strain curves over range of temperatures for highest rate of loading
~
-"'
.:.c
(/)
(/) w
0:
1-(/)
60r---r---r---r---r---r---r---~---~ 0.0130min:1
---TEMPERATURE -150°C
0 2.5 5 7.5 10 12.5 15 17.5 20
STRAIN x 10 -3
Pigure 20. Stress-strain curves for various rates of loading at 150°C
"'
.¥
(/) (/)
w
a::
.,._ (/)
0.0400 min:'
30 .0130min:1
20
TEMPERATURE-350°C
OL---~---~---~---~---~~---~---~~----~
2.5 5 l5 10 12.5 15 17.5
STRAIN 1t 10~3
Plgare 21. Stress-strain curves for various rates of loading at 350°C
,
..
~
.
..
~
2QOr---~---.---.---..---~---,---r---~
15.0 /
I
I
I
.
--_...-.
0.0400min~• _ _
-
---/.,.,. 0.0130 min:1
/ 0.0017 min:1
I
---~10.0
1
.,...
-
--
----w
a::
~
(/)
/
,,
I ,'I
/I
TEMPERATURE- 550°C5.0
0 2.5 5 7.5 10 12.5 15 17.5 20
STRAIN x 10-1
Pigure 22. Stress-strain curves for various rates of loading at SS0°C
*"'
where rate of loading is the parameter. These curves are
also taken from the original stress-strain diagrams as
indi-cated on the x-y recorder. Figure 20 is plotted for a
tempera-ture of 150°C, Figure 21 for JS0°c· and Figure 22 for 5S0°c.
Several typical original stress-strain curves have been
placed in the Appendix for the purpose of illustration, but
the important portion of these original curves baa already
DISCUSSION OF RBSULTS
As a result of the tensile tests which were performed
on normal alpha uranium, the conclusion was made that the
tensile properties of this material are affected by the rate
of loading. However, the extent of the influence of the
rate of loading is not nearly as great as the effect of tem•
perature on the tensile properties. This should be obvious
from a study of Figures 1 - 22. The specific properties dis-played in these figures are discussed individually below.
The tensile strength of uranium decreases with
increas-ing temperature as observed in Figure 1. Previous analyses
on uranium (10, 12, 17, 18), have resulted in data which are
generally comparable to this with the exception of the initial
portion of the curve. Pew experimenters have observed the
anomaly in the region of 80°C for uranium because they have
not considered it important to make a test between room
tem-perature and 100°C. Thus, most tensile strength versua
tem-perature curves do not show a deviation at this point.
How-ever, such an anomaly in uranium has been o~served pre~iously
by Bernard and Coureau (19) and is significant since it seems
to affect many of the tensile properties of the material at
tbis temperature. The tensile strength of uranium is as high
or higher, depending on the rate of loading, at 80°C aa it
tensile strength decreases with increasing temperature as was previously mentioned.
It should be noted that tbe test with the lowest rate of loading appears to have the lowest tensile strength. This can be observed more clearly in Pigure 2. AD increase in rate of loading or strain rate generally causes an increase in tensile strength for any material considered, especially at higher temperatures (1, 3, 5).
There are several interesting areas to study in the curves of figures 3 and 5. The percentage elongation of uranium,
for all gage lengths,· characteristically increases quickly be•
fore leveling off in ita plot while the percentage reduction in area increases almost steadily (10, 12, 17, 19, 18). · The reason that the curves take such shapes is rather easily ex-plained. In the range near room temperature the deformation seems to be quite uniform over the entire reduced section of the specimen but as the temperature is increased, necking down occurs and. the elongation is then localized more to the necked region. Thus, a definite break will ~cur in the elongation curve when localized necking down is initiated. However.,~ the
reduc-tion of area plot ~11 not be affected nearly as much since
it is based on necking down of the specimen from the start.
So in the region of 60°C to 700C, a brittle transition
the percentage elongation versus temperature curve. The
ma-terial is much more brittle at room temperature than it is at
higher temperatures. Holden (12, p. 109) adds that this tran•
sition temperature in uranium is a function of impurity con•
tent and that it also may be caused in part by the high
stresses resulting from the twinning mode of deformation.
Since the subject has been introduced, it should be
pointed out that twinning is certainly involved in the sig•
nificant deviation from the smooth plot observed in the region
of 3S0°c, in Figures 3 and
s.
It has been known for a longtime that at about 350°C, the principal form of deformation
predominating in uranium shifts from twinning, which has been
more active below this temperature, to slip (9, 12, 17).
McLean (20, p. 88) brings out the point that the stress for
twinning tends to be large at room temperature and below, with
the result that twinning occurs under conditions where yield
stress is high. For example, he states that ~inning will be
particularly large at low temperatures or high rates of strain
in bee metals. Uranium has orthorhombic symmetry &Dd it can
be considered as having a deformed hexagonal close-packed structure (21, 22), so it is certainly not bee. However, one
can not help notice that in Figure 3 and in figure S also, the deviation from the smooth plot seemed to occur for the low
rate of loading before it did for the others. Thus, twinning
loading. The other two rates of loading are closer together
and so one is unable to state definitely that twinning will
tend to predominate longer at the higher rate of loading. The
plot of reduction in area would substantiate such a statement
however. So it is postulated that there is not only a tempera•
ture dependence on when slip plays the paramount role as a
mechanism of deformation in uranium but also a rate of load•
ing dependence.
One must remember however, as Nichols (16) and others
have brought out, that not too much reliance should be put in
graphs of percentage elongation or percentage reduction in
area. Nichols stated that values he bad seen reported for percentage elongation in uranium had ranged at room
tempera-ture from 5 - 15' and at 500°C, from 5 - 57%. Perhaps a good example of this would be to take Figures 4 and 6 and to try to state what the influence of rate of strain is in these
plots. One could not say that there is definitely an increase
. or decrease in either percentage elongation or reduced area
with increased rate of loading though the low rate of loading
seems to present the lowest value for both, in the majority of
cases.
Aln a
~ slope, dln
a •
1/m of the stress-strain curvenoticeably decreases as the temperature increases (Figure 7).
Therefore, m in the formula £• Aam, for plastic flow,
in-creases considerably with increasing temperature. This result
indicates that a much smaller stress is needed to cause a
certain strain in uranium at a high temperature than is needed
at a low temperature. The implication is that the amount or
magnitude of strain hardening which uranium will undergo at a
given strain rate becomes less as the temperature is increased.
Some significance may also be attributed to the fact that
the region of validity of the formula,
E:•
A am not onlycom-mences sooner but also becomes smaller and smaller as
temper-ature increases (Figures 13, 14 and 15).
In considering a certain temperature, the variation of
Aln a a~ a function of strain rate (Figure 8) indicates that
Aln e
the degree of strain hardening is least for the lowest rate
of loading. The influence of strain rate is nowhere near as
great as the influence of temperature but it is still notice•
able~ With a low rate of loading, the material appears to
have the opportunity to rearrange itself in some manner so
. that strain hardening does not occur to as great an extent as it does in the faster rates of loading.
As was mentioned in the previous section of this report,
. '
the modulus of elasticity and yield strength of uranium are
difficult to determine. Nichols (16) found that the modulus
of elasticity reportedly varied at room temperature from
15.8 - 30.0 x 10⁶ psi. Nichols adds further that the
propor-tional limit is even less well defined as the temperature
men-tioned merely to precaution the reader on the use of the
val-ues of the elastic modulus. However, for both the properties
of modulus of elasticity and yield strength, the curves agree
quite nicely with reference values (17, 23). As functions
of temperature, both properties decrease with increasing tem•
perature and display the familiar variation from the smooth
curve in the range of 3S0°c. The yield stress plot of
Fig-ure 11 illustrates the digression well but deviations from
smooth plots in Pigure 9 for the modulus of elasticity are
quite apparent in this range also.
For the low rate· of loading, several values of the modulus of elasticity are missing. The reason is, as a
re-sult· of the shape of the stress-strain curve, an uncertainty
exists in deciding what portion of tbe curve to use in order
to calculate the modulus for the low strain rate. Therefore,
Where the curvebld DO lDitial linear region, DO elastic
modulus was determined. Actually one wonders wbetber these
values are valid anyway since the low rate tensile teat ia
almost a creep test. Bernett (1) stated that for the ma~erial
he worked with, the lower values obtained at a very low strain
rate are thought to be a result of the distortion of the
stress-strain curve due to creep. Thus, he felt that these
values really should not be utilized since the initial portion
of the stress-strain curve does not seem to be elastic under
Bow-ever, the values for the modulus of elasticity are reported
and one can observe the influence of the rate of loading on
them in Figure 9. The modulus certainly increases vitb hisher
strain rates.
The influence of the rate of loading on tbe yield stress
(Figure 12) can be taken as an indication of strain hardenins.
If the yield stress. increases, this is taken to be a strong
indication that the amount of strain harcSenins has increased.
From Figure 12, one can see that nen though the influence ~
small, there does appear to be an increase in yield stress
with increasing strain rate, especially at the higher teapera•
tures. Thus, once again it can be surmised that the desree
of strain hardening in normal alpha uraniua increases w:l th an
increase in the rate of loading.
Lubabn (9) in his derivation of a general flow equation
in the region of plastic flow utilizes a basic equation for
metals, as was cited in. the literature review •.
·
e·
A Jli£,T (1)This formul~ applies to uraniUII in the xegions as aaxked in
the stress-strain curves of Figures 13, 14 and 15. 0. of
the main reasons for including these log plota waa
to
JDdicatehow the portion of the curve, which equation 1 holds for,•ariea
with temperature. As was previously mentioned, tbe left haD4
limit and also the extent of the region of validity both vaxy
with temperature. Tbe right hand limit of the region con•
do\~ occurring in the specimen. The x-y recorder was not able
to correct for this and thus the stress values decreased
cor-respondingly resulting in incorrect data beyond this limit.
Equation 2 is found to be valid as a result of plots in
Figure 16. There is one basic difficulty however in utiliz•
ing this equation and that has to do with the limited portion
of the curve where such an equation will hold. It is valid
only for plastic flow as was equation 1 and thus really should
not be considered too near to the beginning of-the test.
Therefore, in order to be able to correlate this equation to
equation 1 and still be in a valid region, a strain within the
limits of the curve where equation 1 ·was valid baa been taken.
Thus, different strain values were used to ascertain the stress
as the temperature increased. So even though equation 2 seems
valid from the linear plot results of Pigure 16, one could not
correlate this equation along with equation 1 into one
gener-al flow equation since the regions of vgener-alidity of the two
equations vary with temperature. A general flow equation
such as equation 4 is therefore impossible. A leas general
equation with specific validity regions for different tempera•
tures however would be possible.
Holden (12, p. 66) indicates that it is very difficult
to assess the value of tabulated data unless the original
stress-strain curves are included. Thus, Pigures 17~ 18 and
19 are valuable in the sense that they show the results of
the tensile tests performed. One should readily note from
these curves that for temperatures higher than 400°C the
curves are spread much further apart than they are below thia
temperature. The predominance of the ~lippage deformation
mechanism in this range for uranium may be the cause of that.
One can see directly from the stress-strain curves
(Figures 20, 21 aDd 22), how the rate of loading influences
the tensile properties of uranium. Por the three different
strain rates in Figures 20 and 21, the curve correapoDding
to the low rate of loading is predominantly on the lower side
of the three and the other two respectively higher as their
strain rates increase. However, all three curves in these
two plots are quite close together. Figure 22 brings out the
role that temperature plays since ita values are taken at
SS0°c and Figures 20 and 21 are plots at 150°C and 350°C. So, the rate of loading influence on normal alpha uranium ia
greater at the higher temperatures th~ at room temperature •
. Of course, creep will play more of a major role aa tbe tem•
SUMMARY AND CONCLUSIONS
The investigation consisted of performing 40 tensile
tests on normal alpha uranium in order to determine the in•
fluence of the rate of loading on the tensile properties
of alpha uranium.
The tests were conducted in the temperature range from
25°C to 6000C at three constant loading rates (0.0017 miD.-1,
0.0130 min.-1 and 0.0400 min.-1).
The conclusions made from a study of_the results are
1. The tensile properties of uranium are influenced by the rate of loading, however the effect of a rate change ia
much less, in magnitude, than the effect caused by a
change in temperature.
2.. The tensile strength, yield strength and modulus of
elas-ticity are the properties of uranium most affected by the
rate of loading, especially at the higher tem~ratures.
A general statement can not be made about the iDfluence of rate of loading on the percentage elongation (iD 1.5
inch gage length) and the percentage reduction in area
for uranium but the lowest strain rate seems to give the
lowest values for both of these properties in the major•
ity of cases.
3. The slope of the uranium stress-strain curve in the region
of .plastic flow is affected by the rate of loading and in
..:
rate of loading.
4. The lowest rate of loading appears to cause the smallest
amount of strain hardening in uranium at a specific tem•
perature.
s.
The predominance of the twinning and slip mechanisms ofdeformation in uranium may not only be affected by tem•
SUGGESTED TOPICS FOR FURTHER INVESTIGATION
A more complete analysis to observe the effect of rate of loading on twinning and slip mechanisms in uranium might turn out to be very interesting. This same analysis might be
carried out on other materials which display a change in the predominant mode of deformation from twinning to slip at a definite temperature. Thus, one might be able to generalize about such an effect.
A second field of inquiry might have to do with a con-sideration of the region of validity of the equation €:a A
rP
as seen in Figures 13, 14 and 15 of this thesis. One could look .into the reason behind the variation with temperature in
the limits of validity as well as changes in the size of the limiting region for temperature changes. Thermal expansion of uranium, which simply causes a separation of the atoms in the array, may have a great deal of significance in connection
·with this.
Since a change of strain rate was found to influence only slightly the slope of the stress-strain curve in the plastic region compared to the effect of temperature, ·equations for
prediction of stresses in flexural creep might be able to utilize such a slope. This could prove to be an interesting
LITBRATURB CITED
·1. Bernett, E.
c.
Short time, elevated temperature,stress-strain behavior of tensile, compressive, and column members. U.
s.
Atomic Energy Commission Report WADC• TR-59-484 [Wright Air Development Center, Wright-Patterson AFB, Ohio]~ 1959.·2. Moon, D. P. and
J.
B. Campbell. Bffecta of moderately high strain rates on the tensile properties of metals.u.
s.
Atomic Energy Commission Report DMIC-Memo-142[Battelle Memorial Inst. Defense Metals Information Center, Columbus, Ohio]. 1961.
·3. Steidel, R. F., Jr. and
c.
B. Makerov. Tbe tensile prop-erties of some engineering materials at moderate rates of strain. American Society for Testing and Materials Bulletin 247:57-64. 1960.4. Davis, E. A. Tbe effect of speed of stretching and the rate of loading on the yielding of mild steel. Ameri• can Society of Mechanical Engineers Transactions
60:A-137 - A-140. 1938.
5. Morrison, J~ L. The influence of rate of strain in tension tests. Engineer 158:183·185. 1934.
6. Jones, P. G. and H. F. Moore. An investigation of the effect of rate of strain on the results of tension tests of metals. American Society for Testing and Materials Proceedings 40:610-624. 1940.
·7. Pry, L. H. Speed in tension testing and its influence on yield point values. American Society for Testing and Materials Proceedings 40:625-642. 1940.
8~ 'Austin, A. L. and R. F. Steidel, Jr. The tensile prop-erties of some engineering materials at high rates of
strain.
u. s.
Atomic Bnergr Commission Report UCRL5343 [California. Univ., L1vermore. Radiation Lab.]
9. Lubahn,
J.
D. Derivation of stress, strain, temperature,strain rate relation for plastic deformation.
Ameri-can Society of Mechanical Engineers Transactions