Open Access
Research
Importance of competing risks in the analysis of anti-epileptic drug
failure
Paula R Williamson*
1, Catrin Tudur Smith
1, Josemir W Sander
2and
Anthony G Marson
3Address: 1Centre for Medical Statistics and Health Evaluation, University of Liverpool, Liverpool, UK, 2Institute of Neurology, University College London, London, UK and 3Division of Neurological Sciences, University of Liverpool, Liverpool, UK
Email: Paula R Williamson* - [email protected]; Catrin Tudur Smith - [email protected]; Josemir W Sander - [email protected]; Anthony G Marson - [email protected]
* Corresponding author
Abstract
Background: Retention time (time to treatment failure) is a commonly used outcome in antiepileptic drug (AED) studies.
Methods: Two datasets are used to demonstrate the issues in a competing risks analysis of AEDs. First, data collection and follow-up considerations are discussed with reference to information from 15 monotherapy trials. Recommendations for improved data collection and cumulative incidence analysis are then illustrated using the SANAD trial dataset. The results are compared to the more common approach using standard survival analysis methods.
Results: A non-significant difference in overall treatment failure time between gabapentin and topiramate (logrank test statistic = 0.01, 1 degree of freedom, p-value = 0.91) masked highly significant differences in opposite directions with gabapentin resulting in fewer withdrawals due to side effects (Gray's test statistic = 11.60, 1 degree of freedom, p = 0.0007) but more due to poor seizure control (Gray's test statistic = 14.47, 1 degree of freedom, p-value = 0.0001). The significant difference in overall treatment failure time between lamotrigine and carbamazepine (logrank test statistic = 5.6, 1 degree of freedom, p-value = 0.018) was due entirely to a significant benefit of lamotrigine in terms of side effects (Gray's test statistic = 10.27, 1 degree of freedom, p = 0.001).
Conclusion: Treatment failure time can be measured reliably but care is needed to collect sufficient information on reasons for drug withdrawal to allow a competing risks analysis. Important differences between the profiles of AEDs may be missed unless appropriate statistical methods are used to fully investigate treatment failure time. Cumulative incidence analysis allows comparison of the probability of failure between two AEDs and is likely to be a more powerful approach than logrank analysis for most comparisons of standard and new anti-epileptic drugs.
Background
Patients with a new diagnosis of epilepsy are usually pre-scribed an antiepileptic drug (AED) as monotherapy [1,2].
An AED would be considered successful if the person tak-ing it becomes seizure free with few side effects. Treat-ments that cause unacceptable side effects are likely to be
Published: 29 March 2007
Trials 2007, 8:12 doi:10.1186/1745-6215-8-12
Received: 21 November 2006 Accepted: 29 March 2007
This article is available from: http://www.trialsjournal.com/content/8/1/12 © 2007 Williamson et al; licensee BioMed Central Ltd.
changed to an alternative, whilst a treatment that fails to control seizures will either be changed to an alternative, or a second drug will be added. In order to assess this meas-ure of failmeas-ure in randomised trials (RCTs) of AEDs, a pri-mary outcome recommended by the International League Against Epilepsy is retention time on AED [3], a compos-ite outcome [4,5], defined as the time from randomisa-tion to the withdrawal of the randomised AED or addirandomisa-tion of another.
Overall retention on treatment, i.e. time to treatment fail-ure for any reason, may be analysed using standard sur-vival analysis methods [6] and such analyses are common in the AED field in both studies of monotherapy [7-14] and add-on therapy [15,16]. However this approach fails to examine different reasons for treatment failure (such as inadequate seizure control or adverse events), and assumes that reasons for failure are of equal importance which may not be the case. For example the loss of a driv-ing license due to continued seizures will have differdriv-ing social and economic consequences to the more common side effects such as nausea, dizziness or rash. A situation could arise in which two AEDs are considered equivalent as a result of similar overall treatment failure when in fact the drugs have very different effects on withdrawal due to side effects and poor seizure control.
In the statistical literature, the situation where there are several reasons why an event can occur is known as 'com-peting risks'. Ignoring this aspect of an outcome by analys-ing events overall can result in misleadanalys-ing conclusions [6]. Some authors have examined separately the time to withdrawal due to side effects [16] and have censored patients whose allocated treatment is changed due to inadequate seizure control, which may give misleading results as analyses assume that the competing risks of withdrawal are independent [6]. This assumption is ques-tionable for AED treatment where there may be an associ-ation between these two causes of treatment failure. Thus a full investigation of retention time should include statis-tical methods that do not assume the competing risks of withdrawal are independent.
This paper considers the implications of competing risks of treatment failure for the design, data collection and analysis of AED studies motivated by analysis of the SANAD (Standard And New Anti-epileptic Drugs) trial [17] and drawing on our experience of datasets from our programme of individual patient data meta-analyses (IPDMA). We make recommendations for improving research practice.
Methods
Treatment failure time
The definition of treatment failure time used in this paper is the time from randomisation to the intention to with-draw the randomised drug due to lack of efficacy (poor seizure control) and/or intolerable side-effects; or the addition of other AEDs whichever is the earliest. The date of intention to withdraw rather than completion of with-drawal was chosen to reflect the point at which the treat-ment policy had been changed. Although retention time is the usual term for this outcome, a more appropriate alternative is time to treatment failure since it better reflects the event of interest. It also encompasses the situ-ation when an AED is added as a result of poor seizure control and not just treatment failures resulting in the withdrawal of the original drug. Patients who achieve a period of seizure freedom (usually 2 to 3 years) may decide to withdraw treatment, in this circumstance the withdrawal reflects a successful outcome (seizure remis-sion) rather than a treatment failure and the withdrawal is not counted as an event. Since remissions occur later in the follow-up period than withdrawals due to treatment failure, such censoring has no effect on the analysis.
Participants
Two datasets are used to demonstrate the issues in a com-peting risks analysis of AEDs. First, data collection, termi-nology and follow-up considerations are discussed with reference to information from a monotherapy meta-anal-ysis. Recommendations for improved data collection and analysis methods are then illustrated using the SANAD dataset.
Individual patient data meta-analysis dataset
Information on treatment failure time was available from 15 randomised trials [18-31] involving 3883 individuals, collected as part of a suite of individual patient data meta-analyses concerning six different AEDs [7-14].
SANAD dataset
The design and analysis of this trial have been published elsewhere [17]. For illustration here, we present the results from a competing risks analysis of the data for two pair-wise comparisons, (i) gabapentin (GBP) versus topiram-ate (TPM) and (ii) lamotrigine (LTG) versus carbamazepine (CBZ).
Design issues
only the primary reason for AED withdrawal was recorded. In others, several reasons were recorded along with order of importance. Occasionally, a further variable was recorded which indicated whether the clinician con-sidered the reason for withdrawal to be related to the AED or not.
In some trials patients may have been recorded as having withdrawn for both side effects and poor seizure control. In clinical practice, if a patient is still experiencing seizures the dose of medication is increased until either seizures are controlled or side effects occur that prevent further dose increases. In the latter case, treatment will be with-drawn because of both inadequate seizure control and side effects. Since the former is the primary reason for fail-ure, patients are classified as failures due to inadequate seizure control. Some patients will reach maximum doses without control of seizures and without significant side effects. Pragmatically, the clinician would call this inade-quate seizure control.
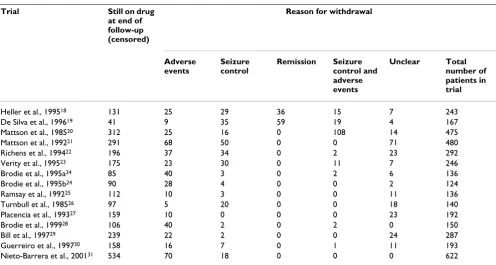
Table 1 shows that the percentage of patients for whom the reason for treatment failure was unclear varied from 0 to 15%, but as a proportion of the number of withdrawals ranged as high as 70%. Recording the reason for AED withdrawal as non-compliance is not sufficient. Non-compliance may be as a result of side effects or possibly poor seizure control. Alternatively it may be due to a rea-son unrelated to the efficacy or tolerability of the drug. Thus to classify correctly the information in both an
over-all treatment failure analysis and a competing risks analy-sis requires more information to be obtained.
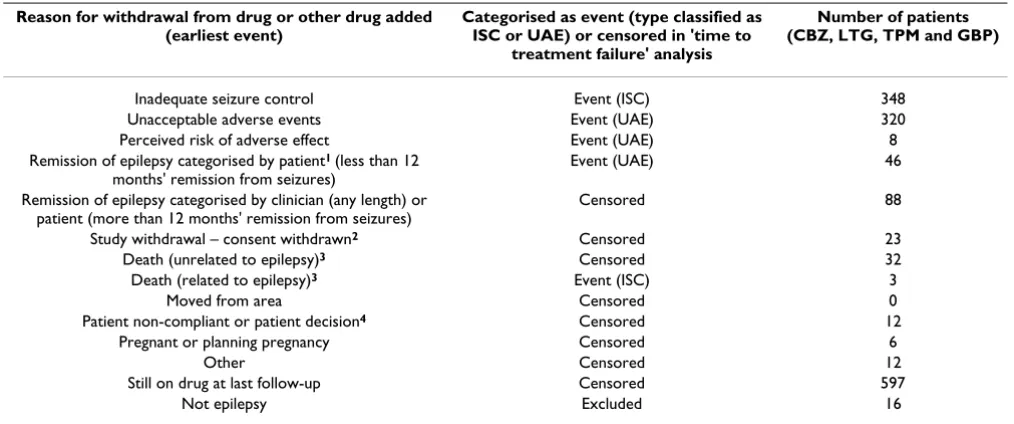
As a result of the problems identified in data collection in previous trials, extra detail regarding treatment failure rea-son was sought in the SANAD study. Table 2 shows the categories for reason for withdrawal recorded in SANAD, together with whether the withdrawal was coded as an event, and if so the reason for withdrawal (ISC or UAE), or as a censored observation in the competing risks anal-ysis of treatment failure time.
Statistical analysis
Standard survival analysis methods such as Kaplan-Meier survival curve estimation, logrank hypothesis testing and Cox regression modelling can all be applied validly to the analysis of overall treatment failure time. However Kap-lan-Meier estimates of being event free for a specific cause will be biased if the assumption that the competing risks are independent is violated. Kaplan-Meier curves are pre-sented in this paper for illustration only however they cannot be interpreted in terms of survival probabilities in the presence of dependent censoring. We describe an alternative approach, cumulative incidence analysis, which makes no such assumption and allows the assess-ment of cause-specific withdrawal in the presence of other competing risks in the Appendix.
[image:3.612.58.554.97.362.2]If all events of one type occur after the last event of another type, the standard survival analysis methods such Table 1: Classification of reasons for treatment change in 15 monotherapy trials
Trial Still on drug
at end of follow-up (censored)
Reason for withdrawal
Adverse events
Seizure control
Remission Seizure control and adverse events
Unclear Total
number of patients in trial
Heller et al., 199518 131 25 29 36 15 7 243
De Silva et al., 199619 41 9 35 59 19 4 167
Mattson et al., 198520 312 25 16 0 108 14 475
Mattson et al., 199221 291 68 50 0 0 71 480
Richens et al., 199422 196 37 34 0 2 23 292
Verity et al., 199523 175 23 30 0 11 7 246
Brodie et al., 1995a24 85 40 3 0 2 6 136
Brodie et al., 1995b24 90 28 4 0 0 2 124
Ramsay et al., 199225 112 10 3 0 0 11 136
Turnbull et al., 198526 97 5 20 0 0 18 140
Placencia et al., 199327 159 10 0 0 0 23 192
Brodie et al., 199928 106 40 2 0 2 0 150
Bill et al., 199729 239 22 2 0 0 24 287
Guerreiro et al., 199730 158 16 7 0 1 11 193
as the logrank test and the Cox model will give identical results to those obtained following the cumulative inci-dence approach. Thus as a first stage of data analysis, it is important to understand the time distribution of the var-ious causes for withdrawal.
Cumulative incidence analysis, including hypothesis test-ing, is available as part of the 'cmprsk' module [32] within the R software package. Version 2.1–5 was used for the fol-lowing analyses.
Results
Figure 1 shows how the distributions of withdrawal times due to side effects and poor seizure control in the SANAD trial overlap thus indicating the need to consider a cumu-lative incidence approach.
Figure 2 gives results for overall treatment failure for CBZ and LTG when the two causes, side effects and poor sei-zure control, are not distinguished as events. The logrank test statistic is 5.6 (1 df, p-value = 0.018) indicating LTG is better retained than CBZ. Figure 3 considers withdrawal for side effects as the only event, but censors withdrawals for poor seizure control at the time of withdrawal. The logrank test statistic is 10.4 (1 df, p-value = 0.001). There is clear evidence that LTG is better tolerated than CBZ with differences emerging very early on. Figure 4 considers withdrawal for poor seizure control as the only event, but censors withdrawals for side effects at the time of
[image:4.612.53.560.100.312.2]with-drawal. The logrank test statistic is 0.02 (1 df, p-value = 0.89) and shows LTG to be equivalent to CBZ in terms of seizure control.
Figure 5 gives results for overall treatment failure for GBP and TPM. The logrank test statistic is 0.01 (1 df, p-value =
Distribution of withdrawal times for various reasons in the SANAD trial
Figure 1
Distribution of withdrawal times for various reasons in the SANAD trial. Censored denoted by full shading, Unacceptable Adverse Event by /, Inadequate Seizure Con-trol by X.
0 500 1000 1500 2000 2500
0 20 40 60 80 100 120 140
Time to w ithdraw al (days)
F
requenc
y
Table 2: Classification of reasons for treatment change used in the SANAD trial
Reason for withdrawal from drug or other drug added (earliest event)
Categorised as event (type classified as ISC or UAE) or censored in 'time to
treatment failure' analysis
Number of patients (CBZ, LTG, TPM and GBP)
Inadequate seizure control Event (ISC) 348
Unacceptable adverse events Event (UAE) 320
Perceived risk of adverse effect Event (UAE) 8
Remission of epilepsy categorised by patient1 (less than 12 months' remission from seizures)
Event (UAE) 46
Remission of epilepsy categorised by clinician (any length) or patient (more than 12 months' remission from seizures)
Censored 88
Study withdrawal – consent withdrawn2 Censored 23
Death (unrelated to epilepsy)3 Censored 32
Death (related to epilepsy)3 Event (ISC) 3
Moved from area Censored 0
Patient non-compliant or patient decision4 Censored 12
Pregnant or planning pregnancy Censored 6
Other Censored 12
Still on drug at last follow-up Censored 597
Not epilepsy Excluded 16
1 Patients decision to withdraw before 12 months' freedom from seizures is likely to be highly influenced by side effects or perception of side effects
2 Study withdrawals are automatically checked to ensure that the patient wants to withdraw from study rather than from drug only
3 Blinded assessment to identify whether death is related or unrelated to epilepsy/AED to take place prior to analysis
4 Further information is sought if patient withdraws from drug due to "non-compliance" as the underlying reason could be unacceptable adverse
[image:4.612.317.542.491.650.2]0.91) indicating no overall difference between GBP and TPM. Figure 6 considers withdrawal for side effects as the only event, but censors withdrawals for poor seizure con-trol at the time of withdrawal. The logrank test statistic is 9.6 (1 df, p-value = 0.002). There is clear evidence that GBP is better tolerated than TPM with differences emerg-ing very early on. Figure 7 considers withdrawal for poor seizure control as the only event, but censors withdrawals for side effects at the time of withdrawal. The logrank test statistic is 9.3 (1 df, p-value = 0.002). There is clear evi-dence that TPM improves seizure control compared to GBP with differences emerging very early on.
Figures 8 and 9 show cumulative incidence plots for the two competing risks. The test statistic [32] comparing withdrawals due to side effects is 10.27 (1 df, p-value = 0.001). The test statistic comparing withdrawals due to poor seizure control is 0.78 (1 df, p-value = 0.38). The plots show the probabilities of suffering a treatment fail-ure due to an adverse event and of suffering a failfail-ure due to inadequate seizure control in the setting where compet-ing risks are acknowledged to exist. Thus at two years, for LTG the chance of withdrawal due to adverse events is 20% and of withdrawal due to inadequate seizure control is 15%, whilst for CBZ these probabilities are 30% and 13% respectively.
Kaplan-Meier distribution of time to withdrawal due to poor seizure control for carbamazepine versus lamotrigine Figure 4
Kaplan-Meier distribution of time to withdrawal due to poor seizure control for carbamazepine versus lamotrigine. Lamotrigine group denoted by triangle, car-bamazepine by square.
0 1 2 3 4 5 6
0.
0
0
.2
0.
4
0
.6
0.
8
1
.0
Time from randomisation (years)
P
robabi
li
ty
of
r
e
m
a
in
ing on dr
ug
CBZ LTG Kaplan-Meier distribution of overall treatment failure time
[image:5.612.63.290.91.299.2]for carbamazepine versus lamotrigine Figure 2
Kaplan-Meier distribution of overall treatment fail-ure time for carbamazepine versus lamotrigine. Lamotrigine group denoted by triangle, carbamazepine by square.
0 1 2 3 4 5 6
0.
0
0
.2
0.
4
0
.6
0.
8
1
.0
Time from randomisation (years)
P
robabi
li
ty
of
r
e
m
a
in
ing on dr
ug
CBZ LTG
Kaplan-Meier distribution of time to withdrawal due to side effects for carbamazepine versus lamotrigine
Figure 3
Kaplan-Meier distribution of time to withdrawal due to side effects for carbamazepine versus lamotrigine. Lamotrigine group denoted by triangle, carbamazepine by square.
0 1 2 3 4 5 6
0.
0
0
.2
0.
4
0
.6
0.
8
1
.0
Time from randomisation (years)
P
robabi
li
ty
of
r
e
m
a
in
ing on dr
ug
[image:5.612.318.550.405.651.2]Cumulative incidence curves for withdrawal due to side effects for carbamazepine versus lamotrigine
Figure 8
Cumulative incidence curves for withdrawal due to side effects for carbamazepine versus lamotrigine. Lamotrigine group denoted by triangle, carbamazepine by square.
0 1 2 3 4 5 6 7
0.
0
0
.2
0.
4
0
.6
0.
8
1
.0
Time from randomisation (years)
C
u
m
u
la
ti
v
e
I
n
ci
dence P
robabi
li
ty CBZ
LTG
Kaplan-Meier distribution of time to withdrawal due to side effects for gabapentin versus topiramate
Figure 6
Kaplan-Meier distribution of time to withdrawal due to side effects for gabapentin versus topiramate. Gabapentin group denoted by circle, topiramate by line.
0 1 2 3 4 5 6
0.
0
0
.2
0.
4
0
.6
0.
8
1
.0
Time from randomisation (years)
P
robabi
li
ty
of
r
e
m
a
in
ing on dr
ug
GBP TPM Kaplan-Meier distribution of overall treatment failure time for gabapentin versus topiramate
Figure 5
Kaplan-Meier distribution of overall treatment fail-ure time for gabapentin versus topiramate. Gabapen-tin group denoted by circle, topiramate by line.
0 1 2 3 4 5 6
0.
0
0
.2
0.
4
0
.6
0.
8
1
.0
Time from randomisation (years)
P
robabi
li
ty
of
r
e
m
a
in
ing on dr
ug
GBP TPM
Kaplan-Meier distribution of time to withdrawal due to poor seizure control for gabapentin versus topiramate
Figure 7
Kaplan-Meier distribution of time to withdrawal due to poor seizure control for gabapentin versus topira-mate. Gabapentin group denoted by circle, topiramate by line.
0 1 2 3 4 5 6
0.
0
0
.2
0.
4
0
.6
0.
8
1
.0
Time from randomisation (years)
P
robabi
li
ty
of
r
e
m
a
in
ing on dr
ug
[image:6.612.59.292.90.302.2]Figures 10 and 11 show cumulative incidence plots for the two competing risks. The test statistic [32] comparing withdrawals due to side effects is 11.60 (1 df, p-value = 0.0007). The test statistic comparing withdrawals due to poor seizure control is 14.47 (1 df, p-value = 0.0001). The cumulative incidence analysis provides stronger evidence of the advantage to GBP for side effects and TPM for sei-zure control compared to the logrank approach. The plots show the probabilities of suffering a treatment failure due to an adverse event and of suffering a failure due to inad-equate seizure control in the setting where competing risks are acknowledged to exist. Thus at two years, for GBP the chance of withdrawal due to adverse events is 19% and of withdrawal due to inadequate seizure control is 32%, whilst for TPM these probabilities are 30% and 21% respectively.
Discussion
Failure to investigate the competing risks of anti-epileptic drug withdrawal can lead to important differences in the clinical effect profiles of AEDs being missed. Thus overall treatment failure could be similar for two AEDs when the drugs have very different effects on withdrawal due to side effects and poor seizure control. For a particular patient, it is best to summarise each of these two risks for AEDs indi-vidually, as well as considering the overall risk of with-drawing for any reason. Further research is needed
Cumulative incidence curves for withdrawal due to poor sei-zure control for gabapentin versus topiramate
Figure 11
Cumulative incidence curves for withdrawal due to poor seizure control for gabapentin versus topiram-ate. Gabapentin group denoted by circle, topiramate by line.
0 1 2 3 4 5 6 7
0.
0
0
.2
0.
4
0
.6
0.
8
1
.0
Time from randomisation (years)
C
u
m
u
la
ti
v
e
I
n
ci
dence P
robabi
li
ty GBP
TPM Cumulative incidence curves for withdrawal due to poor
[image:7.612.55.294.89.304.2]sei-zure control for carbamazepine versus lamotrigine Figure 9
Cumulative incidence curves for withdrawal due to poor seizure control for carbamazepine versus lamo-trigine. Lamotrigine group denoted by triangle,
car-bamazepine by square.
0 1 2 3 4 5 6 7
0.
0
0
.2
0.
4
0
.6
0.
8
1
.0
Time from randomisation (years)
C
u
m
u
la
ti
v
e
I
n
ci
dence P
robabi
li
ty CBZ
LTG
[image:7.612.314.552.381.658.2]Cumulative incidence curves for withdrawal due to side effects for gabapentin versus topiramate
Figure 10
Cumulative incidence curves for withdrawal due to side effects for gabapentin versus topiramate. Gabap-entin group denoted by circle, topiramate by line.
0 1 2 3 4 5 6 7
0.
0
0
.2
0.
4
0
.6
0.
8
1
.0
Time from randomisation (years)
C
u
m
u
la
ti
v
e
I
n
ci
dence P
robabi
li
ty GBP
however to ascertain the relative importance of these dif-ferent outcomes to individuals with epilepsy.
Prior to analysis, the timescale for competing causes should always be investigated. Risks operating over differ-ent time periods are less of an issue for the analysis. How-ever, as demonstrated here, there is overlap of the timescale for withdrawals due to the different reasons and this is likely to be true for all AED studies.
More attention is required in the choice of statistical methods employed for the analysis of the competing risks of drug withdrawal. Cumulative incidence estimation allows appropriate inference about the probability of fail-ure of AEDs allowing for the presence of competing rea-sons for such failure. This contrasts with the inappropriate inference that is often made from one minus the Kaplan-Meier estimate for a single failure reason which can only be interpreted as a probability of failure in the hypotheti-cal situation that other failure reasons are not possible. Further, as suggested by a recent simulation study [33], the cumulative incidence approach has greater power to detect treatment differences than a logrank analysis in par-ticular circumstances. This holds true for a difference in one direction for one cause and no or an opposite differ-ence for the other cause, a situation worthy of note for anti-epileptic drug trials particularly when new and stand-ard AEDs are being compared. Although conclusions from the two methods of analysis were similar for both pairwise comparisons shown here, this will not always be the case.
The reliability of classification of the cause of drug failure must be assured before a competing risks analysis is undertaken. The analysis of overall withdrawal is safe since the information that a drug has been withdrawn is usually reliable. For a competing risks analysis however, the analyst must consider whether the classification of the reason for withdrawal is reliable. The trials reviewed in this paper varied in the level of detail collected. In partic-ular, data on the reason for withdrawal needs to be as accurate as possible for more explanatory research ques-tions such as those posed in pharmacogenetic studies.
The dataset used for illustration here contained only two patients for whom the reason for drug withdrawal was recorded as non-compliance. Censoring the outcome for these two individuals implicitly assumes that the reason for non-compliance was not related to either seizure con-trol or side effects. The results are likely to be robust to such an assumption in this example due to the low number of cases involved. However in other datasets where this reason is recorded more frequently, some sort of sensitivity analysis would be required to establish the robustness of the conclusions to this assumption. One approach would be to first code the withdrawal due to
non-compliance as an event then as a censored observa-tion and assess the robustness of the conclusions to such extreme assumptions. Of course ideally, as is the thrust of this paper, one would wish to minimise such problems through improved data collection methods.
Recommendations
The work presented here leads to the following recom-mendations for future studies which include treatment failure time as an outcome:
1) the outcome should be defined as the time to the inten-tion to withdraw the randomised AED or add in another (i.e. the point at which the treatment policy has been changed),
2) sufficient detail should be collected on the primary rea-son for drug withdrawal/addition to allow classification into one of the following categories: withdrawal due to unacceptable side effects, withdrawal due to inadequate seizure control, withdrawal due to remission, withdrawal due to a reason confirmed to be unrelated to either side effects or seizure control.
The majority of drug withdrawals occurred by one year in the SANAD dataset although two-year follow-up provides greater power since almost all drug withdrawals occurred by this time. Monotherapy studies need longer follow-up however to investigate seizure control. Studies with both treatment failure and remission outcomes should intend to follow up each patient for a minimum of one year, and ensure that a reasonable number of patients will provide longer term follow-up, particularly important for seizure outcomes. Finally, we recommend that this outcome be termed 'time to treatment failure' rather than retention time since the former better reflects the event of interest.
Authors' contributions
PRW identified the issue of competing risks in epilepsy tri-als, investigated appropriate analysis methods, directed the analyses, interpreted results and wrote the manuscript. CTS carried out the statistical analyses, interpreted results and contributed to writing the manuscript. JWS provided data for analysis, provided clinical input and commented on the manuscript. AGM provided data for analysis, pro-vided clinical input and commented on the manuscript.
Appendix
The non-parametric cause-specific hazard function for cause l is estimated by maximum likelihood via
h t d
n
l j
lj
where dlj represents the number of failures of type l at time tj and nj is the number at risk at this time. The maximum likelihood estimator of the cause-specific incidence at time tj is
Il(tj) = P(T <tj, L = l) = S(tj-1)hl(tj)
where P(T <tj, L = l) is the probability that an individual withdraws from drug due to cause l before tj and S(tj-1) denotes the overall survival function at time tj-1 i.e. the probability that an individual does not withdraw for any reason before tj-1.
The cause-specific cumulative incidence function at time t is then
where the summation is over each cause-specific event time up to time t.
Acknowledgements
The authors thank the IPDMA monotherapy trialists' group and the SANAD collaborators for providing their data.
References
1. French JA, Kanner AM, Bautista J, Abou-Khalil B, Browne T, Harden CL, Theodore WH, Bazil C, Stern J, Schachter SC, Bergen D, Hirtz D, Montouris GC, Nespeca M, Gidal B, Marks WJ Jr, Turk MR, Fischer JH, Bourgeois B, Wilner A, Faught RE Jr, Sachdeo RC, Beydoun A, Glauser TA: Efficacy and tolerability of the new antiepileptic drugs in treatment of new onset epilepsy: report of the ther-apeutics and technology assessment subcommittee and quality standards subcommittee of the American academy of neurology and the American epilepsy society. Neurology 2004, 62:1252-60.
2. National Collaborating Centre for Primary Care: The epilepsies: the diagnosis and management of the epilepsies in adults and children in primary and secondary care – NICE guideline.
London: National Institute for Clinical Excellence; 2004.
3. Commission on antiepileptic drugs: Considerations on designing clinical trials to evaluate the place of new antiepileptic drugs in the treatment of newly diagnosed and chronic patients with epilepsy. Epilepsia 1998, 39:799-803.
4. Chadwick D: Better comparisons of antiepileptic drugs: what measures of efficacy? Pharm World Sci 1997, 19:214-216. 5. Perucca E: Evaluation of drug treatment outcome in epilepsy:
a clinical perspective. Pharm World Sci 1997, 19:217-222. 6. Kalbfleisch JD, Prentice RL: The statistical analysis of failure
time data. Wiley, New York; 1980.
7. Marson AG, Williamson PR, Hutton JL, Clough HE, Chadwick DW:
Carbamazepine versus valproate monotherapy for epilepsy (Cochrane Review). In The Cochrane Library Issue 3 Oxford: Update Software; 2000.
8. Taylor S, Tudur Smith C, Williamson PR, Marson AG: Phenobarbi-tone versus phenytoin monotherapy for partial onset sei-zures and generalized onset tonic-clonic seisei-zures (Cochrane Review). In The Cochrane Library Issue 4 Oxford: Update Software; 2001.
9. Tudur Smith C, Marson AG, Williamson PR: Phenytoin versus val-proate monotherapy for partial onset seizures and general-ized onset tonic-clonic seizures (Cochrane Review). In The Cochrane Library Issue 4 Oxford: Update Software; 2001.
10. Tudur Smith C, Marson AG, Clough HE, Williamson PR: Car-bamazepine versus phenytoin monotherapy for epilepsy
(Cochrane Review). In The Cochrane Library Issue 2 Oxford: Update Software; 2002.
11. Tudur Smith C, Marson AG, Williamson PR: Carbamazepine ver-sus phenobarbitone monotherapy for epilepsy (Cochrane Review). In The Cochrane Library Issue 1 Oxford: Update Software; 2003.
12. Gamble CL, Marson AG, Williamson PR: Lamotrigine versus car-bamazepine monotherapy for epilepsy (Protocol for a Cochrane Review). In The Cochrane Library Issue 2 Oxford: Update Software; 2004.
13. Muller MM, Marson AG, Williamson PR: Oxcarbazepine versus phenytoin monotherapy for epilepsy (Protocol for a Cochrane Review). In The Cochrane Library Issue 2 Oxford: Update Software; 2004.
14. Tudur Smith C, Marson AG, Williamson PR: Valproate versus phe-nobarbitone monotherapy for epilepsy [Cochrane proto-col]. In The Cochrane Library Issue 1 Oxford: Update Software; 2004. 15. Lhatoo SD, Wong ICK, Polizzi G, Sander JWAS: Long-term reten-tion rates of lamotrigine, gabapentin, and topiramate in chronic epilepsy. Epilepsia 2000, 41:1592-1596.
16. Lhatoo SD, Wong ICK, Sander JWAS: Prognostic factors affect-ing long-term retention of topiramate in patients with chronic epilepsy. Epilepsia 2000, 41:338-341.
17. Marson AG, Al-Kharusi AM, Alwaidh M, Appleton R, Baker GA, Chadwick DW, Cramp C, Cockerell OC, Cooper PN, Doughty J, Eaton B, Gamble C, Goulding PJ, Howell SJL, Hughes A, Jackson M, Jacoby A, Kellett M, Lawson GR, Leach JP, Nicolaides P, Roberts R, Shackley P, Shen J, Smith DF, Smith PEM, Tudur Smith C, Vanoli A, Williamson PR, on behalf of the SANAD Study group: Car-bamazepine, gabapentin, lamotrigine, oxcarbazepine or topiramate for partial epilepsy: results from the SANAD trial. Lancet in press.
18. Heller AJ, Chesterman P, Elwes RD, Crawford P, Chadwick D, John-son AL, Reynolds EH: Phenobarbitone, phenytoin, car-bamazepine, or sodium valproate for newly diagnosed adult epilepsy: a randomised comparative monotherapy trial.
JNNP 1995, 58:44-50.
19. de Silva M, MacArdle B, McGowan M, Hughes E, Stewart J, Reynolds EH, Hughes E, Neville BGR, Johnson AL: Randomised compara-tive monotherapy trial of phenobarbitone, phenytoin, car-bamazepine, or sodium valproate for newly diagnosed childhood epilepsy. The Lancet 1996, 347:709-13.
20. Mattson RH, Cramer JA, Collins JF, Smith DB, Delgado-Escueta AV, Browne TR, Williamson PD, Treiman DM, McNamara JO, McCutchen CB, Homan RW, Crill WE, Lubozynski MF, Rosenthal NP, Mayersdorf A: Comparison of carbamazepine, phenobarbital, phenytoin, and primidone in partial and secondarily general-ized tonic-clonic seizures. NEJM 1985, 313:145-51.
21. Mattson RH, Cramer JA, Collins JF: A comparison of valproate with carbamazepine for the treatment of complex partial seizures and secondarily generalized tonic-clonic seizures in adults. NEJM 1992, 327:765-71.
22. Richens A, Davidson DLW, Cartlidge NEF, Easter DJ: A multicen-tre comparative trial of sodium valproate and car-bamazepine in adult onset epilepsy. JNNP 1994, 57:682-687. 23. Verity CM, Hosking G, Easter DJ: A multicentre comparative
trial of sodium valproate and carbamazepine in paediatric epilepsy. Dev Med Child Neur 1995, 37:97-108.
24. Brodie MJ, Richens A, Yuen AWC: Double-blind comparison of lamotrigine and carbamazepine in newly diagnosed epilepsy.
The Lancet 1995, 345:476-79.
25. Ramsey RE, Wilder BJ, Murphy JV, Holmes GL, Uthman B: Efficacy and safety of valproic acid versus phenytoin as sole therapy for newly diagnosed primary generalized tonic-clonic sei-zures. Epilepsy 1992, 5:55-60.
26. Turnbull DM, Howel D, Rawlins MD, Chadwick DW: Which drug for the adult epileptic patient: phenytoin or valproate? BMJ 1985, 290:815-819.
27. Placencia M, Sander JWAS, Shorvon SD, Roman M, Alarcon F, Bimos C, Cascante S: Antiepileptic drug treatment in a community health care setting in northern Ecuador: a prospective 12-month assessment. Epilepsy Res 1993, 14:237-244.
28. Brodie MJ, Overstall PW, Giorgi L: Multicentre, double-blind, randomised comparison between lamotrigine and car-bamazepine in elderly patients with newly diagnosed epi-lepsy. Epilepsy Res 1999, 37:81-87.
I tl P T t L l I tl j
j r
( )= ( < , = =) ( )
=
Publish with BioMed Central and every scientist can read your work free of charge
"BioMed Central will be the most significant development for disseminating the results of biomedical researc h in our lifetime."
Sir Paul Nurse, Cancer Research UK
Your research papers will be:
available free of charge to the entire biomedical community
peer reviewed and published immediately upon acceptance
cited in PubMed and archived on PubMed Central
yours — you keep the copyright
Submit your manuscript here:
http://www.biomedcentral.com/info/publishing_adv.asp
BioMedcentral
29. Bill PA, Vigonius U, Pohlmann H, Guerreiro CA, Kochen S, Saffer D, Moore A: A double-blind controlled clinical trial of oxcar-bazepine versus phenytoin in adults with previously untreated epilepsy. Epilepsy Res 1997, 27:195-204.
30. Guerreiro MM, Vigonius U, Pohlmann H, de Manreza ML, Fejerman N, Antoniuk SA, Moore A: A double-blind controlled trial of oxcarbazepine versus phenytoin in children and adolescents with epilepsy. Epilepsy Res 1997, 27:205-213.
31. Nieto-Barrera M, Brozmanova M, Capovilla G, Christe W, Pedersen B, Kane K, O'Neill F: A comparison of monotherapy with lamo-trigine or carbamazepine in patients with newly diagnosed partial epilepsy. Epilepsy Res 2001, 46:145-155.
32. Gray RJ: Subdistribution analysis of competing risks. Version 2.1–5. 2004 [http://www.r-project.org].