star
.
White Rose Research Online URL for this paper:
http://eprints.whiterose.ac.uk/144868/
Version: Published Version
Article:
Maxted, P.F.L., Marsh, T.R., Morales-Rueda, L. et al. (5 more authors) (2004) RX
J2130.6+4710 - an eclipsing white dwarf-M-dwarf binary star. Monthly Notices of the Royal
Astronomical Society, 355 (4). pp. 1143-1154. ISSN 0035-8711
https://doi.org/10.1111/j.1365-2966.2004.08393.x
This article has been accepted for publication in Monthly Notices of the Royal Astronomical
Society ©2004 RAS. Published by Oxford University Press on behalf of the Royal
Astronomical Society. All rights reserved.
[email protected]
https://eprints.whiterose.ac.uk/
Reuse
Items deposited in White Rose Research Online are protected by copyright, with all rights reserved unless
indicated otherwise. They may be downloaded and/or printed for private study, or other acts as permitted by
national copyright laws. The publisher or other rights holders may allow further reproduction and re-use of
the full text version. This is indicated by the licence information on the White Rose Research Online record
for the item.
Takedown
If you consider content in White Rose Research Online to be in breach of UK law, please notify us by
RX J2130.6
+
4710 – an eclipsing white dwarf–M-dwarf binary star
P. F. L. Maxted,
1,2⋆
T. R. Marsh,
3,2L. Morales-Rueda,
4,2M. A. Barstow,
5P. D. Dobbie,
5M. R. Schreiber,
6V. S. Dhillon
7and C. S. Brinkworth
21School of Chemistry & Physics, Keele University, Staffordshire ST5 5BG
2Department of Physics & Astronomy, University of Southampton, Highfield, Southampton S017 1BJ
3Department of Physics, University of Warwick, Coventry CV4 7AL
4Department of Astrophysics, Faculty of Science, University of Nijmegen, PO Box 9010, 6500 GL Nijmegen, the Netherlands
5Department of Physics & Astronomy, University of Leicester, University Road, Leicester LE1 7RH
6Observatoire de Strasbourg, Universit´e Louis Pasteur, 11 rue de l’Universit´e, 67000 Strasbourg, France
7Department of Physics and Astronomy, University of Sheffield, Sheffield S3 7RH
Accepted 2004 September 8. Received 2004 September 2; in original form 2004 July 6
A B S T R A C T
We report the detection of eclipses in the close white-dwarf–M-dwarf binary star RX J2130.6+4710. We present light curves in theB,V andI bands and fast photometry obtained with the three-channel CCD photometer Ultracam of the eclipse in theu′, g′and r′ bands. The depth of the eclipse varies from 3.0 mag in theu′ band to less than 0.1 mag in the I band. The times of mid-eclipse are given by the ephemeris BJD(mid-eclipse) = 2 452 785.681 876(2)+0.521 035 625(3)E, where figures in parentheses denote uncertainties in the final digit. We present medium-resolution spectroscopy from which we have measured the spectroscopic orbits of the M dwarf and white dwarf. We estimate that the spectral type of the M dwarf is M3.5Ve or M4Ve, although the data on which this is based are not ideal for spectral classification. We have compared the spectra of the white dwarf with synthetic spectra from pure hydrogen model atmospheres to estimate that the effective temperature of the white dwarf isTeff=18 000±1000 K. We have used the width of the primary eclipse and duration of totality measured precisely from the Ultracamu′data combined with the amplitude of the ellipsoidal effect in theIband and the semi-amplitudes of the spectroscopic orbits to derive masses and radii for the M dwarf and white dwarf. The M dwarf has a mass of 0.555± 0.023 M⊙and a radius of 0.534±0.053 R⊙, which is a typical radius for stars of this mass. The mass of the white dwarf is 0.554±0.017 M⊙ and its radius is 0.0137±0.0014 R⊙, which is the radius expected for a carbon–oxygen white dwarf of this mass and effective tem-perature. The light curves are affected by frequent flares from the M dwarf and the associated dark spots on its surface can be detected from the distortions to the light curves and radial velocities. RX J2130.6+4710 is a rare example of a pre-cataclysmic variable star that will start mass transfer at a period above the period gap for cataclysmic variables.
Key words: binaries: close – binaries: eclipsing – stars: fundamental parameters – stars:
individual: RX J2130.6+4710 – white dwarfs.
1 I N T R O D U C T I O N
RX J2130.6+4710 is a soft X-ray source that was detected in a
sur-vey of the galactic plane by theROSAT satellite (Tr¨umper 1983;
Motch et al. 1991). Motch et al. (1997) used optical spectroscopy of stars near the position of these X-ray sources to identify and classify optical counterparts in the region of the Cygnus constel-lation. RX J2130.6+4710 was identified with a faint star which
⋆E-mail: [email protected]
they labelled RX J2130.3+4709 about 12 arcsec SSE of the bright
G0 star HD 204906 (=SAO 50947, V = 8.45). The spectrum of
RX J2130.6+4710 shows the broad Balmer lines of a typical DA white dwarf together with narrow emission lines in the cores in
the Balmer lines and the CaII H and K lines. Also visible are
molecular bands of TiO from the Me-type companion star, which is also the source of the narrow emission lines. They classified RX J2130.6+4710 as a WD+Me close binary star. Motch et al. report that the radial velocities of broad Balmer lines and emission lines move in opposite directions with an orbital period of approxi-mately 12 h. The white dwarf is too cool to contribute to the X-ray
D
o
w
n
lo
a
d
e
d
fro
m
h
ttp
s:
//a
ca
d
e
mi
c.
o
u
p
.co
m/
mn
ra
s/
a
rt
icl
e
-a
b
st
ra
ct
/3
5
5
/4
/1
1
4
3
/9
9
2
3
2
7
b
y
U
n
ive
rsi
ty
o
f S
h
e
ffi
e
ld
u
se
r
o
n
1
1
A
p
ri
l 2
0
1
flux (1.6×10−2counts s−1), which probably arises from the Me star companion. The distance from the optical counterpart to the catalogued position of the X-ray source is almost exactly the same as the 90 per cent confidence radius of 26.1 arcsec in the position of the X-ray source.
It is likely that RX J2130.6+4710 is the same source as 2E 2128.4+4657, a soft X-ray source detected by the Einstein satel-lite and identified with HD 204906 by Thompson, Shelton & Arning (1998). The position of 2E 2128.4+4657 given in the Einstein Ob-servatory catalog (Harris et al. 1994) differs by 23 arcsec from the position for the optical counterpart of RX J2130.6+4710 given by Motch et al., which is comfortably within the positional uncertainty of 42 arcsec for the X-ray source. We note that RX J2130.6+4710 appears in the ‘Catalogue of cataclysmic binaries, low-mass X-ray binaries and related objects’ (Ritter & Kolb 1998) as ‘J2130+4710’. The corresponding name in the SIMBAD database (Wenger et al. 2000) is RX J2130.6+4710, which is a more accurate reflection
of the position of the optical counterpart (α=21h30m18s.6,δ =
+47◦10′08′′, J2000.0) and is the name we use throughout this
pa-per.
White dwarf stars are the remnants of stars less massive than
about 5–8 M⊙which have been through the red giant phase of their
evolution. The separation of a WD+Me binary with a period of 12 h
is 2–3 R⊙, which is much smaller than the typical size of a red giant
(∼100–1000 R⊙). This suggests that RX J2130.6+4710 is a
post-common envelope binary (PCEB). In this scenario, the expanding red giant star comes into contact with its Roche lobe and begins to transfer mass to its companion star. This mass transfer is highly unstable, so a common envelope forms around the companion and the core of the red giant. The drag on the companion orbiting inside the common envelope leads to extensive mass loss and dramatic shrinkage of the orbit (Iben & Livio 1993). Common-envelope (CE) evolution affects the evolution of many binary stars and can produce some of the most dramatic objects known, including low-mass and high-mass X-ray binaries, novae, supernovae and AM CVn binaries. However, it is a poorly understood process, so it is useful to study relatively simple PCEBs like RX J2130.6+4710 to see what they can tell us about this phenomenon.
RX J2130.6+4710 is one of a very small sample of eclipsing white dwarfs with companions that can be directly detected in the optical spectrum. These binaries offer a rare opportunity to measure the properties of low-mass stars and white dwarfs accurately. In this paper we report photometric and spectroscopic observations of RX J2130.6+4710. We have used these to measure the masses and radii of the white dwarf and the M dwarf to an accuracy of about 5 per cent. We find that the white dwarf in RX J2130.6+4710 is a typical carbon–oxygen white dwarf and that the M dwarf has a normal radius for its mass.
2 O B S E RVAT I O N S A N D R E D U C T I O N S
2.1 Photometry
We first observed RX J2130.6+4710 using the 1-m Jacobus Kapteyn telescope (JKT) on the Island of La Palma. We obtained 478 images
with anI-band filter and 520 images with aV-band filter using a TEK
charge coupled device (CCD) during the interval 1998 August 5–9.
The exposure times were 1.5–3 s for theI-band images and 1.5–5 s
for theV-band images. The image scale on the CCD was 0.33 arcsec
[image:3.612.374.496.111.182.2]per pixel. Our intention was to confirm the orbital period of the binary from the sinusoidal reflection effect due to the irradiation of one side of the M dwarf by the white dwarf. We were delighted to
Table 1. Exposure times, Texp, for observations of RX J2130.6+4710 obtained with the JKT.Nis the num-ber of useful images obtained.
Filter N Texp(s)
U 6 120
B 1002 6.5–60
V 536 30
R 6 20
I 581 30
find that theV-band images show an eclipse 0.6-mag deep lasting
about 30 m occurring at about 0030UT 1998 August 10. TheI-band
images show an eclipse about 0.1-mag deep at the same time. This is exactly what would be expected for the eclipse of a white dwarf
by an M dwarf with a similar luminosity in theVband.
We obtained further photometry of RX J2130.6+4710 with the JKT during the interval 2000 August 16–22 using an SITe CCD, which gives the same image scale as the TEK CCD. Images were
obtained using HarrisUBVRIfilters. The number of images secured
with each filter and the exposure times are given in Table 1. The shorter exposures with the B filter were used for observations during eclipses of RX J2130.6+4710.
Primary eclipses of RX J2130.6+4710 were observed with ULTRACAM and the WHT on the nights of 2002 May 17, 2003 May 24 and 2003 May 25. Attempts to observe the secondary eclipse on 2002 May 19 and 2003 November 13 were compromised by poor seeing and flaring of the M dwarf. We have subsequently discov-ered that the secondary eclipse is likely to be extremely shallow (see later) so we do not discuss these observations further in this paper. ULTRACAM is an ultrafast, triple-beam CCD camera. The light
is split into three wavelength colours (u′,g′andr′ ori′) by two
dichroic beam-splitters and then passes through a filter. The de-tectors are three back-illuminated, thinned, Marconi frame-transfer
1024×1024 active area CCD chips with a pixel scale of 0.3
arc-sec pixel−1. ULTRACAM employs frame transfer CCDs so that the
dead time between exposures is negligible (24 msec). Signals from Global Position System (GPS) satellites were used to ensure that the time-stamp for each image is accurate to 1 msec (for further details, see Dhillon & Marsh 2001).
We reduced the data using normal extraction from fixed apertures and also Naylor (1998) optimal extraction from apertures varied in step with the seeing. In the latter case we used aperture radii 1.5 times the full-width at half maximum of the image of RX J2130.6+4710. RX J2130.6+4710 is located only 12 arcsec away from a much brighter G0 star so the photometry can be badly affected in poor seeing. To estimate and correct for the extent of this we placed an aperture on the sky at the same distance from the bright star as RX J2130.6+4710 and symmetrically located with respect to the diffraction spikes from this star.
The bias level in the JKT images was determined from the over-scan regions and was subtracted from the image before further pro-cessing. Images of the twilight sky devoid of any bright stars were used to determine flat-field corrections by forming the median image of 3–5 twilight sky images in each filter, one for each night’s data. We used optimal photometry (Naylor 1998) to determine instrumen-tal magnitudes of the stars in each frame. We checked for variability in the stars other than the target star in each frame before calculating differential magnitudes between RX J2130.6+4710 and a
compar-ison star located atα=21h30m19s.7,δ= +47◦10′26′′(J2000.0).
The mean differential magnitudes in the sense (RX J2130.6+4710
D
o
w
n
lo
a
d
e
d
fro
m
h
ttp
s:
//a
ca
d
e
mi
c.
o
u
p
.co
m/
mn
ra
s/
a
rt
icl
e
-a
b
st
ra
ct
/3
5
5
/4
/1
1
4
3
/9
9
2
3
2
7
b
y
U
n
ive
rsi
ty
o
f S
h
e
ffi
e
ld
u
se
r
o
n
1
1
A
p
ri
l 2
0
1
Table 2. Apparent magnitudes of RX J2130.6+4710.
U B V R I J H Ks
14.8 14.9 14.3 13.70 12.2 11.21 10.58 10.36
−comparison) in theB,VandIbands when RX J2130.6+4710 is
not in eclipse are−0.74, 0.29 and 0.21, respectively.
We used an aperture with a radius of five pixels to measure the instrumental magnitude of RX J2130.6+4710 and the five standard
stars in the field of PG 1633+099 withUBVRImagnitudes given
by Landolt (1992). We used these to calculate the apparent magni-tudes for RX J2130.6+4710 given in Table 2. The calibration of our photometry is approximate because the proximity of HD 204906 to RX J2130.6+4710 makes it difficult to measure reliable fluxes. For this reason we only quote one decimal place for our apparent magnitude values. Also given in Table 2 are the infrared apparent magnitudes for RX J2130.6+4710 taken from Hoard et al. (2002).
2.2 Spectroscopy
We observed RX J2130.6+4710 with the 2.5-m Isaac Newton Tele-scope (INT), also on the island of La Palma, using the IDS spectro-graph simultaneously with our JKT observations in 2000 August. Most of our observations were obtained using a narrow slit (0.9–
1 arcsec) and a 1200 line mm−1 grating on the 235-mm camera
with an EEV CCD. The spectra cover the wavelength region 3850– 5500 Å at a resolution of about 1.2 Å and the dispersion is about 0.48 Å per pixel. A typical spectrum is shown in Fig. 1. The exposure times were 1200 s and we obtained arc lamp spectra approximately
Figure 1. Left panel: from bottom to top – spectrum of RX J2130.6+4710 taken at mid-eclipse, LFT 1580 (M0.5), LFT 1751 (M1.5), LFT 1466 (M2.5), LFT 93 (M3), mean of four spectra of RX J2130.6+4710 taken near phase 0.75. The spectra have been normalized at 5100 Å and offset by 1 for clarity. Right panel: from bottom to top – mean spectrum of RX J2130.6+4710 taken at mid-eclipse, LFT 1278 (M1), LFT 1436 (M1.5), LFT 1580 (M2), LFT 1751 (M2.5), LFT 1466 (M3), LFT 98 (M3.5), LFT 1431 (M4).
once per hour to establish the wavelength scale and monitor the spec-trograph drift. We also observed one eclipse of RX J2130.6+4710
with the same instrument but with a 300 line mm−1grating and a
4-arcsec wide slit orientated to include the same comparison star used for the JKT photometry. The exposure times were 10 s and there was a 4-s delay between exposures to read out the CCD. The spectra cover the wavelength range 4215–6795 Å at a dispersion of 3.7 Å per pixel.
Extraction of the narrow-slit spectra from the images was per-formed automatically using optimal extraction to maximize the signal-to-noise of the resulting spectra (Marsh 1989). The arcs as-sociated with each stellar spectrum were extracted using the same weighting determined for the stellar image to avoid possible sys-tematic errors due to the tilt of the spectra on the detector. The wavelength scale was determined from a fourth-order polynomial fit to measured arc line positions. The standard deviation of the fit
to the 18 arc lines was typically 1/20 of a pixel. The wavelength
scale for an individual spectrum was determined by interpolation to the time of mid-exposure from the fits to arcs taken before and after the spectrum to account for the small amount of drift in the
wavelength scale (<0.1 Å) due to flexure of the instrument between
arc spectra. We used a spectrum of BD+33 2642 obtained during the same observing run and the tabulated fluxes of Oke (1990) to de-termine the calibration of counts-to-flux as a function of wavelength in our spectra. No correction for slit losses was attempted but we did correct the spectra for atmospheric extinction. Statistical errors on every data point calculated from photon statistics are rigorously propagated through every stage of the data reduction.
To extract the spectrophotometry taken with a wide slit we summed the measured counts over six spatial pixels centred on the
D
o
w
n
lo
a
d
e
d
fro
m
h
ttp
s:
//a
ca
d
e
mi
c.
o
u
p
.co
m/
mn
ra
s/
a
rt
icl
e
-a
b
st
ra
ct
/3
5
5
/4
/1
1
4
3
/9
9
2
3
2
7
b
y
U
n
ive
rsi
ty
o
f S
h
e
ffi
e
ld
u
se
r
o
n
1
1
A
p
ri
l 2
0
1
0 0.2 0.4 0.6 0.8 1 1.2
0.94 0.95 0.96 0.97 0.98 0.99 1 1.01 1.02 1.03 1.04
Nor
maliz
ed flux
[image:5.612.54.293.66.234.2]Orbital phase
Figure 2. The light curve of RX J2130.6+4710 in theu′band (+) and the least-squares fit for the eclipse of uniform circular discs assumingi=80◦.5
(solid line, barely visible).
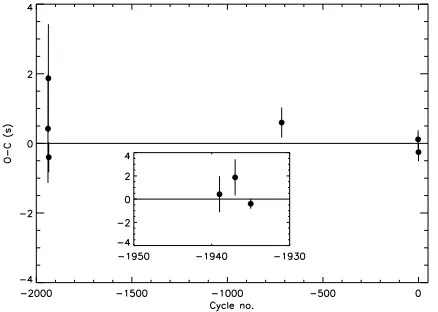
Figure 3. Residuals from a linear ephemeris for our measured times of mid-eclipse.
spectrum at every wavelength step for both RX J2130.6+4710 and the comparison star after subtracting the sky contribution estimated from a linear fit to the regions either side of the spectra. The wave-length calibration was determined from a single arc spectrum taken at the start of the night and is accurate to about 1 Å.
2.3 Timing of INT and JKT data
We warn the reader here that we have not been able to establish whether the time-stamps for the data obtained with the INT and JKT are reliable. It is probable that the time-stamps for these data have an accuracy of better than 1 s. However, the observatory staff have noted that time-stamps on data such as these can be in error by a few seconds.
3 A N A LY S I S
3.1 The ephemeris
We measured the time of mid-eclipse from our photometry using a least-squares fit of a very simple light-curve model. The model is based on the eclipse of one circular disc with uniform surface brightness by another similar disc. The parameters of the model are
the radii of the discs relative to their maximum separation,r1 and
r2; the inclination of the orbit,i; the orbital period,P, and time of
primary eclipse, T0; the luminosity ratio,lλ; the observed
inten-Table 3. Times of mid-eclipse for RX J2130.6+4710.
BJD(mid-eclipse) Cycle Source
245 1775.393803±0.000018 −1939 JKTa 245 1776.435891±0.000018 −1937 JKTa 245 1777.477936±0.000005 −1935 INTa 245 2412.620375±0.000005 −716 Ultracam 245 2784.639806±0.000003 −2 Ultracam
245 2785.681873±0.000003 0 Ultracam
aThese data are not suitable for long-term period studies.
sity outside of eclipse,I0, and the mass ratio,q. We also include a
parameter to allow for a linear variation of the observed intensity with time. As we were only interested in the time of mid-eclipse,
we fixed the parametersq=1,i=90◦,P=0.52104 d and found
the optimum values of the other parameters using the Levenberg– Marquardt method (Press et al. 1992). We fitted data covering each eclipse we had observed separately. The quality of the fits judged by
eye and from the value ofχ2was very good (Fig. 2). The results are
shown in Table 3. Corrections from UTC to Barycentric Julian date
(BJD) were calculated using routines from SLALIBv. 2.4–5(Wallace
2000). The times of mid-eclipse labelled ‘JKT’ are fromB-band
photometry taken with the JKT with uncertainties derived from the covariance matrix of the least-squares fit. The light curve for the time of mid-eclipse labelled ‘INT’ was produced by summing the total counts over the wavelengths 4215–6796 Å in our low-resolution spectra of RX J2130.6+4710 and the comparison then taking the ratio of these time-series. The uncertainty was also taken from the covariance matrix of the least-squares fit. The times of minimum labelled ‘Ultracam’ are the weighted averages of the values derived
by fitting theu′, g′ andi′ light curves observed with Ultracam.
There is an obvious flare during the eclipse observed on 2002 May
17 so we have excluded data in the range JD= 245 2412.632 to
245 2412.635 from the least-squares fit. The uncertainties for these values are taken from the standard deviation of the three measure-ments. The measurements from the three light curves are consistent with the individual uncertainties taken from the covariance matrix of the least-squares fit. We re-iterate our warning here that timing of the data taken with the INT and JKT presented here may be in error
by a few seconds, sothese data should not be used to study the
long-term period changes.
A least-squares fit to these data gives the following linear ephemeris:
BJD(Mid-eclipse)=(245 2785.681 876±0.000 002)
+(0.521 035 625±0.000 000 003)E.
All phases quoted in this paper have been calculated with this ephemeris. Residuals from this ephemeris for our eclipse timings are shown in Fig. 3.
3.2 Spectral type of the M dwarf
One of our blue narrow-slit spectra was taken during a total eclipse of RX J2130.6+4710 so it only contains light from the M dwarf. This spectrum is compared with spectra of K and M dwarfs taken with the same instrument and setup in Fig. 1. Also shown in Fig. 1 is the average of our wide-slit spectra taken during eclipse compared with spectra of M dwarfs observed with the same instrument and setup. Spectral types for the M dwarfs were taken from Reid, Hawley & Gizis (1995) or Hawley, Gizis & Reid (1996). We estimate that the spectral type of the M dwarf in RX J2130.6+4710 is M3.5 or
D
o
w
n
lo
a
d
e
d
fro
m
h
ttp
s:
//a
ca
d
e
mi
c.
o
u
p
.co
m/
mn
ra
s/
a
rt
icl
e
-a
b
st
ra
ct
/3
5
5
/4
/1
1
4
3
/9
9
2
3
2
7
b
y
U
n
ive
rsi
ty
o
f S
h
e
ffi
e
ld
u
se
r
o
n
1
1
A
p
ri
l 2
0
1
[image:5.612.315.556.80.162.2] [image:5.612.65.284.279.435.2]M4, based principally on the strength of the TiO bands at 5448, 5847 and 6158 Å and the CaOH band at 5500–5560 Å (Jaschek & Jaschek 1987). The spectra we have used for classification do not cover the TiO bands further to the red, which are more commonly used for spectral classification, and we have used only a few stars that are not standards for the comparison so the uncertainty in the classification is likely to be at least one sub-type.
3.3 Spectroscopic orbit of the M dwarf
We used cross-correlation to measure the radial velocity of the M dwarf from the INT spectra taken in 2000 August. We first removed
the contribution of the broad wings of the Hβand Hγlines from the
white dwarf by using two Gaussian profiles to model each line. The sum of these broad Gaussian profiles and a low-order polynomial was fitted to each spectrum by least squares and then subtracted from the spectrum prior to performing the cross-correlation.
We used spectra of four different M dwarfs taken with the same instrumental setup as templates for the cross-correlation after nor-malization using a low-order polynomial fit by least-squares. The spectra were re-binned on to a uniform wavelength grid of 1835
pixels of 32 km s−1each centred on 4600 Å. The cross-correlation
function was calculated excluding 10 Å around the two Balmer lines, which are affected by the emission lines from the cool star and the core of the spectral lines from the white dwarf. The radial veloc-ity and its uncertainty were measured from the cross-correlation function using the method of Schneider & Young (1980) – which, briefly, determines the centroid of the CCF weighted in this case by a Gaussian function with a full width at half maximum (FWHM) of
200 km s−1.
We used a least-squares fit to the measured radial velocities,Vr,
of the functionVr =γM + KMsin [2π(T −T0)/P] to measure
the semi-amplitude of the spectroscopic orbit for the M star,KM.
The values ofT0 and the orbital period,P, were fixed using the
ephemeris described in Section 3.1. From inspection of the residuals from these fits it was clear that there was some distortion to the radial
velocities with an amplitude of a few km s−1. The residuals tended
to be positive over the phases (T −T0)/P=0.2–0.4 and negative
over the phases 0.4–0.6. We suspect that this distortion is due to a dark spot on the M dwarf. We do not believe this distortion is a direct consequence of the irradiation of the M dwarf by the white dwarf because such a distortion would be symmetrical around phase 0.5.
To model this distortion we add the termAsin [(φ−φ0)/ρ] to data
in the phase rangeφ0< φ < φ0+ρ, whereφ=2π(T −T0)/P.
[image:6.612.127.486.626.740.2]There may be a similar distortion near phase 0.9, but the data near this phase range is rather sparse so we have decided not to use a more complicated function to fit these data. The physical origin of
Table 4. Results of least-squares fits of a sine wave plus a distortion to the measured radial velocities of the M dwarf in RX J2130.6+4710.
Template Vtemp γM KM A φ0 ρ σsys σ
(Sp. type) (km s−1) (km s−1) (km s−1) (km s−1) (km s−1) (km s−1)
LFT 1580 −17.161 15.6 135.7 2.9 0.18 0.42 3.4 4.5
(M0.5) ±0.7 ±0.7 ±0.8 ±0.04 ±0.07
LFT 1751 −27.317 15.5 136.4 2.9 0.20 0.40 3.8 4.7
(M1.5) ±0.7 ±0.7 ±0.9 ±0.03 ±0.06
LFT 1466 35.880 16.1 136.7 2.8 0.23 0.37 3.9 4.8
(M2.5) ±0.7 ±0.7 ±0.9 ±0.04 ±0.07
LFT 93 1.500 13.9 136.7 2.8 0.21 0.38 4.0 4.8
(M3) ±0.7 ±0.7 ±0.9 ±0.04 ±0.06
this distortion is a dark spot crossing the observer’s meridian on the
visible disc of the M dwarf at phaseφmid. The velocity of the spot
will vary as sin(φ−φmid) and, since the inclination of the system
is approximately 90◦ its visibility will vary approximately as cos
(φ−φmid). The combination of these effects yields a distortion of
the form sin(φ−φmid) cos(φ−φmid)=sin [2(φ−φmid)]. The effect
of limb darkening will be to reduce the time-scale of the variation whereas the finite size of the spot tends to increase the time-scale of the distortion, so that the velocity distortion is approximately
Bsin [(φ−φmid)/ρ] withρ≈0.5. Note thatφmid=φ0+ρ/2 so
A= −B.
The value ofχ2for these least-squares fits was still rather large.
We therefore added an ‘external error’,σsys, in quadrature to the
standard errors of the radial velocity measurements to account for additional sources of uncertainty. These might be instrumental, e.g. motion of the star in the slit, or intrinsic to the M dwarf, e.g. weak emission lines, or spectral features associated with chromospheric activity such as flares or dark spots in the photosphere. The value of
σsyswas chosen to obtain a reducedχ2value of 1.
The results of the least-squares fit of the sine wave+distortion
are given in Table 4. Results are given for each of the templates
used for cross-correlation as listed in column 1. The value ofγM
has been corrected for the measured radial velocity of the template,
Vtemp, taken from Nidever et al. (2002). The spectral type of the
template taken from Reid et al. (1995) or Hawley et al. (1996) is
also given. The standard deviation of the residuals,σis given in the
final column. An example of the measured radial velocities and the function fitted by least-squares is shown in Fig. 4.
We adopt the weighted mean values from Table 4 ofγM=15.3±
0.7 km s−1and
KM=136.4±0.8 km s−1. The uncertainties are the
standard deviations of the four measurements with a small additional
uncertainty inKMto allow for the partial correlation ofKMwithA.
These values are both about 1.5 km s−1lower than that obtained by
fitting a simple sine wave to the data.
3.4 Spectroscopic orbit of the white dwarf
The measurement of the radial velocities for the white dwarf in RX J2130.6+4710 was difficult because there are only three spec-tral lines available to us which show a sufficiently sharp core to give reliable measurements. These spectral regions all show many sharp absorption lines and a strong, variable emission line from the M dwarf. Fortunately, we have a spectrum of the M dwarf alone obtained during an eclipse of the white dwarf. We are able to re-move much of the contribution of the M dwarf by subtracting this spectrum from the others. To do this, we first shift the wavelength scale of all the spectra to remove the orbital motion of the M dwarf
D
o
w
n
lo
a
d
e
d
fro
m
h
ttp
s:
//a
ca
d
e
mi
c.
o
u
p
.co
m/
mn
ra
s/
a
rt
icl
e
-a
b
st
ra
ct
/3
5
5
/4
/1
1
4
3
/9
9
2
3
2
7
b
y
U
n
ive
rsi
ty
o
f S
h
e
ffi
e
ld
u
se
r
o
n
1
1
A
p
ri
l 2
0
1
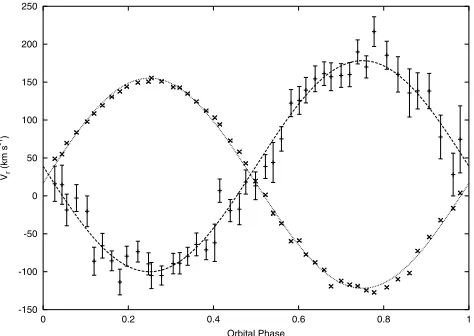
Figure 4. Radial velocities for the M star in RXJ 2130.3+4709 measured by cross-correlation using the spectrum of LFT 1536. The upper panel shows the least-squares fit to the velocities described in the text (sine wave +
distortion). The lower panel shows the residuals from the sine wave fit and the function fit by least-squares that is used to model the distortion.
according to the orbit derived in Section 3.3. The spectra were nor-malized by a constant value determined from the mean flux in the line wings. We interpolated the spectra on to three wavelength grids
centred on each of the Balmer lines of 120 pixel of 32 km s−1each.
We then formed the average of spectra in groups taken at the same orbital phase to within 0.02 phase units.
We then subtracted from these 47 phase-binned spectra the spec-trum obtained in eclipse scaled by some factor so as to optimize the removal of the sharp absorption features. This was done indepen-dently for each Balmer line as the optimum factor varies strongly
with wavelength. For the Hδline we found that the spectrum
ob-tained in eclipse was too noisy, so we used the combined spectrum of the M3 and M3.5 dwarfs LFT 1431 and LFT 1432 instead, which looked very similar but was much less noisy. The resulting spectra show a strong absorption line near the line centre and the broad lines of the white dwarf with a weak core whose position varies
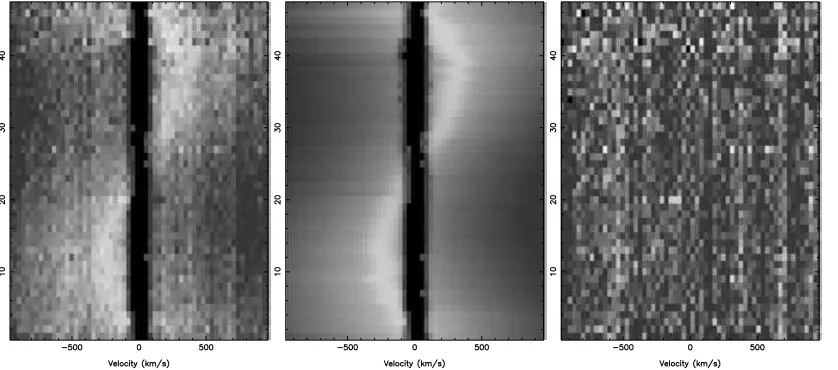
Figure 5. Trailed grey-scale spectra of the Hβline in RX J2130.6+4710. Left to right: observed, phase binned spectra after subtraction of the M-dwarf spectrum; least-squares fit; residuals from the fit. For the spectra, white is an intensity value of 0.5, black is 1.0. For the residuals, the intensity scale is−0.1 to
+0.1 from white to black.
sinusoidally with phase. In addition, some spectra show weak emis-sion lines from the M dwarf away from the line centre (Fig. 5) and the stronger central emission line from the M dwarf, which is not entirely removed by the subtraction process.
To measure the radial velocity of the white dwarf from these spectra, we created a model line profile for the white dwarf from the sum of three Gaussian profiles with the same mean but inde-pendent widths and depths. We then used least-squares fitting to the phase-binned spectra to determine the widths and depths of these Gaussians. Other parameters in the fit were the coefficients of a lin-ear polynomial used to model the continuum and the width, height and position of a Gaussian used to model the emission line from the M dwarf. Finding the optimum parameters for the Gaussians and the best scaling factor for the M dwarf took much experimentation,
but the quality of the fits achieved judged by theχ2value and by eye
is good. For the measured radial velocities reported here, we fixed the widths and depths of the Gaussians used to model the white dwarf spectrum to be the same for all the spectra. We then repeated least-squares fitting to find the radial velocity of the white dwarf and the other free parameters of the fit. We also corrected for the shift applied to the spectra to correct them for the orbital motion
of the M dwarf. The phase-binned spectra around the Hβline, the
model spectra and the residuals from the fit are shown in Fig. 5.
Two phase-binned spectra of Hβobserved near quadrature and the
model spectra are also plotted in Fig. 6.
We used a least-squares fit to the measured radial velocities,Vr,
of the functionVr=γWD−KWDsin [2π(T −T0)/P] to measure
the semi-amplitude of the spectroscopic orbit for the white dwarf,
KWD. The values ofT0 and the orbital period,P, were fixed
us-ing the ephemeris derived in Section 3.1. Note thatγWD=γMfor
three reasons: (i) the gravitational redshift of light from the white
dwarf,z=0.635(M/M⊙)/(R/R⊙) km s−1≈25 km s−1; (ii) the
Stark effect is asymmetrical for the higher Balmer lines resulting in pressure shifts (Grabowski, Halenka & Madej 1987); (iii) a tilt in
the continuum will result in a systematic error in the value ofγWD
measured from such broad lines. The resulting fit for theHβline
is shown in Fig. 7. Also shown are the radial velocities measured for the emission line, which are a by-product of the analysis. The
values ofγWDandKWDmeasured from each Balmer line are given
in Table 5. The agreement between the values ofKWDmeasured
D
o
w
n
lo
a
d
e
d
fro
m
h
ttp
s:
//a
ca
d
e
mi
c.
o
u
p
.co
m/
mn
ra
s/
a
rt
icl
e
-a
b
st
ra
ct
/3
5
5
/4
/1
1
4
3
/9
9
2
3
2
7
b
y
U
n
ive
rsi
ty
o
f S
h
e
ffi
e
ld
u
se
r
o
n
1
1
A
p
ri
l 2
0
1
[image:7.612.99.518.513.698.2]Figure 6. Examples of multiple Gaussian least-squares fits to the Hβline. Two spectra of RX J2130.6+4710 which have had the M-star spectrum sub-tracted offset by 0.4 units are shown (thin line) together with the model spectra (thick line).
-150 -100 -50 0 50 100 150 200 250
0 0.2 0.4 0.6 0.8 1 Vr
(km s
-1)
[image:8.612.316.558.80.190.2]Orbital Phase
Figure 7. Radial velocities of the white dwarf (+) and the emission line from the M dwarf (×) measured from the Hβline. Sinusoidal least-square fits are shown as solid lines.
Table 5. Results of least-squares fits of a sine wave to the measured radial velocities of the white dwarf in RX J2130.6+4710.
Spectral γWD KWD χ2 σ
line (km s−1) (km s−1) (n=47) (km s−1)
Hβ 39.2±2.6 139.2±3.4 43.0 17.9
Hγ 58.4±2.7 133.9±3.8 43.1 21.4
Hδ 51.7±2.9 135.5±4.1 52.7 22.3
from the three lines is remarkably good, but we suspect this is a fluke. These values are certainly affected by systematic errors due to inaccurate subtraction of the M-dwarf spectrum, variable tilts in the spectrum and weak emission lines from the M dwarf. Therefore, we should not take the error in the weighted mean as a measure of the uncertainty. Instead we use the standard deviation of the values
[image:8.612.59.296.312.480.2]and adopt the valueKWD=136.5±3.8 km s−1.
Table 6. The combined spectroscopic orbit of RX J2130.6+4710.
Parameter Value Notes
T0 BJD 2 452 785.681876 See Section 3.1
P 0.521 035 625 d See Section 3.1
γWD 40 km s−1 Uncertain
KWD 136.5±3.8 km s−1
γM 15.3±0.7 km s−1 KM 136.4±0.8 km s−1
q=mM/mWD 1.00±0.03
mWDsin3i 0.548±0.016 M ⊙ mMsin3i 0.549±0.022 M
⊙ asini 2.81±0.04 R⊙
3.5 The combined spectroscopic orbit
From the adopted value ofP,KMandKWDwe use Kepler’s Law to
derive the minimum masses,mMsin3iandmWDsin3i, the mass ratio
q=mM/mWD, and projected semi-major axisasini, wheremMis
the mass of the M dwarf,mWDis the mass of the white dwarf andi
is the orbital inclination. The values derived and their uncertainties
are given in Table 6. We have taken the value ofγWDderived from
the Hβline as we believe this to be the least affected but systematic
errors.
3.6 The light curve
The light curve of RX J2130.6+4710 shows that the white dwarf is eclipsed for 27 min 30 s and that the ingress and egress phases of the eclipse lasted for 1 min 50 s. The depth of the eclipse varies from 3.0
mag in theu′band to less than 0.1 mag in theIband (Fig. 8). There
is no secondary eclipse apparent in our data, which is unsurprising given that it is expected to be less than 1 milli-magnitude deep. It is also noticeable that the amplitude of the reflection effect is rather small, i.e. the light curves are almost flat outside the eclipse.
For a given inclination,i, a single eclipse will give an accurate
measurement of the radii of the stars relative to their separation, i.e.
rWD= RWD/aandrM= RM/a, whereais the separation of the
stars andRWD,RMare the radii of the white dwarf and the M dwarf,
respectively. Additionally, the depth of the eclipse gives an accurate
measurement of the luminosity ratio,lλ, at the effective wavelength
of the light curve,λ. Equally good fits to the eclipse can be found
for a wide range ofivalues. The shape of the M dwarf is accurately
determined by an equipotential surface in the Roche potential, which is slightly non-spherical. This gives rise to an ellipsoidal effect with
an amplitude of about 2 per cent in the I-band light curve. The
amplitude of the ellipsoidal effect varies strongly withrMand the
predicted value ofrMincreases asidecreases, so we have enough
information in theu′-band andI-band light curves to measurerWD,
rMandi.
We first measured the values ofrWD andrMas a function ofi
from theu′-band light curve using the simple model of uniform
circular discs described in Section 3.1. We included data obtained on the nights of 2002 May 24 and 2002 May 25 in the fit after first normalizing the data using a straight-line fit to the data outside of eclipse. The results are plotted in Fig. 9. We used the slightly more
advanced light-curve modelEBOP(Nelson & Davis 1972; Popper &
Etzel 1981) to investigate the effect of limb-darkening on the values
ofrWDandrMderived; we found that these radii change by less than
0.1 per cent if limb-darkening is included in the model.
We used a simple model to calculate the semi-amplitude of the
ellipsoidal effect in the I-band light curve, I. The model
cre-ates a grid of points over an equipotential surface in the Roche potential. The observed flux as a function of phase is then calculated
D
o
w
n
lo
a
d
e
d
fro
m
h
ttp
s:
//a
ca
d
e
mi
c.
o
u
p
.co
m/
mn
ra
s/
a
rt
icl
e
-a
b
st
ra
ct
/3
5
5
/4
/1
1
4
3
/9
9
2
3
2
7
b
y
U
n
ive
rsi
ty
o
f S
h
e
ffi
e
ld
u
se
r
o
n
1
1
A
p
ri
l 2
0
1
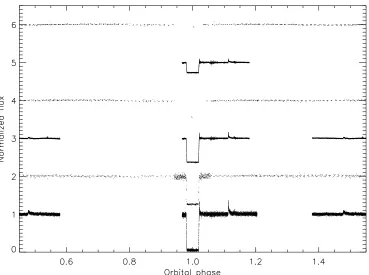
[image:8.612.55.295.567.633.2]Figure 8. The light curves of RX J2130.6+4710 with the following filters (bottom to top);u′,B,g′,V,r′andI. The light curves have been normalized to the mean out-of-eclipse values and offset by 1.0 for clarity. The data for theu′,g′andr′filters around the primary eclipse were obtained on the night of 2002 May 17 and clearly show two flares. Data at other phases for theu′andg′bands were taken in poor seeing conditions on the night of 2003 November 13 and also shows two flares.
by numerical integration of the apparent surface brightness over the points visible at each phase. The apparent surface brightness over the star includes the effects of gravity darkening and limb-darkening.
We calculated the value ofI as a function ofifor linear
limb-darkening coefficients of 0.63 and 0.72, which covers the range of values given in the tabulations of Claret (2000) for model stellar
atmospheres withTeff=3500 K. The gravity darkening exponent
was fixed at its standard value of 0.08. The effect of gravity dark-ening is to make the light curve slightly fainter at phase 0 than
phase 0.5. To calculateI we used the semi-amplitude calculated
from the flux at phase 0.5 because the data at phase 0 are affected by the eclipse of the white dwarf, although the difference is very small for the amplitudes we are dealing with in this case. We also ignore the effect of the light from the white dwarf when we
calcu-lateI, so a small correction for this contribution to the flux has
to be made before comparing the predicted and observed values of
I. The predicted values of I as a function ofiare shown in
Fig. 9.
The measurementI is complicated by the asymmetry of the
I-band light curve, e.g. the minimum of the light curve does not
occur at phase 0.5. We assume that this is due to the presence of spots on the surface of the M dwarf. This is not an unreasonable assumption given that this is a rapidly rotating M dwarf that is known to show flares (Fig. 8). To model the effect of these spots on the light curve, we assumed that there are two spots that cause dips in the
light curve described by the functionsAj[1+cos(φ−φj)]/2,j=1,
2, which are restricted to orbital phasesφj±π/2. We modelled the
ellipsoidal effect with the function−Icos(2φ) and also included a
component for the reflection effect using the function−Arefcos(φ).
We first formed the average of the observations in phase bins 0.02 wide and calculated the standard deviation of the mean of the data in
each bin. We then subtracted a constant to remove the contribution of the white dwarf to the measured flux and renormalized the data by its mean. The value of the constant is determined from the mean value of the observed flux during eclipse.
We then performed a weighted least-squares fit of the sum of the functions described above plus a constant to the phase-binned data excluding the data in eclipse to find optimum values of the
parametersA1,A2,φ1,φ2,I,Arefand the constant. The resulting
fit and the phase-binned data are shown in Fig. 10. With so many parameters, there will clearly be many solutions that give a good fit.
In this case we are interested in finding the likely range ofIvalues
that are reasonable given the observed light curve. To find the value
ofIwe attempted to fit theI-band light curve with the dips due to
the spots centred near phases 0.4 and 0.9 so as to remove as much of the variability as possible using the spots alone. The parameters for this fit are shown in Table 7.
The I-band data and the radial velocity data for the M dwarf
discussed in Section 3.3 were obtained simultaneously so the pa-rameters for the dark spots we infer by modelling distortions to the light curve and radial velocity curve should be consistent. This is indeed the case for the phase of the distortion of the proposed spot
withφ1 ≈0.4, which is also responsible for the distortion to the
radial velocity curve withφ0≈0.2 sinceφ1≈φ0+ρ/2. The
ra-dial velocity data near phase 0.8 are too sparse to confirm whether
the value ofφ2=0.83 for the second spot is reasonable. We can,
in principle, check for consistency between the amplitudes of the distortions, but this is a less straightforward test (see ‘Discussion’ below). We can at least point out that the size of the distortions to the I-band light curves are about 2 per cent and that the distortion to the radial velocity curve is about 2 per cent of the equatorial rotational
velocity of the M dwarf (51 km s−1).
D
o
w
n
lo
a
d
e
d
fro
m
h
ttp
s:
//a
ca
d
e
mi
c.
o
u
p
.co
m/
mn
ra
s/
a
rt
icl
e
-a
b
st
ra
ct
/3
5
5
/4
/1
1
4
3
/9
9
2
3
2
7
b
y
U
n
ive
rsi
ty
o
f S
h
e
ffi
e
ld
u
se
r
o
n
1
1
A
p
ri
l 2
0
1
Figure 9. Upper panel: the optimum value ofrWDas a function of incli-nation from the least-squares fit to theu′-band light curve; middle panel: optimum value ofrM; lower panel: the predicted semi-amplitude of the I-band light curve,I, for two values of the limb darkening coefficient. The conversion of the observed value ofIto values ofrWDandrMand their uncertainties are illustrated by dashed and dotted lines, respectively.
3.7 Masses and radii of the stars
From the lower panel of Fig. 9 we find that the observed value of
I=0.0097±0.0024 corresponds to an inclination ofi=(81.7±
1.4)◦. From the upper two panels we then findr
WD =0.0048±
0.0005 andrM=0.188±0.018. We combine these values with
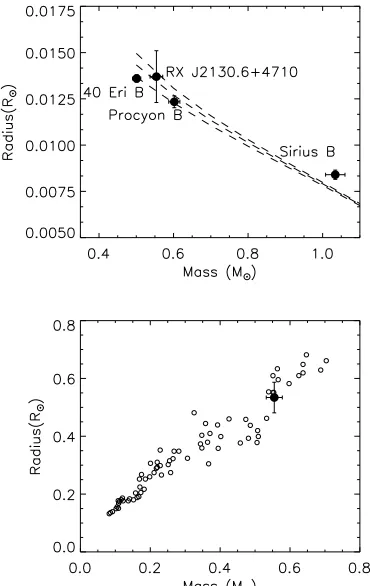
[image:10.612.330.547.66.218.2]the combined spectroscopic orbit in Table 6 to derive the masses and radii for the stars given in Table 8. The positions of the stars in the mass–radius plane is compared with other white dwarfs and M dwarfs in Fig. 11.
[image:10.612.366.511.296.408.2]Figure 10. The phase-binnedI-band light curve of RX J2130.6+4710 with a model fitted to two spot-like components, an ellipsoidal component and a reflection component.
Table 7. Parameters of the least-squares fit to theI-band light curve.
Parameter Value
Constant 1.0103±0.00053
I 0.0097±0.0024
Aref 0.0010±0.0009
A1 0.0175±0.0012
φ1 0.369±0.023
A2 0.0143±0.0021
φ2 0.833±0.022
χ2 40.86
N 46
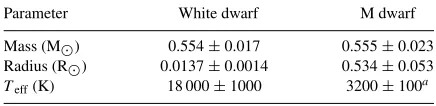
Table 8. The masses, radii and effective temperatures of the stars in RX J2130.6+4710.
Parameter White dwarf M dwarf
Mass (M⊙) 0.554±0.017 0.555±0.023 Radius (R⊙) 0.0137±0.0014 0.534±0.053 Teff(K) 18 000±1000 3200±100a aBased on our estimate of the spectral type and the calibration of Leggett (1992).
3.8 The effective temperature of the white dwarf
We compared the spectra of RX J2130.6+4710 with a grid of syn-thetic spectra calculated from pure hydrogen model atmospheres to
estimate the effective temperature,Teff, of the white dwarf.
These have been generated with the latest versions of the plane-parallel, hydrostatic, non-local thermodynamic equilibrium
(non-LTE) atmosphere and spectral synthesis codesTLUSTYv. 200(Hubeny
1988; Hubeny & Lanz 2003) and SYNSPECv. 48(Hubeny, Stefl &
Harmanec 1985). All calculations include a full treatment of line blanketing and use a state-of-the-art model hydrogen atom incorpo-rating the eight lowest energy levels and one super-level extending
fromn=9 ton=80. During the calculation of the model
struc-ture, lines of the Lyman and Balmer series are treated by means of an approximate Stark profile. However, as we use the Balmer lines to determine the effective temperature and surface gravity of the white dwarf, it is important that we employ the best available line broadening data. Therefore, during the spectral synthesis step,
D
o
w
n
lo
a
d
e
d
fro
m
h
ttp
s:
//a
ca
d
e
mi
c.
o
u
p
.co
m/
mn
ra
s/
a
rt
icl
e
-a
b
st
ra
ct
/3
5
5
/4
/1
1
4
3
/9
9
2
3
2
7
b
y
U
n
ive
rsi
ty
o
f S
h
e
ffi
e
ld
u
se
r
o
n
1
1
A
p
ri
l 2
0
1
[image:10.612.329.547.457.510.2]Figure 11. Upper panel: the white dwarf component of RX J2130.6+4710 in the mass–radius plane compared with other white dwarfs as labelled and the models of Benvenuto & Althaus (1999) for effective temperatures of 700, 17 000 and 24 790 K. Lower panel: the M-dwarf component of RX J2130.6+4710 in the mass–radius plane (filled circle) compared with other M dwarfs (open circles) taken from Clemens et al. (1998).
detailed profiles for the HIlines are calculated from the Stark
broad-ening tables of Lemke (1997). We calculated synthetic spectra for
model atmospheres over a range 15 000 K<Teff<65 000 K in steps
of 5000 K and surface gravities in the range 6.5<logg<8.5 in
steps of 0.5 (loggin cgs units.).
In order to compare the spectra of RX J2130.6+4710 with the model spectra, we first had to remove the contribution of the M dwarf from the spectra. The spectra were normalized by a constant value determined from the mean flux around 4600 Å. We interpolated the spectra on to a uniform wavelength grid of 2760 pixels over the wavelength range 3780–5105 Å. We formed the average of spectra in groups taken at the same orbital phase to within 0.04 phase units. The phase ranges were chosen such that spectrum of RX J2130.6+4710 taken at mid-eclipse was in a group by itself. We calculated a scaling factor to apply to the mid-eclipse spectrum prior to subtracting it from each of the 24 phase-binned spectra by measuring the ratio of fluxes either side of the band head near 4954 Å and the depth of the absorption feature near 4226 Å. The scaling factor calculated was typically 0.25 at 4226 Å and 0.36 at 4954 Å. We multiplied the mid-eclipse spectrum by a linear function of wavelength fitted to these values prior to shifting it to account for the radial velocity then subtracting it from the phase-binned spectra.
We convolved the synthetic spectra with a Gaussian function to account for the resolution of the observed spectra and then inter-polated the synthetic spectra on to the same wavelength grid as the phase-binned spectra. We were then able to compare the synthetic
and observed spectra by calculating theχ2statistic for each
combi-nation of observed and synthetic spectra. We did this separately for each Balmer line after applying a linear normalization calculated from the flux in the line wings to all the spectra. We excluded from
the calculation ofχ2 a region±100 km s−1 wide centred on the
Balmer emission lines from the M dwarf, the CaIIH and K
emis-sion lines and an emisemis-sion line near 3905.5 Å which may be due to
SiI.
For 20 of the phase-binned spectra, the synthetic spectrum that
gave the lowest value ofχ2 was calculated from a model
atmo-sphere withTeff=20 000 K, logg=8.0. There is good agreement
between the value of loggderived from fitting these spectra and the
value calculated from the measured mass and radius, i.e. logg=
7.93+0.07
−0.09. Therefore, we created synthetic spectra corresponding to
a range 15 000 K<Teff<20 000K in steps of 1000 K and
sur-face gravities of logg=7.93, 7.84 and 8.00 by interpolation over
the synthetic spectra calculated from the model atmospheres. We
calculated theχ2statistic for these interpolated spectra as before.
We found that 17 of the spectra were best fitted by model spectra
withTeff=18 000 K, logg=7.84 orTeff=17 000 K, logg=
7.99. These model spectra and a typical phase binned spectrum are shown in Fig. 12. The remaining seven spectra were best fitted by spectra within one grid-step of these two models. The quality of fits for spectra taken at phases from 0 to 0.5 judged by eye and from the
value ofχ2is very good. The fits are not so good in the other half of
the orbit if judged by the value ofχ2(reducedχ2values≈1.5). There
is no reason for this that is obvious from an inspection of the fits, but it is probably due to a combination of inaccurate subtraction of the M-dwarf spectrum and inaccuracies in the flux calibration. The spec-tra in the phases range 0 to 0.5 tend to be fitted best by specspec-tra with
Teff=18 000 K. Therefore, we adopt an effective temperature of
Teff=18 000 K for the white dwarf in RX J2130.6+4710 and
esti-mate that the uncertainty in this estiesti-mate is about 1000 K.
4 D I S C U S S I O N
We can estimate the distance and reddening to RX J2130.6+4710
from its effective temperature and ourBandV photometry. From
the tabulations of Bergeron, Wesemael & Beauchamp (1995) we estimate that the white dwarf in RX J2130.6+4710 has an intrinsic
colour (B–V)0=0.00±0.02 and an absoluteVmagnitude,MV=
11.0±0.1. From the depths of the eclipses in theBandVbands
combined with the photometry in Table 2 we can estimate apparent
magnitudes for the white dwarf ofV =15.05±0.1,(B−V)=
0.2 ± 0.14. From these values we estimateE(B−V) = 0.2 ±
0.15,(m−M)=4.65 ±0.5 and a distance to RX J2130.6+4710
of 85±20 parsec.
The distance to HD 204906 is known to be 82±5 parsec from
its Hipparcos parallax (Perryman et al. 1987). It would be fortu-nate if RX J2130.6+4710 could be shown to be physically related to HD 204906 because we could then measure accurate absolute magnitudes for the stars in this binary. Unfortunately, the
mea-sured radial velocity for HD 204906 is 34.8±1.4 km s−1(Sandage
& Fouts 1987), which is very different from the value ofγM =
15.3±0.7 we have measured. This suggests that HD 204906 and
RX J2130.6+4710 are not physically related. One possibility that should be investigated is whether HD 204906 is itself a binary star.
The M dwarf in RX J2130.6+4710 shows all the characteristics of a magnetically active star, i.e. soft X-ray emission, Balmer emission lines, flares and spots. We have attempted some crude modelling of the distortions to the radial velocity and light curves to account for these distortions. In reality, these spots are likely to be a complex
D
o
w
n
lo
a
d
e
d
fro
m
h
ttp
s:
//a
ca
d
e
mi
c.
o
u
p
.co
m/
mn
ra
s/
a
rt
icl
e
-a
b
st
ra
ct
/3
5
5
/4
/1
1
4
3
/9
9
2
3
2
7
b
y
U
n
ive
rsi
ty
o
f S
h
e
ffi
e
ld
u
se
r
o
n
1
1
A
p
ri
l 2
0
1
Figure 12. A typical phase-binned spectrum of the white dwarf in RX J2130.6+4710 plotted in sections offset by 0.25 around each Balmer line. The solid and dashed lines are synthetic spectra from model atmospheres withTeff=18 000 K, logg=7.84 andTeff=17 000 K, logg=7.99, respectively.
pattern of dark regions with variations in the local temperature and the emergent spectrum. This pattern of dark regions can approxi-mated using models with circular spots, each with its own position (latitude and longitude), physical size and temperature. Modelling
the two spots we have used to model theI-band light curve would
therefore require eight free parameters plus some model for how the emergent spectrum depends on local temperature and viewing angle. This is not warranted given the quality of our data. Further observations of RX J2130.6+4710 with improved phase coverage and resolution could be used to study the pattern of active regions on the surface of the M dwarf and the evolution of this pattern using techniques such as Doppler imaging (Rice 2002) or monitoring of the light curve. Such studies would benefit from the independent determinations of the rotational period of the star (assuming it is the same as the orbital period) the inclination of the star and the radius of the star presented here. This would, for example, allow a compar-ison of the rotational period derived from a Fourier analysis of the light curve excluding eclipses with the orbital period in order to look for asynchronous rotation in the M dwarf. Monitoring of the eclipse times will then allow a further test of the mechanism proposed by Applegate (1992) to explain period changes in binaries similar to RX J2130.6+4710 such as V471 Tau. Indeed, the orbital periods of V471 Tau and RX J2130.6+4710 are very similar, so comparison of the results for these two stars will provide observational evidence for the way in which Applegate’s mechanism depends on the mass of the magnetically active star.
In principle, a measurement of the depth of the secondary eclipse in RX J2130.6+4710 would allow a much more accurate determi-nation of the masses and radii of the stars. Unfortunately, the pre-dicted secondary eclipse depth is 7 milli-magnitudes or less. This
will be very difficult to measure given the proximity of HD 204906 to RX J2130.6+4710 and the distortions to the light curve due to spots and flares. A more straightforward way to improve the accu-racy of the masses and radii will be to obtain improved spectroscopy, both in terms of resolution and signal-to-noise, and to obtain a light curve at near infrared wavelengths where the measurement of the ellipsoidal effect will be less affected by star spots. High-resolution spectroscopy at wavelengths of 3800–4000 Å may reveal sharp metal lines due to accretion of metals on to the surface of the white dwarf from the stellar wind of the M dwarf (Zuckermann et al. 2003). These lines, if present, would allow the measurement of accurate ra-dial velocities for the white dwarf and thus an accurate measurement of its gravitational redshift.
The spectral type of the M dwarf in RX J2130.6+4710 is
esti-mated to be M3.5Ve or M4Ve and its mass is 0.555±0.023 M⊙.
This combination of mass and spectral type is not consistent with the calibration of Leggett (1992) for M stars in the galactic disc. A
typical M3.5V in the galactic disc has a mass of about 0.2–0.3 M⊙.
An M-type star in the galactic disc with a mass of 0.55 M⊙usually
has a spectral type in the range M0V – M2V. This discrepancy may be due to an inaccurate estimate of the spectral type for the M dwarf caused by using a limited spectral range with few features sensitive to spectral type and comparing this spectrum with those of stars that are not standard stars for the spectral class. A much more reliable estimate of the spectral type of the M dwarf in RX J2130.6+4710 should be made using a spectrum taken during the eclipse covering the TiO bands in the regions 6000 Å – 9000 Å. By contrast, the
ob-served value of (J–H)=0.63 is negligibly affected by the presence
of the white dwarf and is typical for M-type stars in the galactic disc
with a mass of 0.55 M⊙.
D
o
w
n
lo
a
d
e
d
fro
m
h
ttp
s:
//a
ca
d
e
mi
c.
o
u
p
.co
m/
mn
ra
s/
a
rt
icl
e
-a
b
st
ra
ct
/3
5
5
/4
/1
1
4
3
/9
9
2
3
2
7
b
y
U
n
ive
rsi
ty
o
f S
h
e
ffi
e
ld
u
se
r
o
n
1
1
A
p
ri
l 2
0
1
We have investigated the past and future evolution of RX J2130.6+4710 using the analysis described by Schreiber &
G¨ansicke (2003). The cooling age, tcool, of RX J2130.6+4710
derived by interpolating the cooling tracks of Wood (1995) is
log(tcool/y) = 7.85. This is the time since RX J2130.6+4710
emerged from the common-envelope phase, at which time the or-bital period is estimated to have been 0.53–0.6 d depending on the prescription used to model the angular momentum loss due to a magentic stellar wind in this interval. The continued loss of angular momentum will shrink the Roche lobe of the M dwarf to the point where mass transfer will start from the M dwarf to the white dwarf through the inner Lagrangian point. This will occur at an orbital
period Psd=0.185 d. Our estimate of the time before Roche lobe
overflow occurs,tsd, also depends on the prescription for angular
mo-mentum loss used and varies from log(tsd/y)=8.1 to log(tsd/y)=
9.6. In either case, the time taken is less than a Hubble time so RX J2130.6+4710 can properly be described as a pre-cataclysmic variable star (pre-CV) in the sense defined by Schreiber & G¨ansicke.
The value ofPsdfor RX J2130.6+4710 is well above the period gap
for CVs and is second only to V471 Tau among the systems compiled by Schreiber & G¨ansicke. This implies that RX J2130.6+4710 is a member of the group of the rare progenitors of long orbital period CVs.
AC K N OW L E D G M E N T S
The research reported in this paper was based on observations made with the William Herschel, Isaac Newton and Jacobus Kapteyn tele-scopes operated on the island of La Palma by the Royal Greenwich Observatory in the Spanish Observatorio del Roque de los Mucha-chos of the Instituto de Astrofisica de Canarias. PFLM and LMR were supported by a PPARC post-doctoral grant. We would like to thank Romano Corradi for his prompt and informative reply to our query regarding the timing accuracy of data from the ING. This research has made use of the SIMBAD database, operated at CDS, Strasbourg, France. We thank an anonymous referee for comments and suggestions regarding the modelling of distortions to the light curve and radial velocity curve.
R E F E R E N C E S
Applegate J. H., 1992, ApJ, 385, 621
Benvenuto O. G., Althaus L. G., 1999, MNRAS, 303, 30 Bergeron P., Wesemael F., Beauchamp A., 1995, PASP, 107, 1047 Claret A., 2000, A&A, 363, 1081
Clemens J. C., Reid I. N., Gizis J. E., O’Brien M. S., 1998, ApJ, 496, 352
Dhillon V. S., Marsh T. R., 2001, New Ast. Rev., 45, 91 Grabowski B., Halenka J., Madej J., 1987, ApJ, 313, 750
Harris D. E. et al., 1994, EINSTEIN Observatory Catalog of IPC X-ray Sources, SAO HEAD CD-ROM Series I (Einstein), Nos 18–36 Hawley S. L., Gizis J. E., Reid I. N., 1996, AJ, 112, 2799
Hoard D. W., Wachter S., Clark L. L., Bowers T. P., 2002, ApJ, 565, 511 Hubeny I., 1988, Computer Physics Comm., 52, 103
Hubeny I., Lanz T., 2003, in Hubeny I., Mihalas D., Werner K., eds, ASP Conf. Ser. 288, Stellar Atmosphere Modeling. Astron. Soc. Pac., San Francisco, p. 117
Hubeny I., Stefl S., Harmanec P., 1985, Bull. Astron. Inst. Czechosl., 36, 214
Iben I., Livio M., 1993, PASP, 105, 1373
Jaschek C., Jaschek M., 1987, The Classification of Stars. Cambridge Univ. Press
Landolt A. U., 1992, AJ, 104, 340 Leggett S. K., 1992, ApJS, 82, 351 Lemke M., 1997, A&AS, 122, 285 Marsh T. R., 1989, PASP, 101, 1032 Motch C. et al., 1991, A&A, 246, L24
Motch C., Guillout P., Haberl F., Pakull M. W., Peitsch W., Reinsch K., 1997, A&A, 318, 111
Naylor T., 1998, MNRAS, 296, 339 Nelson B., Davis W. D., 1972, ApJ, 174, 617
Nidever D. L., Marcy G. W., Butler R. P., Fischer D. A., Vogt S. S., 2002, ApJS, 141, 503
Oke J. B., 1990, J, 99, 1621
Perryman M. A. C. et al., 1997, A&A, 323, L49 Popper D. M., Etzel P. B., 1981, AJ, 86, 102
Press W. H., Teukolsky S. A., Vetterling W. T., Flannery B. P., 1992, Numer-ical Recipes inFORTRAN, 2nd edn. Cambridge Univ. Press, Cambridge Reid I. N., Hawley S. L., Gizis J. E., 1995, AJ, 110, 1838
Rice J. B., 2002, AN, 323, 220 Ritter H., Kolb U., 1998, A&AS, 129, 83 Sandage A., Fouts G., 1987, AJ, 93, 592 Schneider D. P., Young P., 1980, ApJ, 238, 946 Schreiber M. R., G¨ansicke B. T., 2003, A&A, 406, 305
Thompson R. J., Shelton R. G., Arning C. A., 1998, AJ, 115, 2587 Tr¨umper J., 1983, Adv. Space. Res., 2, 241
Wallace P. T., 2000,SLALIBProgrammer’s Manual, Starlink User Note 67.61, CCLRC/Rutherford Appleton Laboratory (http://star-www.rl.ac.uk/ star/docs/sun67.htx/sun67.html)
Wenger M. et al., 2000, A&AS, 143, 9
Wood M. A., 1995, in Koester D., Werner K., Lecture Notes in Phys. Vol. 443, White Dwarfs. Springer, Heidelberg, p. 41
Zuckerman B., Koester D., Reid I. N., H¨unsch M., 2003, ApJ, 596, 477
This paper has been typeset from a TEX/LATEX file prepared by the author.
D
o
w
n
lo
a
d
e
d
fro
m
h
ttp
s:
//a
ca
d
e
mi
c.
o
u
p
.co
m/
mn
ra
s/
a
rt
icl
e
-a
b
st
ra
ct
/3
5
5
/4
/1
1
4
3
/9
9
2
3
2
7
b
y
U
n
ive
rsi
ty
o
f S
h
e
ffi
e
ld
u
se
r
o
n
1
1
A
p
ri
l 2
0
1