Health Economics and
Decision Science
(HEDS)
Discussion Paper
This series is intended to promote discussion and to provide information about work in progress. The views expressed are those of the authors, and therefore should not be quoted without their permission. However, comments are welcome and we ask that they be sent direct to the corresponding author.
of DP of DP
Injury Alcohol-Attributable
Fractions: Methodological
Issues and Developments
Daniel Hill-McManus
,
Colin
Angus
,
Yang Meng
,
John
Holmes
,
Alan Brennan
,
Petra S.
Meier
DP 14.02
HEDS Discussion Paper
No. 14.02
Injury Alcohol-Attributable Fractions: Methodological Issues and Developments
Daniel Hill-McManus
,
Colin Angus
,
Yang Meng
,
John Holmes
,
Alan Brennan
,
Petra S. Meier
School of Health and Related Research, University of Sheffield, Regent Court, 30
Regent Street, UK. S1 4DA
Disclaimer:
This series is intended to promote discussion and to provide information about work in progress. The views expressed in this series are those of the authors, and should not be quoted without their permission. Comments are welcome, and should be sent to the corresponding author.
This paper is also hosted on the White Rose Repository:
http://eprints.whiterose.ac.uk/
Injury Alcohol-Attributable Fractions: Methodological Issues and Developments
Daniel Hill-McManusa, Colin Angusa, Yang Menga, John Holmesa, Alan Brennana, Petra S. Meiera
aSchool of Health and Related Research, University of Sheffield, Regent Court, 30 Regent Street, UK.
S1 4DA
Daniel Hill-McManus: [email protected] Colin Angus: [email protected]
Yang Meng: [email protected] John Holmes: [email protected] Alan Brennan: [email protected] Petra S. Meier: [email protected]
Corresponding author: Colin Angus
School of Health and Related Research, University of Sheffield, Regent Court, 30 Regent Street, UK. S1 4DA
0114 222 0686
Abstract
Background
Alcohol-attributable fractions (AAFs) are routinely used to estimate the burden of injury resulting from alcohol. Recent methodological advances allow AAFs to be estimated using national survey data. However, this requires assuming that the drinking patterns are equivalent to those used by epidemiological studies estimating the relative risk of injury. This study explores the implications of this assumption and presents an improved method of estimating injury AAFs.
Methods
Diary survey is used to describe individuals’ drinking occasions and estimate AAFs. Statistical methods and numerical integration are used to combine the evidence on the risk of injury when intoxicated with the diary data. Alternative assumptions are chosen to explore the implications of using national survey data.
Results
Overall, an estimated 27% of road traffic accident (RTA) and 23% of non-RTA injuries in Britain are attributable to alcohol. AAF estimates for RTAs range from 54% to 2% and for non-RTAs from 36% to 8% in men aged 16-24 and women aged 55-64 respectively. Two potentially more realistic
assumptions relating to the use of national survey data resulted in substantially lower AAF estimates for RTAs.
Conclusion
Current methods of estimating injury AAFs using national survey data are flawed for some harms, particularly RTAs, where the data is not consistent with the epidemiological literature. Our findings indicate that the burden of injuries from RTAs in England has been previously overestimated. Further research into the prevalence of risky behaviours when intoxicated is required to refine these
methods and produce more robust burden of injury estimates.
Introduction 1.
Global Burden of Disease (GBD) estimates for 2010 show that almost 200,000 road traffic accident fatalities were the direct result of alcohol (Lim et al., 2012). This figure was derived using an estimated alcohol-attributable fraction (AAF) for road traffic accidents (RTAs). The AAF represents the proportion of a disease or harm that would disappear if the population was to stop consuming alcohol. For example, an AAF for death in an RTA of 20% implies that were the population to stop consuming alcohol, the total number of recorded deaths due to RTAs would be reduced by 20%. Due to the difficulty in observing the AAF directly, estimates are usually obtained indirectly by combining population level data on alcohol consumption with data on the relative risk of being fatally injured after consuming alcohol (Eide and Heuch, 2001).
Ridolfo and Stevenson (2001) produced some of the most widely used estimates of AAFs for RTAs by combining a relative risk of injury when driving with elevated blood alcohol content (BAC) with the prevalence of elevated BAC amongst randomly tested drivers in Australia. They used Australian data on drivers’ BAC from 1996 and relative risk data estimated using accident data from 1983. Their findings have since been used to estimate the burden of fatalities and injuries resulting from RTAs in England (Jones et al., 2008), Scotland (NHS National Services Scotland, 2009) and Ireland (Martin et al., 2010) as well as globally (Rehm et al., 2009, 2004). However, since drinking patterns and driving practices may vary over time, and between countries, these findings may not be transferrable to other settings decades later. Furthermore, data such these are seldom available for large and representative samples and there was a need for alternative methods that take advantage of the available data.
disease studies to estimate the extent of alcohol-attributable injuries (Shield et al., 2012a, 2012b) including the WHO GBD study 2010 (Lim et al., 2012). These estimated AAFs are typically
substantially lower than previous estimates, for example, 10.4% for males aged 30 – 44 years in fatal RTAs (Shield et al., 2012a), compared with up to 50% for this subgroup in previous studies (NHS National Services Scotland, 2009; Rehm et al., 2004).
Whilst national survey data used in these studies is widely available it does have limitations when compared with the roadside testing data of previous studies (Ridolfo and Stevenson, 2001). The calculation of injury AAFs makes use of relative risk estimates derived in studies which compare the rates of fatal or non-fatal injuries amongst groups of people who did and did not drink alcohol (Lloyd, 1992; Taylor et al., 2010). However, participation in these studies is often conditional on engaging in some type of risky behaviour, for example, driving a car in the case of injury in an RTA. However, although national surveys often provide data on alcohol consumption, they do not usually provide data on drinking and driving. In order to apply the methods developed by Taylor et al. (2011) it is necessary to assume that the proportion of time that a person is intoxicated, given their
reported consumption, is the same as the proportion of time intoxicated while driving. In other words, that the likelihood of drinking alcohol and the likelihood of driving are independent. This may not be an appropriate assumption, but its potential impact on the resulting injury AAF estimates has never been examined. Additional limitations may also influence the resulting injury AAF estimates and therefore the burden of injury attributed to alcohol. These include the limited information on the number and scale of heavy drinking occasions available in most national surveys. The ideal drinking data would describe the amount consumed on every drinking occasion, in order to be consistent with the drinking occasion level data used to derive injury relative risks. Average weekly consumption or the frequency of drinking X+ number of drinks does not provide sufficient information to construct complete occasion based drinking patterns (Gmel et al., 2011).
Secondly, to derive updated AAF estimates for two categories of injury in England, RTAs and non-RTA injuries, using England specific drinking data. Thirdly, to conduct an exploratory analysis of the potential implications of the assumption that drinking and driving are independent. The analysis was conducted using two alternative assumptions to provide insights into the uncertainty in the burden of injury estimates resulting from this assumption.
Methods 2.
2.1. Overview
The indirect method of estimating AAFs for a given disease or injury involves combining alcohol consumption data for the target population with the estimated relative risk of harm due to alcohol consumption within the target population using the formula in Eq. 1. In Eq. 1, pi is the proportion of
the population in consumption group i and RRi is the relative risk of injury or disease for an individual
at this level of alcohol consumption. The group labelled i = 0 represents abstainers. The alcohol consumption measure required depends on the outcome of interest. For some chronic harms, such as pancreatitis, the appropriate measure of alcohol consumption may be the average quantity of alcohol consumed per week (Irving et al., 2009). For acute harms, however, which result from intoxication, an appropriate measure of alcohol consumption would be data on the quantities of alcohol consumed on every occasion in some time interval, such as a year.
(1)
2.2. Survey data
lifestyle information and includes quantity-frequency (QF) questions to measure their usual alcohol consumption. The diary was prospective over 7 days and required respondents to weigh and record all items of food and drink consumed during the diary period. For alcoholic beverages, respondents recorded details of the beverage (such as ‘beer, strong bitter, canned’), the time of day and the weight of the serving, obtained using scales provided to the respondent, from which the grams of alcohol was derived. In the NDNS 2000/01 there were a total of 1,724 individual survey respondents who completed both the 7-day diary as well as the survey questionnaire. For a summary of the NDNS 2000/01 data used in this analysis, see the supplementary material, which can be found by accessing the online version of this paper (see Appendix A).
2.3. Drinking occasions
Table 1
The variables used to describe individual occasion based drinking patterns
Variable Description
n The predicted number of weekly drinking occasions
µ
The average quantity of alcohol consumed during a drinking occasion, obtained using the QF mean weekly consumption and n, the predicted number of weekly drinking occasions
σ The predicted standard deviation of the quantity consumed during a drinking occasion
x The quantity of alcohol consumed during a drinking occasion
φ(x;µ,σ)
The probability distribution of consuming quantity x during an occasion, given mean occasion consumption µ and standard deviation σ
As a single 7-day period may not be representative of an individual’s typical weekly drinking occasions, in our earlier study we estimated the usual weekly drinking patterns for this survey sample using a series of regression models (Hill-McManus et al., 2013). The coefficients from these regressions have been used to predict the average number of weekly drinking occasions, n, and the standard deviation in the quantity consumed during a drinking occasion, σ. Rather than imputing the average quantity consumed during a drinking occasion, µ, this was estimated by dividing the mean weekly consumption, estimated using the survey QF questions, by n. The distribution φ describes the distribution of the amount drunk during an occasion for an individual (i.e., x) and is assumed to follow a normal distribution with individual-specific µ and σ.
2.4. Injury relative risk
(2010) grouped the harms into two categories: RTAs and all non-RTA injuries. The estimated relative risk (RR) functions are reproduced in Eq. (2a) and Eq. (2b), where LN(RR) is the natural logarithm of the relative risk and x is the grams of alcohol consumed prior to the occurrence of the injury and C is a constant equal to 0.0039997100830078. Using Eq. (2a) and Eq. (2b) it is possible to estimate the relative risk of injury following a drinking occasion for any level of consumption.
(2a) (2b)
2.5. Annual relative risk
The general procedure for calculating the average annual relative risk of injury is described in Taylor et al. (2011). This involves computing the relative risk of injury for every drinking occasion and taking the average, weighted by an estimate of the duration a person is intoxicated as a result of the alcohol that they consumed in a drinking occasion. Hence, higher consumption occasions will result in longer periods of intoxication and receive a greater weight. All the time spent not intoxicated is considered to be an occasion with a relative risk of one. Therefore, if T is the total number of hours in a year (i.e., 8760), tintox(x) is the number of hours intoxicated after consuming x grams of alcohol,
n(x) is the number of occasions in a year in which x grams of alcohol were consumed and RR(x) is the relative risk of injury while intoxicated after consumed x grams of alcohol, then the annual relative risk for a single individual can be estimated using Eq. 3.
(3)
From our earlier analysis of the NDNS data from 2000/2001 (Hill-McManus et al., 2013), described above, we have an estimated probability distribution for the quantity of alcohol consumed, given by
estimated number of annual occasions, N, multiplied by the probability of consuming at that level, φ(x;µ,σ), for an individual with a predicted µ andσ, as is shown in Eq. (4).
(4)
To obtain an estimated duration of intoxication, for an occasion in which x grams of alcohol are consumed, we rearranged the Widmark formula used to estimate a person’s blood alcohol content (BAC) (Posey and Mozayani, 2007; Watson et al., 1981). By setting the BAC to be zero, we can use Eq. (5) to estimate the time, in hours, it would take for an individual’s BAC to drop to zero from the time they consumed a given quantity of alcohol, x. In Eq. (5), r is the Watson-r value, W is the individual’s body weight (in kg) and β is the elimination rate of alcohol by the liver.
(5) Hence, the final formula for estimating an individual’s annual relative risk of injury is given by Eq. (6). The summations over all occasions have been replaced by integrals since we are now using a
continuous probability distribution for the quantity consumed in an occasion. The integrals cannot be solved analytically and we therefore used numerical methods to estimate their values. The integrals were approximated at single integer values of x, using the cumulative density function, for values of x between 1 and 100 grams. The 100 gram upper bound is chosen since the risk functions become unstable for occasions exceeding 100 grams (Taylor et al., 2010). Therefore, the 100 gram occasion is assigned the sum of the probabilities for 100 grams upwards. This process and the numerical integration are described in detail in the supplementary material, see appendix A. The result of this analysis is annual relative risk (either for RTAs or non-RTAs) for an individual given their predicted weekly occasion based drinking patterns, from which we can use Eq. (1) in order to estimate injury AAFs.
2.6. Drink driving
By using this approach of calculating the annual relative risk by weighting according to the proportion of the time spent sober relative to intoxicated it has been implicitly assumed that the probability of drinking is independent of the probability of all other activities, such as sleeping, being away from the home or driving. Therefore, in the case of RTAs, it is assumed that if an individual is intoxicated for 1% of the year, then this person is intoxicated for 1% of the time that he or she spends driving. As far as we are aware this assumption is neither supported by data nor acknowledged in the research literature (e.g. Taylor et al. (2011)). We have conducted two sensitivity analyses to explore the possible uncertainty in the estimated AAFs for RTAs. The alternative assumptions are selected to be plausible but are otherwise arbitrary and serve only to explore the possible impact of the assumption on the final AAF estimates. Sensitivity analyses have been conducted for RTAs only, since these estimates are likely to be most sensitive to the
assumptions imposed in this analysis. Sensitivity analysis 1
This analysis considers that the more a person drinks the less likely they are to drive. The proportion of time spent driving whilst intoxicated is still assumed to be proportional to the proportion of time spent intoxicated overall, but with an added constant of proportionality that is reduced for high consumption occasions. It was assumed that the proportions were equal if less than 24 grams of alcohol were consumed (equivalent to 3 UK units), half the proportion if between 25 and 80 grams (80 grams is equivalent to 10 UK units) of alcohol were consumed and one tenth the proportion if more than 80 grams of alcohol was consumed. Therefore, if an individual is intoxicated for 1% of the year, then they are intoxicated for 1% of the time when driving after drinking less than 25 grams of alcohol, 0.5% after drinking between 25 and 80 grams and 0.1% after drinking over 80 grams. Sensitivity analysis 2
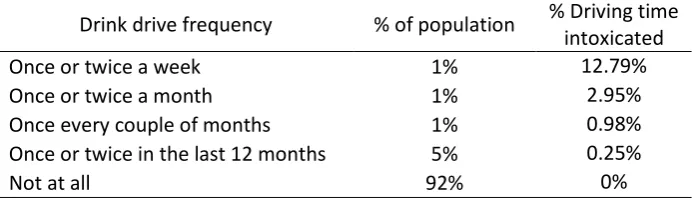
the last 12 months how often, if at all, have you driven when you think you may have been over the legal alcohol limit?’. NDNS survey respondents have been randomly apportioned between drink driving groups according to the responses to this question provided in the 2010/11 survey (UK Department for Transport, 2011), shown in Table 2.
Table 2
British Crime Survey reported drink driving 2010/11
Drink drive frequency % of population % Driving time intoxicated
Once or twice a week 1% 12.79%
Once or twice a month 1% 2.95%
Once every couple of months 1% 0.98%
Once or twice in the last 12 months 5% 0.25%
Not at all 92% 0%
Results 3.
The estimates of the injury AAFs based on the NDNS 2000/01 survey data, for each injury category, are presented in Table 3. The AAFs estimated from this sample for the whole population are 27% for RTAs and 23% for non-RTA injuries. Average annualised relative risk estimates were determined for gender and age subgroups, and are presented in Table 4, along with the corresponding estimate of the AAF. The averaged relative risks only include drinkers, and as such represent the average risk of injury over all drinkers in each subgroup, relative to the average risk of a non-drinker in the
[image:14.595.72.337.347.422.2]population. All the results have accounted for the individuals’ survey weight.
Table 3
Estimated alcohol-attributable fractions for injury
Subgroup Alcohol-attributable fraction
RTA non-RTA
Total population 25% 21%
Male 36% 29%
Female 12% 14%
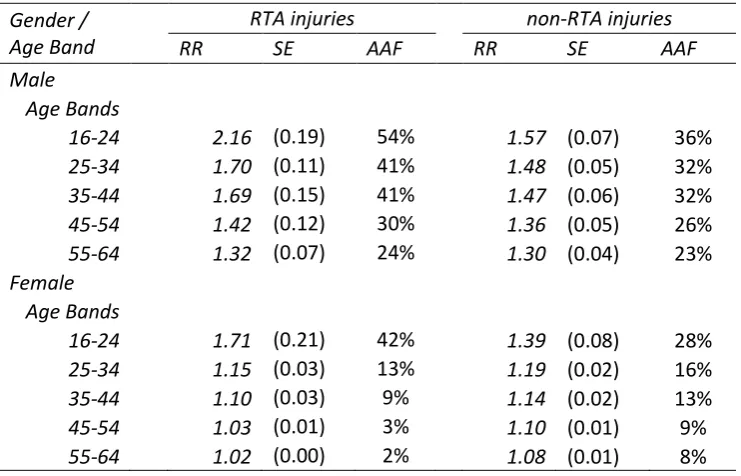
Table 4
Average drinker annualised relative risk and AAFs for injury by age and gender subgroup Gender /
Age Band
RTA injuries non-RTA injuries
RR SE AAF RR SE AAF
Male
Age Bands
16-24 2.16 (0.19) 54% 1.57 (0.07) 36%
25-34 1.70 (0.11) 41% 1.48 (0.05) 32%
35-44 1.69 (0.15) 41% 1.47 (0.06) 32%
45-54 1.42 (0.12) 30% 1.36 (0.05) 26%
55-64 1.32 (0.07) 24% 1.30 (0.04) 23%
Female Age Bands
16-24 1.71 (0.21) 42% 1.39 (0.08) 28%
25-34 1.15 (0.03) 13% 1.19 (0.02) 16%
35-44 1.10 (0.03) 9% 1.14 (0.02) 13%
45-54 1.03 (0.01) 3% 1.10 (0.01) 9%
[image:14.595.72.443.478.716.2]Regarding the age and gender specific AAFs, the overall trend is for the AAF for each category of acute harm to be highest amongst men and in the youngest age groups, decreasing as age increases. For RTA injuries, in the youngest male subgroup aged 16-24, roughly 54% of injuries are a result of alcohol consumption, while the corresponding figure for females is 42%. This rapidly falls as age increases, to 41% and 13% in the next age group for males and females respectively. In the oldest age group, ages 55-64, the AAFs are 24% for males and only 2% for females. A similar but less dramatic trend is observed for non-RTA injuries, starting at 36% and 28% in the youngest age group for males and females respectively with the male AAF dropping to 23% and the female to 8% in the oldest age group.
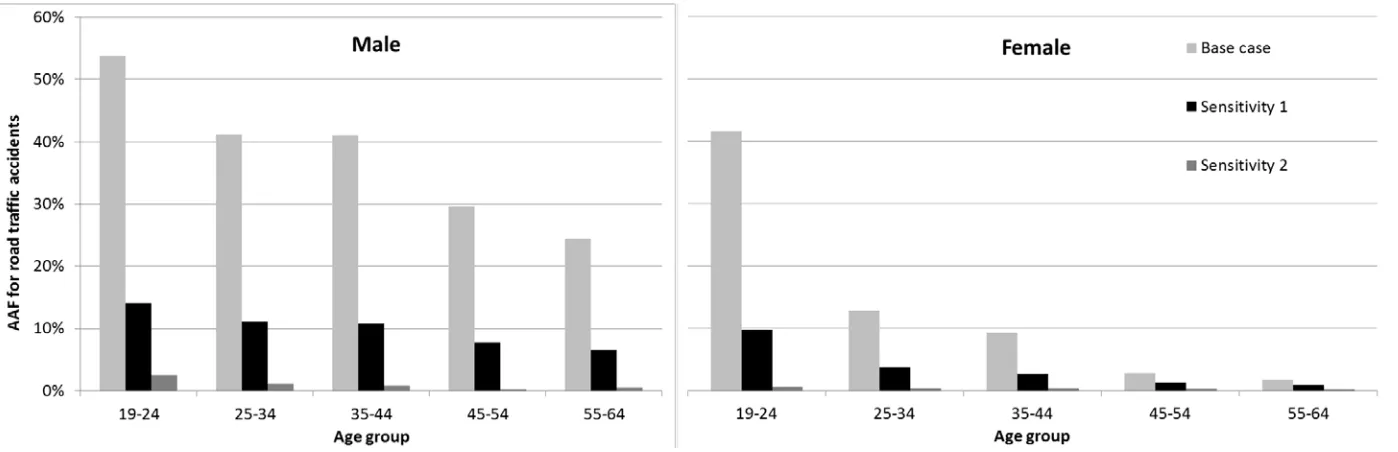
3.1. Sensitivity analyses
Overall, the alternative assumptions resulted in substantially lower AAF estimates for RTAs. In the first sensitivity analysis, the AAFs are reduced by roughly a factor of 4 and there is a slightly lower age gradient. Using the data on the frequency of drinking driving from the British Crime Survey, much smaller AAF estimates were obtained, range from 0.2% to 2.5% over the age and gender subgroups.
3.2. Between study comparison
We provide a comparison of these results, including the base case and sensitivity analyses, with those of two other studies for RTAs only, in Table 5. The other sources are Taylor et al. (2011) from which we present both their base case estimates and a sensitivity analysis, and Ridolfo and
Table 5
Between study comparison of AAF estimates for injury
Gender / Age Band This study: base Study name and year
case This study: SA1 This study: SA2 Taylor et al. (2011) Taylor et al. (2011) SA3 Stevenson (2001)Ridolfo &
Year 2000/2001 2000/2001 2000/2001 2008 2008/01-02 1996
Country England England England Canada Canada/US Australia†
Male
Age Bands
16-24 52.5% 14.1% 2.5% 22.0% 57.0% 37.0%
25-34 39.7% 11.1% 1.2% 16.0% 37.0% 37.0%
35-44 42.0% 10.8% 0.9% 16.0% 37.0% 37.0%
45-54 24.9% 7.7% 0.3% 15.0% 22.0% 37.0%
55-64 26.9% 6.5% 0.5% 16.0% 19.0% 9.0%
65-74 - - - 16.0% 19.0% 9.0%
Female
Age Bands
16-24 41.8% 9.8% 2.5% 13.0% 18.0% 18.0%
25-34 14.8% 3.8% 1.2% 2.0% 4.0% 18.0%
35-44 10.4% 2.7% 0.9% 2.0% 4.0% 18.0%
45-54 3.5% 1.3% 0.3% 3.0% 3.0% 18.0%
55-64 2.0% 1.0% 0.5% 3.0% 3.0% 0.0%
65-74 - - - 3.0% 3.0% 0.0%
*Taylor et al. (2011) used different age groupings to these, see the supplementary material for the matching of different age group AAFs
Discussion 4.
This study has shown how occasion based drinking data from diary surveys can be combined with relative risk estimates in order to estimate AAFs for injuries. However, it has also identified a substantial source of uncertainty in such estimates. Overall, it was found that approximately 27% of RTA injuries and 23% of non-RTA injuries are attributable to alcohol. The average relative risks of injury and resulting AAFs vary
considerable by age and gender subgroup. AAFs are greater for men than women and in the younger age groups for both RTA and RTA injuries, ranging from 54% to 2% for RTAs and from 36% to 8% for non-RTAs. It has been shown that AAF estimates for RTAs are highly sensitive to the assumption of the independence of drinking and driving and two alternative assumptions significantly reduced the AAF estimates.
Many previous burden of disease studies have relied on the work of Ridolfo and Stevenson (2001), using data from the 1980s and 1990s, which is now arguably out of date and not appropriate for estimating the current worldwide burden of injury. More recent studies have applied methods developed by Taylor et al. (2011) that enable national survey data to be used in the calculation of AAFs. This study has adapted and extended Taylor et al.'s (2011) methods to accommodate a more complete description of an individual’s drinking patterns; in this case derived from diary data. By comparison, our analysis has produced similar results for non-RTA injuries but substantially larger AAF estimates for RTA injuries. This is primarily a result of having individual estimates not only of the frequency of heavy drinking occasions, as was available to Taylor et al. (2011), but also the different levels of consumption during such drinking occasions. Where Taylor et al. (2011) have used alternative survey data to simulate realistic drinking patterns (referred to as ‘“real-life” scenario’) as a sensitivity analysis, they have obtained AAF estimates for RTAs that are very similar in scale to those obtained from this study, which provides some validation of our estimates.
suggest that Taylor et al.'s (2011) methods may substantially overestimate the alcohol-attributable burden of injuries resulting from RTAs. To demonstrate the impact in terms of the burden of injury, we used person-specific hospital admissions data presented by Jones et al. (2008) for 2005. Our base case AAFs for RTAs imply 7,024 alcohol-attributable injuries, compared with 4,050 estimated in Jones et al. (2008). The sensitivity analysis estimates of Taylor et al. (2011), although they relate to Canada, would imply 6,315 alcohol-attributable injuries, close to our base case estimate. However, the findings from our own sensitivity analyses, applying what may be more realistic assumptions regarding drinking and driving, produce much lower estimates of alcohol-attributable injuries of 1,864 and 275.
Alcohol-attributable injuries make a significant contribution to the overall health burden from alcohol, and obtaining reliable estimates is therefore an important research objective. We suggest that there are two avenues of further research that could advance this field and improve burden of injury estimates, both requiring primary data collection. Firstly, roadside testing of large representative samples would produce the alcohol consumption data conditional on driving consistent with the data epidemiological studies used to estimate risks. We are not aware of the existence of such data and expect that obtaining representative samples would pose considerable challenges. Secondly, data on the prevalence of drinking and driving and its variation across demographics, as well as for different levels of consumption would facilitate more accurate AAF estimates using the methods presented in this paper.
under-recording is less problematic. This difference in coverage is likely to put a downward bias on our estimates.
This study has shown how occasion based drinking data, which captures both the frequency and range in quantities across occasions, can be used to estimate AAFs for injuries. However, it has also shown that these methods are flawed for some harms, particularly RTAs, when drinking data from national surveys are not consistent with those collected by epidemiological studies which estimate the relative risks of injury. Sensitivity analyses indicate that the burden of injuries from RTAs in England has been previously overestimated. Further research into the prevalence of risky behaviours when intoxicated is required to refine these methods and produce more robust burden of injury estimates.
Appendix A
Supplementary material associated with this article can be found, in the online appendix, at http://
Acknowledgements
References
Eide, G.E., Heuch, I., 2001. Attributable fractions: fundamental concepts and their visualization. Stat. Methods Med. Res. 10.
Gmel, G., Kuntsche, E., Rehm, J., 2011. Risky single-occasion drinking: bingeing is not bingeing. Addiction 106, 1037–45.
Hill-McManus, D., Meng, Y., Angus, C., Holmes, J., Brennan, A., Meier, P.S., 2013. Estimation of usual occasion-based individual drinking patterns using diary survey data. Drug Alcohol Depend.
Irving, H.M., Samokhvalov, A. V, Rehm, J.T., 2009. Alcohol as a Risk Factor for Pancreatitis: A Systematic Review and Meta-Analysis. J. Pancreas 10, 387–392.
Jones, L., Bellis, M.A., Dedman, D., Sumnall, H., Tocque, K., 2008. Alcohol-attributable fractions for England: Alcohol-attributable mortality and hospital admissions.
Lim, S.S., Vos, T., Flaxman, A.D., Danaei, G., Shibuya, K., et al., 2012. A comparative risk assessment of burden of disease and injury attributable to 67 risk factors and risk factor clusters in 21 regions, 1990-2010: a systematic analysis for the Global Burden of Disease Study 2010. Lancet 380, 2224–60. Lloyd, C.J., 1992. Alcohol and fatal road accidents: estimates of risk in Australia 1983. Accid. Anal. Prev. 24,
339–48.
Martin, J., Barry, J., Goggin, D., Morgan, K., Ward, M., O’Suilleabhain, T., 2010. Alcohol-attributable mortality in Ireland. Alcohol Alcohol 45, 379–86.
Meier, P.S., Meng, Y., Holmes, J., Baumberg, B., Purshouse, R., Hill-McManus, D., Brennan, A., 2013.
Adjusting for unrecorded consumption in survey and per capita sales data: quantification of impact on gender- and age-specific alcohol-attributable fractions for oral and pharyngeal cancers in Great Britain. Alcohol Alcohol. 48, 241–9.
NHS National Services Scotland, 2009. Alcohol attributable mortality and morbidity: alcohol population attributable fractions for Scotland.
Posey, D., Mozayani, A., 2007. The estimation of blood alcohol concentration. Forensic Sci. Med. Pathol. 3, 33–39.
Rehm, J., Mathers, C., Popova, S., Thavorncharoensap, M., Teerawattananon, Y., Patra, J., 2009. Global burden of disease and injury and economic cost attributable to alcohol use and alcohol-use disorders. Lancet 373, 2223–2233.
Rehm, J.T., Room, R., Monteiro, M., Gmel, G., Graham, K., Rehn, N., 2004. Comparative Quantification of Health Risks: Global and Regional Burden of Disease Attributable to Selected Major Risk Factors. Geneva.
Shield, K.D., Gmel, G., Patra, J., Rehm, J., 2012a. Global burden of injuries attributable to alcohol consumption in 2004: a novel way of calculating the burden of injuries attributable to alcohol consumption. Popul. Health Metr. 10, 9.
Shield, K.D., Kehoe, T., Taylor, B., Patra, J., Rehm, J., 2012b. Alcohol-attributable burden of disease and injury in Canada, 2004. Int. J. Public Health 57, 391–401.
Stockwell, T., Donath, S., Cooper-Stanbury, M., Chikritzhs, T., Catalano, P., Mateo, C., 2004. Under-reporting of alcohol consumption in household surveys: a comparison of quantity-frequency,
graduated-frequency and recent recall. Addiction 99, 1024–33.
Stockwell, T., Zhao, J., Chikritzhs, T., Greenfield, T.K., 2008. What did you drink yesterday? Public health relevance of a recent recall method used in the 2004 Australian National Drug Strategy Household Survey. Addiction 103, 919–28.
Taylor, B., Irving, H.M., Kanteres, F., Room, R., Borges, G., Cherpitel, C., Greenfield, T., Rehm, J., 2010. The more you drink, the harder you fall: a systematic review and meta-analysis of how acute alcohol consumption and injury or collision risk increase together. Drug Alcohol Depend. 110, 108–16. Taylor, B.J., Shield, K.D., Rehm, J.T., 2011. Combining best evidence: a novel method to calculate the
alcohol-attributable fraction and its variance for injury mortality. BMC Public Health 11, 265. UK Department for Transport, 2010. National Travel Survey: 2010.
UK Department for Transport, 2011. Reported Road Casualties in Great Britain: 2011 Annual Report - Self-reported drink and drug driving: Findings from the Survey for England and Wales.
Watson, P.E., Watson, I.D., Batt, R.D., 1981. Prediction of Blood-Alcohol Concentrations in Human-Subjects - Updating the Widmark Equation. J. Stud. Alcohol 42, 547–556.