This is a repository copy of
Numerical simulation of spring hydrograph recession curves
for evaluating behavior of the East Yorkshire chalk aquifer
.
White Rose Research Online URL for this paper:
http://eprints.whiterose.ac.uk/91477/
Version: Accepted Version
Proceedings Paper:
Azeez, N, West, LJ and Bottrell, SH (2015) Numerical simulation of spring hydrograph
recession curves for evaluating behavior of the East Yorkshire chalk aquifer. In: Doctor,
DH, Land, L and Stephenson, JB, (eds.) Proceedings of the 14th Sinkhole Conference.
14th Sinkhole Conference, 05-09 Oct 2015, Rochester, Minnesota. National Cave and
Karst Research Institute , 521 - 530. ISBN 978-0-9910009-5-1
[email protected] https://eprints.whiterose.ac.uk/
Reuse
Unless indicated otherwise, fulltext items are protected by copyright with all rights reserved. The copyright exception in section 29 of the Copyright, Designs and Patents Act 1988 allows the making of a single copy solely for the purpose of non-commercial research or private study within the limits of fair dealing. The publisher or other rights-holder may allow further reproduction and re-use of this version - refer to the White Rose Research Online record for this item. Where records identify the publisher as the copyright holder, users can verify any specific terms of use on the publisher’s website.
Takedown
If you consider content in White Rose Research Online to be in breach of UK law, please notify us by
NUMERICAL SIMULATION OF SPRING HYDROGRAPH
RECESSION CURVES FOR EVALUATING BEHAVIOR OF THE
EAST YORKSHIRE CHALK AQUIFER
Nozad Hasan Azeez
University of Leeds, Leeds LS2 9JT, [email protected]
L. Jared West
University of Leeds, Leeds LS2 9JT, [email protected]
Simon H. Bottrell
University of Leeds, Leeds LS2 9JT, [email protected]
Abstract
The Cretaceous Chalk aquifer is the most important in the UK for the provision of water to public supply and agriculture. The Chalk has both matrix and fracture porosity and is thus best considered as a dual porosity aquifer system. Although the matrix porosity is large, typically around 0.35 in the study area of East
Yorkshire, UK (ESI, 2010), pore diameters are typically very small, and the water contained in them is virtually immobile. The high permeability fracture network is responsible for the ability of water to drain; spatial variations in fracture network properties mean conventional approaches to aquifer characterization such as borehole pumping tests are of limited utility. Hence this study attempts to better understand the flow system and characterise aquifer properties from the recession response seen at springs during the
spring/summer period when recharge is minimal. This approach has the advantage that spring hydrographs represent the sum of the response from entire catchments.
This paper reports numerical modeling for simulating aquifer and spring responses during hydrological recession. Firstly, available geological and
hydrogeological information for the study area was used to develop hydrogeological conceptual models. Four different numerical models have been constructed representing four possible scenarios that could represent the aquifer in the selected area. These are: single reservoir aquifer, double reservoir aquifer, single reservoir aquifer with highly permeable vertical zone intersecting the spring location and single reservoir aquifer containing tunnel shaped highly permeable zone at the spring elevation respectively. The sensitivity of spring recession response to various external and internal parameter values was investigated, to
understand relations between spring recession, hydrological inputs (recharge) and aquifer structure. Spring hydrographs from the real aquifer were
compared with the hydrographs generated from models, in order to estimate aquifer properties. The work aims to identify the utility of spring hydrographs in eliciting aquifer permeability structure, as well as identifying the conceptual scenario which best represents the Chalk Aquifer in East Yorkshire, UK.
Introduction
The Chalk is the most significant aquifer in Britain it underlies much of the eastern and southern England. Groundwater from the Chalk aquifer of Yorkshire is an important resource for public supply, agriculture and industry.
Two types of porosity system have been recognized in the chalk rocks; primary and secondary porosity. The primary porosity is pore spaces formed between rock grains during rock formation processes, simply termed “matrix porosity”. Secondary porosity exists in the form of fractures which were produced by dissolution and tectonic activity (Singhal & Gupta 2010). This characteristic of dual porosity in the Chalk aquifer was confirmed by many studies ((Foster and Crease, 1974; Wellings & Bell 1980; Headworth;Price 1987;Price et al. 1993; Downing et al 2005; Mathias et al., 2005; Kime et al 2011).
The role of the porosity systems within the Chalk aquifer are as follows: the fracture system has very low porosity but high permeability which makes it
contributes (Allen et al. 1997; Gale & Rutter 2006). The storage co-efficient (specific yield) is also likely to derive from drainage of fracture space, rather than matrix porosity (MacDonald and Allen, 2001) .
Increases overburden with depth gave the chalk a significant feature which is developing permeability toward the top remarkably. Overburden affects the permeability in two ways, first reducing the fracture and aperture size. Second, because of lack of groundwater circulation it prevents processes of fracture enhancement due to dissolution ( Foster and Milton, 1974; Foster and Robertson, 1977; Price et al., 1977).
Hydrographs are graphical representations of the time series flow rate, generally consisting of three segments, rising limb, peak and falling limb respectively. The falling limb, which is also known as a recession curve, is that part of a hydrograph that comes after peak flow. Studying hydrograph recession curves of springs may provide hydrogeological information especially where fracture or conduit flows are significant. This approach is preferred over other geological and geophysical methods (Dreiss & Cruz 1982; Bakalowicz, 2005)) because the spring drains water from large areas of aquifer, so the discharge is governed by accumulative effect from the flow systems that exist in the aquifer. This contrasts with other geological and geophysical methods that only represent the aquifer locally at the investigation points.
Factors affecting hydrograph shape essentially grouped into two groups, external and internal factors. External factors include physiography, climate and vegetation which control recharge, while internal factors are the hydrogeological properties of the aquifer rocks, such as transmissivity (product of aquifer thickness and hydraulic conductivity). Precipitation intensity, duration and distribution over the catchment influence shape of the hydrograph; intensity and duration of rainfall strongly affect the peak flow. Temperature and humidity influence evapotranspiration and effective rainfall. Catchment size, shape, slope and morphology (surface depressions can act as natural water storage ponds) are important external factors.
It been reported from comparison between the spring hydrograph recession curve of different springs, that the recession curves steepness and shape (i.e. recession coefficients) are mainly governed by the intensity and geometry of fracture system (Kovács et al. 2005). Based on the analytical curve fitting method based on the Maillet exponential model, it has been suggested that the recession of spring hydrographs from fractured rock aquifers decomposes into several segments, each
segment reflecting different flow system in the aquifer (Kovács & Perrochet 2008; Liu 2012). However, the analysis of spring recession curves simulated by numerical modeling revealed that multiple segments do not necessarily reflect the presence of a multiple flow systems (Baedke and Krothe, 2001; Kovács 2003). In our study, we investigate the extent to which recession curve shape can provide information about the permeability structure and characteristics, using numerical simulations of flow in conceptual
permeability scenarios based on those potentially found within the case-study aquifer.
Site location and characterization:
The field study area is located at northern part of Yorkshire Wolds of the East Yorkshire, it occupies an area about 250 km2 (see Figure 1a). Two gauging station exist in the study area, one located at Kirby Grindalythe village in the NW of the study area and second one in Driffield town in the SE of the study area. This paper focusses on the Kirby Grindalythe catchment as this is closer to the topographic divide (see Figure 1b), so the catchment boundary conditions are easier to constrain.
The Cretaecous Chalk, crops out across the study area and is overlain by glacial sediments to the East. Chalk rocks rest unconformably on Jurassic rocks of the Penarth group (largely argillaceous) and Lias Group (mudstones and thin silty limestone). A schematic diagram of the Geological cross section in the area is illustrated in figure (1b).
The Gypsey Race is the most significant surface water course in the area, it rises through a series of springs just upstream of Kirkby Grindalythe village and runs eastwards to Bridlington. The Kirby Grindalythe gauging station measures the discharge in the upper reaches of the Gypsey Race, just downstream from these springs.
The unconfined Chalk aquifer is covered by a shallow rich sandy soil on the interfluves and by a lime-rich loamy soil along the water drainages and dry valleys. Both soil types allow the water to freely drain. Figure (1a) illustrates location of the study area.
Methodology:
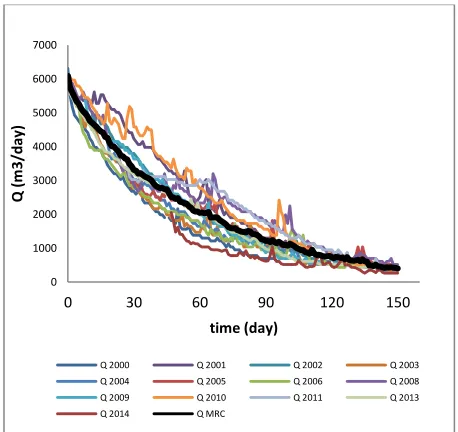
Metrological Office Rainfall and Evapotranspiration Calculation Systm MORECS database have been used to identify date of the cessation of recharge and hence the start of flow recession. Figure (2) shows hydrograph recession curves from the Kirby Grindalythe gauging station for selected hydrological years between 1998 and 2014.
Figure 1. a. Location of study area and surface geological map. b, Geological cross section through the study catchments.
As it appears in the figure starting time and length of the recession period was different from year to year, but generally began between February 15 to April 15 ( except 2000 when recession started mid of Jun), and recession end on early to late September .
Recession curves appeared variation in the peak flow at starting recession period, starting date and length of recession period between a different water years. to understanding relation between this variation in recession curves from same sources and rainfall the total annual effective rainfall have been calculated from climate data (from UK MORECS data) for the years between 2010 to 2014 and then plotted simultaneously
with hydrograph for same years. Figure (3) is graphically showing relation between annual total effective rainfall and spring hydrograph.
Figure 2. Hydrograph recession curves from Kirby Grindalythe gauging station for selected years 1998 to 2014 .
To overcome the problem of variation which exist between recession curves from different year a master recession curve MRC technique was used for
constructing a mean recession curve. Several approaches can be used for constructing a master recession curve: e.g. matching strip, correlation and tabulation method (Brownlee, 1960; Toebes and Strang, 1964; Hall, 1968; Toebes, 1969; Brutsaert and Nieber, 1977; Sugiyama, 1996). In this study the tabulation method was used as it is the most appropriate technique for constructing a MRC for a range of years. In the tabulation method the recession data at regular intervals of time are tabulated in columns, each recession in separate column. The columns are adjusted vertically until the discharge values approximately agree horizontally (figure 4). Finally, the average discharges are calculated, representing the master recession curve. Figure (5) shows construction of a master recession curve for the Kriby Grindalythe station.
The analytical model suggested by Maillet was used for initial interpretation of recession curves. This method is the most widely used approach for describing the flow depletion during recession period. The model is expressed by the equation:
0 1000 2000 3000 4000 5000 6000 7000 8000
31-Jan 01-Apr 31-May 30-Jul 28-Sep
Q
(
m
3
/se
c)
time
1998 1999 2000 2002 2003
2004 2008 2009 2010 2011
[image:4.612.73.298.171.522.2]Where and flow [L3/T] at time t [T] and the start of recession, is the recession coefficient [1/T].
Figure 3. A is annual total effective rainfall for years between 2010 to 2014 over Kirby Grindalythe and Driffield catchments.
B. Hydrograph for Kirby Grindaltyhe station. C. Hydrograph for Driffield station
MRC was tested with Maillet recession equation by plotting recession hydrograph on semi-log graph, discharge plotted on the log axes and time on the ordinary axes. it has shown a well fit with a single linear line on semi-log graph with recession coefficient (0.017 day-1), ( see figure 6 )
This paper next examines how recession curves relate to the aquifer permeability structure. Numerical modeling was used to investigate the response of the recession curve to different aquifer permeability scenarios. The models aimed to simulate the spring drainage for the real Chalk aquifer catchments in the area. Both Kirby Grindalythe and Driffield catchments were simulated, but only the former are presented here. Saturated thicknesses of the aquifer, boundary
conditions given by catchment water divides and geological information from previous studies were used
[image:5.612.72.246.106.411.2]in formulation of the conceptual model for each catchment.
Figure 4. This figure demonstrates the way of calculating MRC using the tabulation method.
Figure 5. MRC and recession curves from 2000 – 2014 at Kirby Grindalythe gauging station.
0 5000 10000 15000 20000 25000
2009 2010 2011 2012 2013 2014 2015
Q (m 3 /d ay )
C
0 100 200 300 400 500 600 700 8002010 2011 2012 2013 2014
EP (m m )
A
0 2000 4000 6000 8000 10000 12000 14000 160002009 2010 2011 2012 2013 2014 2015
Q (m 3 /d a y)
B
E P ( m m ) Q ( m 3 /d a y) Q ( m 3 /d a y) 0 1000 2000 3000 4000 5000 6000 70000 30 60 90 120 150
Q (m 3 /d a y ) time (day)
[image:5.612.313.542.471.687.2]Figure 6. showing analysis of MRC depending on Maillet model. (A) show plotting of recession curve on semi-log graph, the R¬2 between the MRC and fitted recession line is 0.99 and recession coefficient 0.017 1/day. (B) Black curve is MRC from observed discharge and red represent fitted curve to MRC which was calculated based on Maillet equation
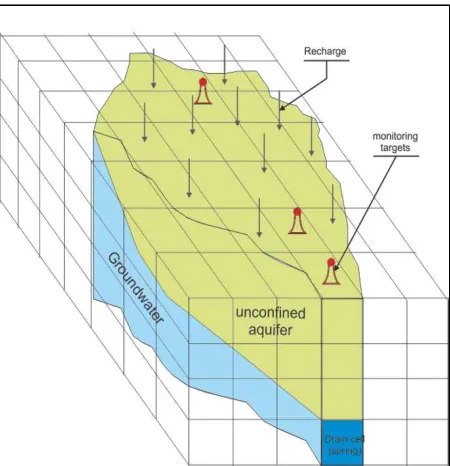
Figure ( 7 ) shows a conceptual model for the Kirkby Grindalythe catchment. Catchment boundaries were based on topography. The conceptual model was then translated into a numerical simulation grid. Figure (7) illustrates a schematic diagram of the 3D model grid
Groundwater flow model:
[image:6.612.72.300.90.353.2]A transient three dimensional numerical model was developed using Groundwater Vistas to simulate water drainage via a spring ( see figure 8). The model was discretized into a uniform grid of finite-difference cells consisting of 70 rows by 45 columns of 100 m x 100m cells and vertically with 15 layers of cells of 2 m thickness. To represent aquifer drainage via a spring during the recession period, no rainfall recharge was added; instead the model was run from an initial head representing that at the start of the recession period. The aquifer was modeled as unconfined; water depletes from the aquifer through a spring freely under the influence of the gravity. The spring was simulated using a drain cell located at the level of the base of the model with very high hydraulic conductivity so as not to mask the conductivity in the aquifer. The modeled
Figure 7. Conceptual model of Kirby Grindalythe catchment area. The red dashed line represents the groundwater divide, which was assumed to correspond to the topographic divide.
Catchment was surrounded by no-flow boundaries representing the catchment divide. The soil zone was not explicitly represented in the model, because soil permeability is high enough to allow rainfall infiltration at all times.
Four targets (representing monitoring wells) were placed along the mid-plane of the model containing the drain cell. One of the targets was located at the drain cell for the purpose of recording the flow during recession while other three targets were located at different distance upstream from drain cell (100 m, 1200 m and 2500 m) for monitoring hydraulic head
To investigate the effect of hydraulic conductivity heterogeneity on spring recession three scenarios were tested. All simulations had the same boundary and initial conditions. Figure (9 ) schematically shows the scenarios tested.
First Scenario (figure 9a): homogenous and isotropic aquifer.
Second Scenario (figure 9b): heterogeneous aquifer, consisting of two parallel horizontal reservoirs, with different hydraulic properties. The lower reservoir represents a high permeability zone, corresponding to zone just below the level of water table fluctuation, where the maximum flow occurs. This zone is
recognized to have very high hydraulic conductivity in chalk aquifers because of fracture enhancement due to calcite dissolution. The upper reservoir represents cumulative effect of the matrix, small fractures with lower permeability; this zone has been subjected to less
A
water flow so fracture solution enhancement is less well developed.
Figure 8. Schematic illustration of model grid for simulating spring recession in Chalk catchments in the study area (NB cells are shown larger than actual size relative to catchment dimensions for clarity).
the low permeable zone which symbolized by K1 occupied 22m of the total model thickness and high permeable zone symbolized by K2 occupied the 8m thickness of the model.
K1<K2
Third Scenario (figure 9c): A relatively low permeability aquifer contains a longitudinal-tunnel shaped high permeable zone at the drain cell level. This geometry represents a high permeability major fracture zone or solution conduit. The highly permeable zone works as the transporting medium and the less permeable surrounding rock as a storage reservoir. The high permeability zone is an elongated cuboid with the plan dimensions of 2000 m x100 m, and thickness of 8 m, located at the base of the model and at the level of drain cell.
Hydraulic conductivity sensitivity test:
Sensitivity tests for hydraulic conductivity (K) have been accomplished for all models. All the other
conditions and parameters stayed unchanged. The models were run with zero recharge and initial head of 30 m above model base. This thickness is based on the water table map of the area provided by the
Environment Agency . Storage coefficient and specific yield were set to fixed values of 0.0001 and 0.01 respectively (Allen et al. 1997;Gale & Rutter 2006; ESI, 2010).
Table (1) summarizes input values used for testing sensitivity to hydraulic conductivity; K represents the hydraulic conductivity in homogenous single reservoir aquifer model, K1 and K2 are hydraulic conductivity of low permeability and high permeability reservoirs respectively in the double reservoir aquifer models. Note that the hydraulic conductivity of the low permeability zones (K1) remained constant while conductivity value of high permeable zones (K2) were changed; this is because the high permeability zones have more significant impact on the recession curve.
The last stage of development was calibration of the models against recession data from field measurements. Calibration was accomplished by using the trial-and-error method (Anderson and Woessner, 2002 ). For the Kirby Grindalythe catchment model, both single reservoir and double reservoirs simulations were calibrated against field data. Figure (10) is
demonstrating result of calibration between observed MRC and the rescission curves obtained from the numerical models.
Results:
The recession curves from tunnel and double reservoirs model reveal that at the early stage of the recession period the flow rate falls rapidly then flattens off, see Figure (10). This pattern of recession for the tunnel model appears more clearly when the contrast between Hydraulic conductivity of the block and tunnel zone is bigger. The steep initial recession curve arises from rapid hydraulic head depletion within the highly permeability zone; the slower recession later reflects drainage behavior from the low permeability zone in the model.
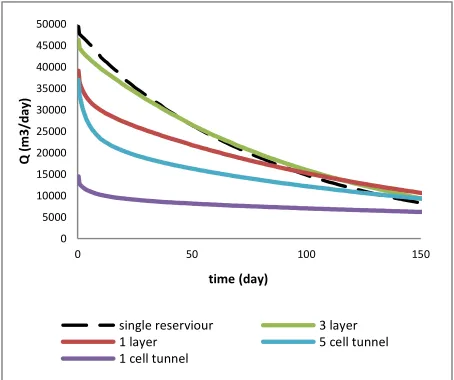
Recession curves from single and parallel horizontal reservoirs models are shown in figure 11; both models behave similarly where the thickness of high permeable zone within the parallel horizontal reservoir model was about 25% or more of the total aquifer thickness (black and green curves in figure 11).
aquifer to behave as a single reservoir aquifer with the same permeability as the high K layer. Where the highly permeable zone is thinner, e.g. representing only 10% of the model thickness, flow rates are reduced
[image:8.612.311.543.104.575.2]Figure 9 .A) Single reservoir aquifer. (B) Double reservoir aquifer, parallel reservoirs model. (C) Double reservoir, tunnel model.
Table 1. Values of hydraulic conductivity in m/day used for sensitivity test.
Figure 10. showing result of calibration between MRC and recession curve deduced from the tested numerical models.
test # 1 2 3 4 5 6
single reservoir
1 10 50 100 125 150
test # 1 2 3 4 5
2 parallel reservoirs & Tunnel model
K1
1 10 50 100 125 150 K
K2
0 1000 2000 3000 4000 5000 6000 7000
0 50 100 150
Q
(
m
3
/d
a
y
)
time (day)
K 2-100,t K 2-150,t K 2-50,t
K 2-50,p K 2-100,p K 2-150,p
[image:8.612.72.300.164.685.2]during calibration between MRC and models recession curve for the purpose of recognizing the tested models which able to be the best representative of the real aquifer all the recession curves (from MRC and models) have been analyzed using Maillet formula and then the results were compared. the result appears in table (2) , it reveal that the double reservoir (parallel reservoirs) and tunnel models required three segments during the curve fitting process, each segment with different recession coefficient. While, the recession curve from single reservoir model appeared as a single straight line on semi-log graph.
as it mentioned earlier that during analyzing MRC based on Maillet model, MRC was appeared as a single straight line on semi-log paper. This led the study to conclude that the single receiver model is more likely to be representative of the real aquifer in the area.
The coefficient of regression (R-squared) between recession curve from model and MRC for the period between 2000 to 2014 was 0.79 – the fit is not perfect because the model curve falls rather more steeply than the MRC initially and later flattens off more.
Nevertheless, the model curve does fall within the range of behavior seen in the recession curves for individual years.
Figure11. Showing effect of size of high permeability zone on the shape of recession curve. Black dashed line is from single reservoir aquifer, with hydraulic conductivity =100m/day. Solid green line is from parallel reservoir model when the high permeabity zone represents about 25% of total model volume. Solid red line is from parallel reservoir model when high permeability zone represents about 10% of total model volume. Solid blue line is from tunnel model when high permeability zone represents about 1% of total model volume. Solid purple line is from tunnel model when high permeability zone represents about 0.3% of total aquifer volume.
Note; in all double reservoirs models the K1= 1 m/day and K2= 100m/day
Table (2) show recession coefficient from models and MRC recession curves.
Model recession coefficient
1 2 3
K 2-100,t 0.080 0.013 0.003 K 2-150,t 0.058 0.010 0.003 K 2-50,t 0.065 0.013 0.003 K 2-50,p 0.058 0.008 0.003 K 2-100,p 0.067 0.011 0.004 K 2-150,p 0.103 0.019 0.006
K 125,s 0.013
MRC 0.017
.
The results from calibration tests for Kirby Grindalythe catchment suggests that the recession curve which was produced from the single reservoir model with a calibrated K value of 125 m/day show best agreement to the field recession curve , figure (10) . Given the initial model saturated thickness of 30m this indicates a maximum model transmissivity value of 3750 m2/day.
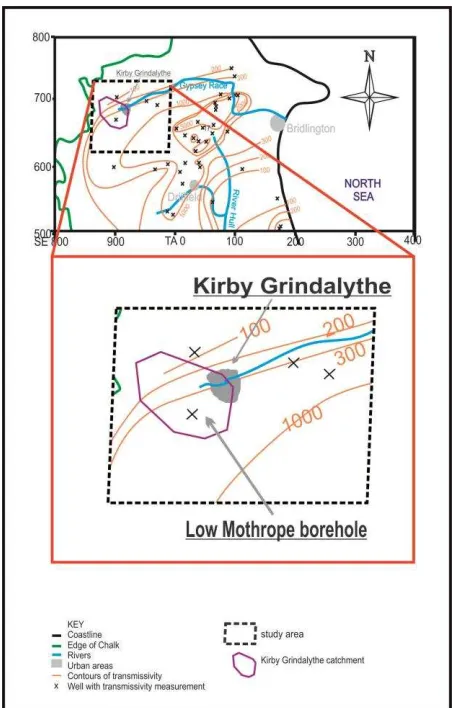
The mean transmissivity value in the Yorkshire Chalk is about 1250 m2/day obtained from borehole
measurements (Gale & Rutter 2006). A pumping test in a Low Mothrope borehole close to the catchment area shows a transmissivity value of 450 m2/day , (see figure 12), whereas pumping test at Etton south of the study area shown transmissivity values of 1000-2200 m2 /day (Gale & Rutter 2006). The above data suggests that the spring recession-derived T values may be higher than those likely to be observed in pumping tests. The recession derived K value of 125 m/day, agrees better with K found by calibrating numerical simulations (e.g. 4 to 170 m/day, University of Birmingham, 1978). This result suggests that spring hydrograph analysis can be a better choice for deriving hydraulic properties representative of the catchment scale than pumping tests, where complex fracture system are responsible for the permeability. In these cases, borehole tests may not be as representative, as they offer information only at and near the drilling site.
0 5000 10000 15000 20000 25000 30000 35000 40000 45000 50000
0 50 100 150
Q
(
m
3
/d
a
y
)
time (day)
single reserviour 3 layer
1 layer 5 cell tunnel
[image:9.612.71.298.393.583.2]Conclusion:
In this study we used numerical model for simulate Chalk aquifer drain by springs for the purpose studying aquifer behaviour from analysing hydrograph recession curve. Daily mean discharge data drained from Chalk aquifer at East Yorkshire with climate data ( SMD and AE) have been used for drawing hydrograph recession curve of the water discharge from the aquifer.
Hydrogeological and geological information were used to construct numerical model for the targeted aquifer. Three different scenarios been suggested to simulate the aquifer in the study area. Recession curves from models has calibrated with MRC of the measured discharge. The trial-and-error method was used to accomplish the calibration between observed and model recession curve. In addition ,the recession curves from the observed discharge and model discharge were analysed depending on the analytical exponential model which suggested by Maillet, the result from analytical model used also for calibrating the models curve with the observed discharge.
This study found that although Chalk aquifer is dual permeability system but the high permeable fracture system in the aquifer is the dominate flow system in the Chalk aquifer at the study area. Moreover, it revealed that in the complex fractured aquifer the hydraulic parameters which were measured through the boreholes may not be able to represent the entire aquifer.
transmissivity value which obtained from the models after calibration shown higher value than
transmissivity from the borehole locate in the area.
[image:10.612.314.540.69.423.2]References
Journal article, one author:
Bakalowicz, M. 2005. Karst groundwater: a challenge for new resources.
Hydrogeology Journal, 13(1), pp.148-160.
Dreiss, Shirley, J., 1982. Linear kernels for karst aquifers, Water Resources Research, v. 18, no. 4, p. 865-876.
Hall, F.R., 1968. Base flow recessions — a review. Water Resour. Res. 4 (5), 973– 983.
Sugiyama, H. (1996). ANALYSIS AND EXTRACTION OF LOW FLOW RECESSION CHARACTERISTICS. Journal of the American Water Resources Association, 32(3), pp.491-497.
Toebes, C. (1969). Base-flow-recession curves. Wellington, N.Z.: Water and Soil Division, Ministry of Works for the National Water and Soil Conservation Organization.
,
Journal article, two authors:
Baedke, S. J., and N. C. Krothe 2001, Derivation of effective hydraulic parameters of a Karst Aquifer from discharge hydrograph analysis, Water Resour. Res., 37(1), 13– 19.
Brutsaert, W. and Nieber, J. (1977). Regionalized drought flow hydrographs from a mature glaciated plateau. Water Resour. Res., 13(3), pp.637-643
Kovács, A. & Perrochet, P. 2008. A quantitative approach to spring hydrograph
decomposition. Journal of Hydrology, 352(1-2), pp.16–29
Foster, S. S. D. and Crease, I. 1974. Nitrate pollution of Chalk groundwater in East Yorkshire – a hydrogeological appraisal. Journal of the Institute of Water
Engineers & Scientists, 28, 178- 194. Foster, S.S.D. and Virginia A. Milton, 1974. The
permeaability and storage of an
unconfiend Chalk Aquifer. Hydrological Sciences Journal, 4.
Foster, S S D, and Robertson, A S. 1977. Evaluation of a semi-confined Chalk aquifer in East Anglia. Proceedings of the Institution of Civil Engineers, 63, 803–817
MacDonald, A. and Allen, D. (2001). Aquifer properties of the Chalk of England.
Journal of Engineering Geology and Hydrogeology, November 2001, v.34, p. 371-384,
Toebes C., Strang, D.D. 1994 ,On recession curves, 1. Recession equations. J. Hydrol. N.Z., pp. 2–15
Journal article, multiple authors:
KOVÁCS, A., PERROCHET, P., KIRÁLY, L. & JEANNIN, P.-Y. 2005. A quantitative method for the characterisation of karst aquifers based on spring hydrograph analysis. Journal of Hydrology, 303, 152-164.
MATHIAS, S. A., BUTLER, A. P., MCINTYRE, N. & WHEATER, H. S. 2005. The significance of flow in the matrix of the Chalk unsaturated zone. Journal of Hydrology, 310, 62-77
Price, M, Robertson, A S, and Foster, S S D. 1977. Chalk permeability — a study of vertical variation using water injection tests and borehole logging. Water Services, 81, 603–610.
WELLINGS, S. R. & BELL, J. P. 1980. Movement of water and nitrate in the unsaturated zone of Upper Chalk near Winchester, Hants., England. Journal of Hydrology, 48, 119-136.
Books, one author:
Brownlee, K. A. 1960, Statistical theory and Methodogloy in Science and Engineering, Weiley, New York
Books, specified edition, multiple authors: Mary P. Anderson and William W.
Woessner,2002. Groundwater Modeling Simulation of Flow and Adventive Transport. AP. Sand Diago ,New York, Boston
Singhal, B.B.S., R.P. Gupta, 2010, “Applied hydrogeology of fractured rocks, second edition
Editor of a book:
Downing, R. A., Price,\M. & Jones, G. P. (1993) The hydrogeology of the Chalk of north-west Europe. Clarendon Press, Oxford. 14-34.
London Special Publications, 34, 141-156.
R. A. Downing, M. Price, and G. P. Jones 2005, The Hydrogeology of the Chalk of North-West Europe, ed. book , Clarendon Press, Oxford.
Conference proceedings:
LIU, L. & LI, X. 2012. A Laboratory Study of Spring Hydrograph in Karst Triple Void
Media, Southwestern China. International
Conference On Civil Engineering And Urban Planning ;Yantai, China.
Thesis or dissertation:
Kovács, A., 2003. Geometry and hydraulic parameters of karst aquifers: a
hydrodynamic modeling approach[PhD’s thesis].
Parker, A. H. 2009. The distribution of
permeability in the Chalk aquifer of East Yorkshire.[ PhD thesis , University of Leeds].
Circulars and government reports:
Allen, D.J.; Brewerton, L.J.; Coleby, L.M.; Gibbs, B.R.; Lewis, M.A.; MacDonald,
A.M.; Wagstaff, S.J.; Williams, A.T.. 1997The physical properties of major aquifers in England and Wales. British Geological Survey, 333pp. (WD/97/034) (Unpublished)
ESI ,2010. East Yorkshire Chalk Aquifer condeptual model report. New Zealand House,160 Abbey Foregate, Shrewsbury, SY2 6FD, UK (Unpublished).
Gale, Ian; Rutter, Helen. 2006 The Chalk aquifer of Yorkshire. Keyworth, Nottingham, British Geological Survey, 62pp. (RR/06/004)