This is a repository copy of Search-Based Synthesis of Probabilistic Models for
Quality-of-Service Software Engineering.
White Rose Research Online URL for this paper:
http://eprints.whiterose.ac.uk/93144/
Version: Accepted Version
Proceedings Paper:
Gerasimou, Simos, Tamburrelli, Giordano and Calinescu, Radu
orcid.org/0000-0002-2678-9260 (2015) Search-Based Synthesis of Probabilistic Models
for Quality-of-Service Software Engineering. In: 30th IEEE/ACM International Conference
on Automated Software Engineering (ASE 2015). .
[email protected]
https://eprints.whiterose.ac.uk/
Reuse
Items deposited in White Rose Research Online are protected by copyright, with all rights reserved unless
indicated otherwise. They may be downloaded and/or printed for private study, or other acts as permitted by
national copyright laws. The publisher or other rights holders may allow further reproduction and re-use of
the full text version. This is indicated by the licence information on the White Rose Research Online record
for the item.
Takedown
If you consider content in White Rose Research Online to be in breach of UK law, please notify us by
Search-Based Synthesis of Probabilistic Models
for Quality-of-Service Software Engineering
Simos Gerasimou
Dept. of Computer Science University of York, UK
[email protected]
Giordano Tamburrelli
Dept. of Computer Sciences Vrije Universiteit, Netherlands
[email protected]
Radu Calinescu
Dept. of Computer Science University of York, UK
[email protected]
ABSTRACT
The formal verification of finite-state probabilistic models supports the engineering of software with strict quality-of-service (QoS) requirements. However, its use in software design is currently a tedious process of manual multiobjec-tive optimisation. Software designers must build and ver-ify probabilistic models for numerous alternative architec-tures and instantiations of the system parameters. When successful, they end up with feasible but often suboptimal models. The EvoChecker search-based software engineering approach and tool introduced in our paper employ multi-objective optimisation genetic algorithms to automate this process and considerably improve its outcome. We evaluate EvoChecker for six variants of two software systems from the domains of dynamic power management and foreign ex-change trading. These systems are characterised by different types of design parameters and QoS requirements, and their design spaces comprise between 2E+14 and 7.22E+86 rele-vant alternative designs. Our results provide strong evidence that EvoChecker significantly outperforms the current prac-tice and yields actionable insights for software designers.
1.
INTRODUCTION
The design of modern software systems requires tools capa-ble of assessing the quality and dependability of the solution under design as early as possible in the engineering process. The late discovery of defects leads to suboptimal operation of the delivered systems, high maintenance costs, and neg-ative impact on their users [14, 25]. This is particularly relevant for business-critical and safety-critical applications, where failures may cause financial loss or loss of human life.
Model Checking (MC) [8, 24] is among the most effective means for developing software for critical applications [59]. Given a finite-state transition model of a concurrent system, MC automatically verifies if the model satisfies requirements formally expressed in propositional temporal logic. MC can be exploited during system design, to devise models that meet the requirements of a software system, and are then
used as a basis for its implementation. Alternatively, soft-ware engineers can build models of existing systems, and use MC to check their compliance with requirements. Further-more, a variant of MC called probabilistic model checking can verify if software systems meet their reliability, perfor-mance and other quality-of-service (QoS) requirements [44]. Probabilistic MC verifies models with state transitions an-notated by probabilities or transition rates (e.g., discrete and continuous-time Markov chains, and Markov decision processes), and operates with QoS requirements specified in probabilistic variants of temporal logics.
This paper is concerned with the use of probabilistic MC at design time to identify models that satisfy the QoS require-ments of a software system. Currently, this is a tedious trial-and-error process in which software designers must build and verify probabilistic models for numerous alternative archi-tectures and instantiations of the system parameters. Even when this manual attempt at multiobjective optimisation is successful, the models produced are often suboptimal in terms of their tradeoffs between reliability, performance, cost and other QoS requirements. The EvoChecker search-based software engineering approach introduced in our paper au-tomates this process and considerably improves its outcome.
To this end, EvoChecker synthesises (a) a set of probabilistic models that closely approximates the Pareto-optimal model set associated with the QoS requirements of a software sys-tem; and (b) the corresponding approximate QoS Pareto front. This provides insight into the tradeoffs between mul-tiple QoS requirements, enabling software designers to make informed decisions about the architecture and parameters of their systems. To achieve this, EvoChecker employs estab-lished multiobjective optimisation genetic algorithms (MO-GAs) and a fitness function that captures the satisfaction of the QoS requirements. EvoChecker uses as input:
• a probabilistic model template that encodes alternative architectures and parameter ranges for the system; • a set of QoS requirements specifying both constraints
The main contributions of our paper include:
1. The EvoChecker extension of the PRISM modelling lan-guage, and the EvoChecker search-based model synthesis approach, which we describe in Section 3, and we illus-trate using a running example introduced in Section 2. 2. The definition of theprobabilistic model synthesis problem
(Section 3.3).
3. The open-source EvoChecker tool presented in Section 4, which we make freely available on our project webpage. 4. An extensive evaluation of the EvoChecker approach and
prototype tool in two case studies drawn from different application domains, which we summarise in Section 5.
Our evaluation based on established Pareto-front quality dicators (i.e., unary epsilon [66], hypervolume [65] and in-verted generational distance [58]) shows that EvoChecker significantly outperforms the current “trial and error” prac-tice, makes effective use of state-of-the-art MOGAs such as NSGA-II [26], SPEA2 [49] and MOCell [64], and provides actionable insights for software designers.
To the best of our knowledge, EvoChecker is the first ap-proach that uses search-based software engineering to syn-thesise approximate Pareto-optimal sets of probabilistic mod-els for the QoS requirements of software systems. The only related work we are aware of is discussed in Section 6, and belongs to the area ofmodel repair[10, 16]. However, model repair for probabilistic systems focuses on modifying an ex-isting probabilistic model, only at transition probability level, and only to satisfy a single temporal logic property that is violated by the original model. In contrast, EvoChecker han-dles multiple QoS requirements and uses multiobjective op-timisation to derive an approximate Pareto-optimal set of probabilistic models and its associated Pareto front starting from a probabilistic model template.
2.
RUNNING EXAMPLE
[image:3.595.315.557.51.219.2]We will illustrate the EvoChecker components and opera-tion using a software-controlled dynamic power management (DPM) system adapted from [53, 56]. As shown in Fig. 1, the system consists of a service provider that handles re-quests generated by a service requester and stored in two request queues of different priorities. The service provider has four states associated with different power usage, i.e., busy, idle, standby and sleep. Fig. 1 depicts the power us-age of each state (in watts), the possible transitions between states, and the energy consumed by each transitions (in joules). These values are taken from [53], and correspond to a Fujitsu disk drive.
Table 1: Types of models supported by EvoChecker
Type of QoS requirement
probabilistic model specification logic
Discrete-time Markov chains PCTLa, LTLb, PCTL*c
Continuous-time Markov chains CSLd
Markov decision processes PCTLa, LTLb, PCTL*c
Probabilistic automata PCTLa, LTLb, PCTL*c
Probabilistic timed automata PCTLa
a
Probabilistic Computation Tree Logic [13, 34] b
Linear Temporal Logic [51] c
PCTL* is a superset of PCTL and LTL d
Continuous Stochastic Logic [7, 9]
Power manager
High-priority request queue
Low-priority request queue
busy 2.15W
idle 0.95W
standby 0.35W
sleep 0.13W Service
5.1J 0.006J
7J 0.067J 2J
0.001J
0J 0J state
information state-transitioncommands
qL QmaxL
qH QmaxH Dynamic power
management system
provider
[image:3.595.317.556.263.325.2]Service requester
[image:3.595.57.291.604.691.2]Figure 1: Dynamic power management system
Table 2: Average service-provider transition times
State Average State Average
transition time (s) transition time (s)
idle→standby 0.4 standby→idle 1.2
idle→sleep 0.67 sleep→idle 1.6
standby→sleep 0.3 sleep→standby 0.6
When the service provider is in the busy state, it processes requests as follows. If the high-priority queue containsqH> 0 requests, then a high-priority request is processed. Oth-erwise, if the low-priority queue contains requests (i.e., if
qL >0), a low-priority request is handled. After handling the last request (i.e., when both queues become empty), the service provider automatically transitions to theidle state. The transitions fromidletobusyare also automatic, and oc-cur whenever the empty-queue DPM system receives a new request. In contrast, all the other transitions are controlled by a softwarepower managerthat aims to reduce power use while maintaining an acceptable service level for the system. We use the real values from [53] for the state transition times (Table 2) and the request service rate (i.e., 125s−1), and we
assume average arrival rates of 0.05s−1 and 0.15s−1 for the
high-priority and low-priority requests, respectively.
Finally, suppose that the DPM system designer must select: 1. the capacity of the request queues,QmaxHandQmaxL; 2. one of two alternative power managers (described later); 3. the parameters of the selected power manager
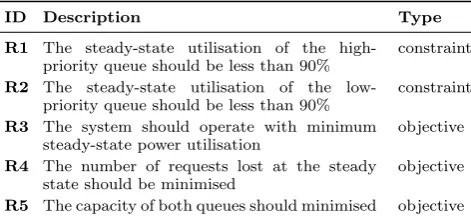
such that the QoS requirements in Table 3 are satisfied.
Table 3: QoS requirements for the DPM system
ID Description Type
R1 The steady-state utilisation of the
high-priority queue should be less than 90%
constraint
R2 The steady-state utilisation of the
low-priority queue should be less than 90%
constraint
R3 The system should operate with minimum
steady-state power utilisation
objective
R4 The number of requests lost at the steady
state should be minimised
objective
[image:3.595.320.556.614.724.2]3.
EvoChecker
3.1
Modelling Language
EvoChecker probabilistic model templates are specified in an extended version of the PRISM high-level modelling lan-guage [45]. This lanlan-guage is based on the Reactive Modules formalism [3], which describes a system as the parallel com-position of a set ofmodules. The state of amoduleis encoded by a set of finite-range local variables, and its state transi-tions are defined by probabilistic guarded commands that change these variables, and have the general form:
[action]guard−> e1:update1+. . .+en:updaten; (1) In this command, guard is a boolean expression over all the variables in the model. Ifguard evaluates totrue, the arithmetic expression ei, 1 ≤ i ≤ n, gives the probabil-ity (for discrete-time models) or rate (for continuous-time models) with which theupdatei change of the module vari-ables occurs. Theactionis optional; when present, it forces all modules comprising commands with thisaction to per-form one of these commands simultaneously (i.e., to syn-chronise). For a detailed description of the PRISM mod-elling language, we refer the reader to the PRISM manual, available athttp://www.prismmodelchecker.org/manual.
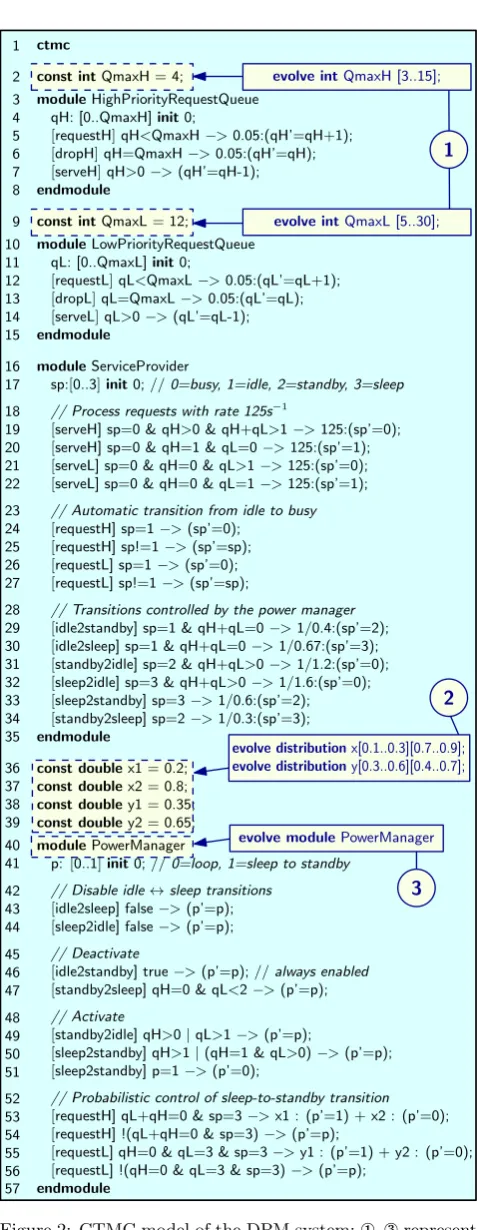
Example 1. Fig. 2 shows the continuous-time Markov chain (CTMC) model of the dynamic power management system from our running example. The model comprises a module for each request queue, aServiceProvidermodule, and a module for one of the two power managers consid-ered during the design of the system. The local variables from the high-priority and low-priority request queue mod-ules record the number of requests from the two queues,qH andqL, and theServiceProviderlocal variablespencodes the state of the service provider. The queue modules and Ser-viceProvidersynchronise through the actionsrequestH,Land serveH,L, which reflect requests arriving into the queues and being served, respectively. The service provider switches be-tween itsbusyandidlestates automatically (lines 20, 22, 24 and 26), and can also perform the state transitions from Table 2, aiming to switch to lower-power states when both request queues are empty (i.e.,qH+qL= 0) and back to-wards thebusystate otherwise (lines 28–34). However, these transitions are controlled by the power manager through the synchronisation of allServiceProviderandPowerManager commands with common actions. For example, lines 43–44 have falseguards and thus disable the transitions between idle and sleep, the transition between idle and standby is always enabled due to thetrue guard in line 46, and con-straints are placed on all other transitions.
Software designers use probabilistic models to manually ex-plore an often very large design space comprising alternative module implementations, parameter values and transition probabilities. EvoChecker extends the PRISM modelling language with three constructs that support the specifica-tion of all these design alternatives within a probabilistic model template whose instantiations correspond to possible system designs. The three constructs are defined below.
1. Evolvable parameters.EvoChecker uses the syntax evolve intparam[min..max];
evolve doubleparam[min..max]; (2)
to declare model parameters of type ‘int’ and ‘double’, re-spectively, and acceptable ranges for them. These
param-1
2
evolve modulePowerManager
3 1
2 3 4 5 6 7 8
9 10 11 12 13 14 15
16 17
18 19 20 21 22
23 24 25 26 27
28 29 30 31 32 33 34 35
36 37 38 39 40 41
42 43 44
45 46 47
48 49 50 51
52 53 54 55 56 57
evolve intQmaxH [3..15];
evolve intQmaxL [5..30];
evolve distributionx[0.1..0.3][0.7..0.9];
evolve distributiony[0.3..0.6][0.4..0.7]; ctmc
const intQmaxH = 4;
moduleHighPriorityRequestQueue
[image:4.595.317.556.39.655.2]qH: [0..QmaxH]init0;
[requestH]qH<QmaxH−>0.05:(qH’=qH+1);
[dropH]qH=QmaxH−>0.05:(qH’=qH);
[serveH]qH>0−>(qH’=qH-1); endmodule
const intQmaxL = 12; moduleLowPriorityRequestQueue
qL: [0..QmaxL]init0;
[requestL]qL<QmaxL−>0.05:(qL’=qL+1); [dropL]qL=QmaxL−>0.05:(qL’=qL); [serveL]qL>0−>(qL’=qL-1); endmodule
moduleServiceProvider
sp:[0..3]init0; //0=busy, 1=idle, 2=standby, 3=sleep
// Process requests with rate 125s−1
[serveH] sp=0 & qH>0 & qH+qL>1−>125:(sp’=0); [serveH] sp=0 & qH=1 & qL=0−>125:(sp’=1); [serveL] sp=0 & qH=0 & qL>1−>125:(sp’=0); [serveL] sp=0 & qH=0 & qL=1−>125:(sp’=1); // Automatic transition from idle to busy [requestH] sp=1−>(sp’=0);
[requestH] sp!=1−>(sp’=sp); [requestL] sp=1−>(sp’=0); [requestL] sp!=1−>(sp’=sp);
// Transitions controlled by the power manager [idle2standby] sp=1 & qH+qL=0−>1/0.4:(sp’=2); [idle2sleep] sp=1 & qH+qL=0−>1/0.67:(sp’=3); [standby2idle] sp=2 & qH+qL>0−>1/1.2:(sp’=0); [sleep2idle] sp=3 & qH+qL>0−>1/1.6:(sp’=0); [sleep2standby] sp=3−>1/0.6:(sp’=2); [standby2sleep] sp=2−>1/0.3:(sp’=3); endmodule
const doublex1 = 0.2; const doublex2 = 0.8; const doubley1 = 0.35; const doubley2 = 0.65; modulePowerManager
p:[0..1]init0; //0=loop, 1=sleep to standby // Disable idle↔sleep transitions
[idle2sleep] false−>(p’=p); [sleep2idle] false−>(p’=p); // Deactivate
[idle2standby] true−>(p’=p); //always enabled [standby2sleep] qH=0 & qL<2−>(p’=p); // Activate
[standby2idle] qH>0|qL>1−>(p’=p);
[sleep2standby] qH>1|(qH=1 & qL>0)−>(p’=p); [sleep2standby] p=1−>(p’=0);
// Probabilistic control of sleep-to-standby transition [requestH] qL+qH=0 & sp=3−>x1 : (p’=1) + x2 : (p’=0); [requestH] !(qL+qH=0 & sp=3)−>(p’=p);
[requestL] qH=0 & qL=3 & sp=3−>y1 : (p’=1) + y2 : (p’=0); [requestL] !(qH=0 & qL=3 & sp=3)−>(p’=p);
endmodule
Figure 2: CTMC model of the DPM system;¬–®represent EvoChecker extensions of the PRISM modelling language
2. Evolvable probability distributions. The syntax
evolve distributiondist[min1..max1]. . .[minn..maxn]; (3) where [mini,maxi] ⊆ [0,1] for all 1 ≤ i ≤ n, is used to declare an n-element discrete probability distribution, and ranges for thenprobabilities of the distribution. The name of the distribution can then be used instead of expressions
e1,e2, . . . ,enfrom ann-element command (1). 3. Evolvable modules.EvoChecker uses the syntax
evolve modulemod implementation1 endmodule
. . .
evolve modulemod implementationnendmodule (4)
to definen≥2 alternative implementations of a module.
The role of the three EvoChecker constructs is described by the following definitions.
Definition 1. A valid PRISM probabilistic model aug-mented with a set of EvoChecker constructs (2)–(4) is called aprobabilistic model template.
Definition 2. A probabilistic model is aninstance of a probabilistic model templateT if and only if it can obtained fromT using the following transformations:
• Each evolvable parameter (2) is replaced by a ‘const int param = val;’ or ‘const doubleparam = val;’ declaration (depending on the type of the parameter), where val∈ {min, . . . , max}orval∈[min..max], respectively. • Each evolvable probability distribution (3) is removed,
and thenoccurrences of its name instead of expressions
e1, . . . , en of a command (1) are replaced with values from the ranges [min1..max1], . . . , [minn..maxn], respec-tively, such that the sum of thenvalues is 1.0.
• Each set of evolvable modules with the same name is replaced with a single element from the set, from which the keyword ‘evolve’ was removed.
Definition 3. The set of all probabilistic models that are instances of a probabilistic model templateT is called thedesign space ofT, and is denotedDST
.
Example 2. Fig. 2 illustrates the three EvoChecker con-structs used to transform the CTMC model from our run-ning example into a probabilistic model template. The re-placement of the elements from the dashed rectangles with those from the continuous rectangles shows how: ¬ two evolvable parameters are used to specify the sizes of the two request queues;two evolvable distributions are used to specify the transition probabilities from lines 53 and 55 of the power manager; and®the modulePowerManageris de-clared one of several possible implementations of the power manager. Note that at least one additional implementation of this module needs to be provided in a valid probabilistic model template; due to space constraints, the second imple-mentation is not included here, but we make it available at http://www-users.cs.york.ac.uk/~simos/EvoChecker.
3.2
Quality-of-Service Requirements
EvoChecker supports two types of QoS requirements: con-straintsandoptimisation objectives. Both types refer to QoS
attributes of the system under design, such as response time, throughput, reliability or cost. Constraints define bounds for the acceptable values of these attributes, while optimi-sation objectives specify QoS attributes that should be min-imised or maxmin-imised (subject to all constraints being satis-fied). Without loss of generality, we will assume that the latter QoS attributes should be minimised in the remain-der of the paper. Formally, a software system consiremain-dered by EvoChecker needs to satisfyn1≥0 constraints of the form
RC
i : attri⊲⊳iboundi, 1≤i≤n1, (5)
andn2≥1 optimisation objectives of the form
ROi : minimiseattri, n1+ 1≤i≤n1+n2, (6)
where⊲⊳i∈ {<,≤,=,≥, >}andboundi∈Rfor all 1≤i≤n1,
and attr1,attr2, . . . ,attrn1+n2 ∈ Rrepresent n1 +n2 QoS
attributes of the system. These QoS attributes are formally expressed in the probabilistic temporal logics shown earlier in Table 1. Given a probabilistic model M of a possible system design, and the probabilistic temporal logic formulae Φ1, Φ2, . . . , Φn1+n2 of the QoS attributes, the probabilistic model checker PRISM [45, 46] automatically establishes the value of the QoS attributes corresponding to this design, i.e.,
attri(M) =PMC(M,Φi), 1≤i≤n1+n2. (7)
Due to space constraints, we do not present the probabilis-tic temporal logics supported by EvoChecker; references to detailed descriptions of each logic are provided in Table 1.
Example 3. The QoS requirements from our running ex-ample (Table 3) comprise two constraints (R1andR2), and three optimisation objectives (R3–R5). The QoS attributes for all requirements are specified usingrewardsprobabilistic temporal logic formulae [4, 40, 44]. To this end, positive val-ues are associated with specific states and transitions of the CTMC in Fig. 2 by usingrewards. . . endrewardsstructures. For example, the structure below enables the computation of the total number of lost requests for requirement R4:
rewards“TotalLost” [dropH]true : 1; [dropL]true : 1;
endrewards
by associating a value of 1 with each transition that corre-sponds to a request being dropped because of a full queue. The corresponding temporal logic formula is Φ4=RTotalLost=? [S],
and represents the “Steady-state reward” for the above re-wards structure, i.e., the long-run average number of dropped requests for the system.
3.3
Probabilistic Model Synthesis Problem
Consider a probabilistic model templateT with design space DST
, and a set of QoS requirements comprising n1
con-straints (5) andn2 optimisation objectives (6). The
proba-bilistic model synthesis problem involves finding the Pareto-optimal design set PS of models fromDST
that satisfy the
n1 constraints and arenon-dominated with respect to the
n2optimisation objectives:
PS=
M ∈DST
|(∀1≤i≤n1•attri(M)⊲⊳iboundi)∧ ∄M′
∈DST
• M′
≺ M ,
Table 4: EvoChecker gene encoding rules
evolve intparam[min..max];
evolve doubleparam[min..max];
evolve distributiondist[min1..max1]. . . . . .[minn..maxn];
evolve modulemod implementation1endmodule . . .
evolve modulemod implementationmendmodule
EvoChecker gene(s)
Type Cardinality Value range,Vi
int
double
double
int 1
1
n
1
Evolvable feature
of the probabilistic model template
{min,...,max}
[min..max]
[min1..max1]
. . . [minn..maxn]
{1,2, ..., m}
with thedominance relation ≺:DST
×DST
→Bdefined by
∀M1,M2∈DS
T
• M1≺ M2≡
∀n1+ 1≤i≤n1+n2•attri(M1)≤attri(M2)∧
∃n1+ 1≤i≤n1+n2•attri(M1)<attri(M2).
Finally, given the Pareto-optimal design setPS, we are also interested in thePareto front defined by
PF ={(an1+1, an1+2, . . . , an1+n2)∈Rn2|
∃M ∈PS • ∀n1+ 1≤i≤n1+n2•ai=attri(M)}, (9) since designers need this information alongside their domain knowledge when choosing between the models inP S.
3.4
EvoChecker Model Synthesis
Computing the Pareto-optimal design set (8) is in most cases unfeasible, as the design space DST
[image:6.595.56.295.69.196.2]is typically extremely large and may be infinite (i.e., when the probabilistic model template T contains evolvable parameters of type double and/or evolvable distributions). Therefore, EvoChecker uses elitist genetic algorithms for multiobjective optimisation(e.g., [26, 49, 64]) to synthesise a set of probabilistic models that closely approximates this Pareto-optimal set.
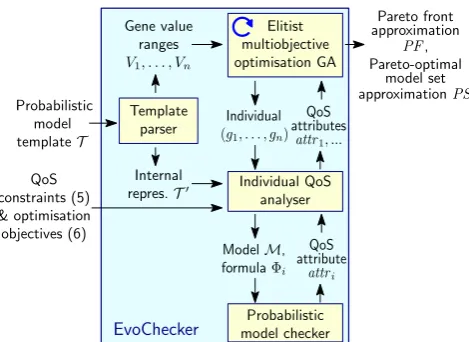
Agenetic algorithm(GA) [43] encodes possible solutions of a search problem as a sequence ofgenes (i.e., binary repre-sentations of the problem variables). For EvoChecker, each instance of an ‘evolvable’ construct from Section 3.1 con-tributes to this sequence with the gene(s) given by the en-coding rules in Table 4. These rules are used by theTemplate parserfrom the high-level EvoChecker architecture in Fig. 3 to extract the value rangesV1, V2, . . . , Vnfor then≥1 genes associated with the model templateT.
Given the solution encoding described above, GAs start with a randomly generated set (population) of feasible solutions (individuals). This population is then iteratively evolved into populations containing “fitter” individuals by means of GAselection,crossover andmutation. Selection uses a real-valuedfitness function to evaluate each individual created during the GA execution, in order to select the population for the next iteration and the mating pool of individuals for the current iteration. Crossover randomly selects two individuals from the mating pool, and generates a new indi-vidual by combining their genes. Finally, mutation produces a new individual by randomly modifying some of the genes of an individual from the pool. GAs terminate after a fixed number of (individual) evaluations or when a predetermined number of successive iterations generate populations with no significantly fitter individuals.
Template parser Gene value
ranges
V1, . . . , Vn
Elitist multiobjective optimisation GA
Internal
repres.T′ Individual QoS analyser
Probabilistic model checker Individual (g1, . . . , gn)
QoS attributes
attr1, ...
ModelM, formulaΦi
QoS attribute
attri Probabilistic
model templateT
Pareto front approximation
PF, Pareto-optimal
model set approximationPS
EvoChecker
QoS constraints (5) & optimisation objectives (6)
Figure 3: High-level EvoChecker architecture
As shown in Fig. 3, the GA used by EvoChecker is elitist, i.e., it preserves the best individuals across iterations. This involves maintaining a finite “archive” of the fittest individu-als (e.g., by elitist GAs like MOCell [49] and SPEA2 [64]) or by retaining the fittest individuals from one iteration to the next (e.g., by NSGA-II [26]). The algorithms used by Evo-Checker are alsomultiobjective optimisation GAs(MOGAs), i.e., they generate Pareto-optimal set approximations spread as uniformly as possible across the search space. Therefore, they use fitness functions that encode in ways specific to each MOGA both thenondomination level of each evaluated in-dividual and thepopulation density in its area of the search space. For example, NSGA-II [26] associates a nondomi-nance level of 1 to all nondominated individuals of a popu-lation, a level of 2 to the individuals that are not dominated when level-1 individuals are ignored, etc.1; and SPEA2 [64]
evaluates population density as the inverse of the distance to thek-th nearest neighbour of the individual. Providing full technical details about the MOGAs that EvoChecker can use is beyond the scope of this paper. The reader can find their descriptions in [26, 49, 64], and a comparison of their relative merits in [28].
In EvoChecker the MOGA evaluation of the fitness of indi-viduals is supported by anIndividual QoS analyser (Fig. 3). This component takes as input the gene sequence (g1, . . . , gn) for an individual, and returns to the MOGA the QoS at-tributes attr1,attr2, . . . ,attrn1+n2 of the model M associ-ated with this individual. To this end, the analyser uses an internal representation T′
of the model template produced by theTemplate parserand the gene sequence (g1, . . . , gn) to obtain the modelM, and then invokes aProbabilistic model checkerto establish then1+n2 QoS attributes from (7) one
at a time. This setup enables the MOGA to generate ap-proximations of the Pareto-optimal model setPS and of the associated Pareto frontPF as illustrated in Fig. 3.
Example 4. Consider again the DPM system from our running example. Using the rules in Table 4, EvoChecker en-codes each instanceMof the probabilistic model template from Fig. 2 as the sequence of genes
(QmaxH,QmaxL, x1, x2, y1, y2,pm), (10) 1Individuals not satisfying problem constraints are assigned
1.4 1.6 1.8 2.0 Power use [W]
0.06 0.08 0.1 0.12 Lost requests
2 4 6 8 10
Queue length
[image:7.595.319.553.51.240.2](qH+qL)
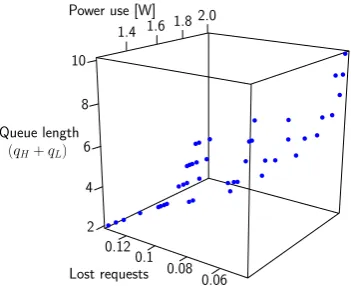
Figure 4: Pareto front approximation for the DPM system
where QmaxH ∈ V1 = {3,4, . . . ,15} and QmaxL∈ V2 =
{5,6, . . . ,30} represent the capacities of the two queues;
x1 ∈ V3 = [0.1,0.3] and x2 ∈ V4 = [0.7,0.9] such that
x1+x2= 1, andy1∈V5= [0.3,0.6] andy2∈V6= [0.4,0.7]
such that y1 +y2 = 1 represent the two probability
dis-tributions; and pm ∈ V7 = {1,2} is a gene that encodes
which of them = 2 implementations of thePowerManager module in Fig. 2 is used byM. The gene value ranges V1
toV7 are extracted by the EvoCheckerTemplate parserand
passed to the MOGA, which uses theIndividual QoS anal-yserto iteratively generate model populations of increasing fitness and eventually outputs the Pareto front and Pareto-optimal set approximations achieved after a pre-established number of evaluations. As an example, Fig. 4 depicts a Pareto front approximation obtained using NSGA-II [26] as the EvoChecker MOGA, with an initial population of 150 individuals and after 5000 evaluations. Remember that the dimensionality of Pareto front for a probabilistic model syn-thesis problem is given by the number of optimisation ob-jectivesn2. Our DPM system hasn2 = 3 optimisation
ob-jectives, as shown in Table 3.
4.
EvoChecker TOOL
To automate the EvoChecker synthesis of probabilistic mod-els, we implemented a tool with the architecture in Fig. 3. Our EvoChecker tool uses the established MOGA imple-mentations provided by the Java-based framework for multi-objective optimization with metaheuristics JMetal [27], and the probabilistic model checker PRISM [45]. We developed the other components of the architecture from Fig. 3 in Java, using the Antlr2parser generator to build theTemplate
parser, and implementing an Individual QoS analyser specif-ically for the EvoChecker tool. The open-source code of EvoChecker, the full experimental results summarised in the following section, additional information about EvoChecker and the case studies used for its evaluation are available at http://www-users.cs.york.ac.uk/~simos/EvoChecker.
5.
EVALUATION
5.1
Research Questions
We evaluated the effectiveness of EvoChecker by performing extensive experiments to answer the next research questions.
RQ1 (Validation): How does EvoChecker perform
compared to random search? We used this research
2
[image:7.595.86.262.52.195.2]http://www.antlr.org
Figure 5: The FX workflow
question to establish if EvoChecker “comfortably outperforms a random search” [38], as expected of effective search-based software engineering solutions.
RQ2 (Comparison): How do EvoChecker instances using different MOGAs perform compared to each
other? Since we devised EvoChecker to work with any
MOGA, we examined the results produced by EvoChecker in-stances using three established such algorithms (i.e., NSGA-II [26], SPEA2 [64] and MOCell [49]).
RQ3 (Insights): Can EvoChecker provide insights into the trade-offs between the QoS attributes of al-ternative software architectures and configurations? To support software designers in their decision making, Evo-Checker must provide insights into the trade-offs between multiple QoS objectives. To address this question, we identi-fied a range of design decisions suggested by the EvoChecker results for the software systems considered in our evaluation.
5.2
Analysed Software Systems
Our experiments used EvoChecker in multiple scenarios as-sociated with two software systems from different applica-tion domains—the dynamic power management (DPM) sys-tem from our running example, and a real-world service-based system from the area of foreign exchange trading. The second system, which we anonymise as FX for confidentiality reasons, is used by an European foreign exchange brokerage company, and implements the workflow in Fig. 5.
a country using a Fundamental analysis service that col-lects, analyses and evaluates information such as news re-ports, economic data and political events, and provides an assessment on the country’s currency. If satisfied with this assessment, the trader can use theOrder service to sell or buy currency, in which case aNotification service confirms the completion of the trade.
We assume that the FX designer has to select third-party implementations for each of then≤1 services from Fig. 5 for which in-house implementations are not available, in order to meet the QoS requirements from Table 5. The designer can use any subset of theni ≥1 third-party implementa-tions of thei-th service unavailable in-house, and either a probabilistic or a sequential selection strategy. The prob-abilistic strategy involves using a randomly selected third-party service from the subset for each invocation of service
i, where the random selection is made according to a dis-crete probability distribution decided by the designer. The sequential strategy involves invoking the services from the subset in a designer-specified order, until one of the in-vocations is successful or all the inin-vocations failed. We used an EvoChecker probabilistic model template to cap-ture these alternative FX designs. This template uses all EvoChecker “evolvable” constructs, and is parameterised by the number of servicesn, the number of third-party service implementationsn1,n2, . . . , and by the costs, success
prob-abilities and response times of these implementations.
To evaluate EvoChecker for multiple design space sizes, we applied it to each of the system variants from Table 6. The entries in this table list the int-valued probabilistic model template parameters from (10)—for the DPM system, and described above—for the FX system. The ‘Size’ column re-ports the size of the design space that an exhaustive search would need to explore, assuming two-decimal precision for thedouble-valued parameters of the probabilistic model tem-plates (cf. Table 4). This is a valid assumption, as the nonlinearity of most probabilistic models means that a 0.01 change in a state transition probability often translates into significant changes in the values of model properties. Finally, note that then= 8 services used by FX large correspond to using two-part composite services for theTechnical analysis andFundamental analysisoperations from Fig. 5.
5.3
Evaluation Methodology
[image:8.595.317.553.78.158.2]In line with the standard practice for evaluating the formance of stochastic optimisation algorithms [6], we per-formed multiple (i.e., 30) independent runs for each system variant from Table 6 and each multiobjective optimisation algorithm—NSGA-II, SPEA2, MOCell and random search. Each run comprised 10,000 evaluations, and the MOGAs
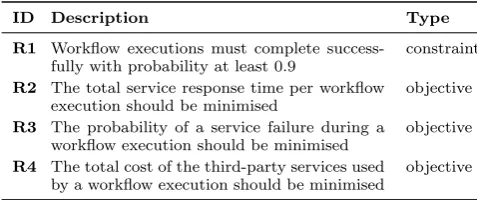
Table 5: QoS requirements for the FX system
ID Description Type
R1 Workflow executions must complete
success-fully with probability at least 0.9
constraint
R2 The total service response time per workflow
execution should be minimised
objective
R3 The probability of a service failure during a
workflow execution should be minimised
objective
R4 The total cost of the third-party services used
by a workflow execution should be minimised
objective
Table 6: Analysed system variants; Trun represents the
EvoChecker running time averaged over 30 runs
Variant Int-valued parameters Size Trun
DPM Small QmaxH,L∈ {1, ...,10},m= 2 2E+14 1050s
DPM Medium QmaxH,L∈ {1, ...,15},m= 2 4.5E+14 2118s
DPM Large QmaxH,L∈ {1, ...,20},m= 2 8E+14 3796s
FX Small n= 4,n1=· · ·=n4= 3 4.98E+31 858s
FX Medium n= 6,n1=· · ·=n6= 4 1.39E+65 1695s
FX Large n= 8,n1=· · ·=n6= 4 7.22E+86 4162s
used an initial population of 100 individuals, single-point crossover with probabilitypc= 0.9, and single-point muta-tion with probability pm = 1/np, where np is the number of system variant parameters. All the experiments were run on a CentOS Linux 6.5 64bit server with two 2.6GHz Intel Xeon E5-2670 processors and 32GB of memory. The average run times for the six system variants are shown in Table 6.
Obtaining the actual Pareto front for our system variants is unfeasible because of their very large design spaces. There-fore, we adopted the established practice [63] of compar-ing the Pareto front approximations produced by each algo-rithm with the reference Pareto front comprising the non-dominated solutions from all the runs carried out for the analysed system variant. For this comparison, we employed the widely-used Pareto-front quality indicators below, and we will present their means and box plots as measures of central tendency and distribution, respectively:
1. Unary additive epsilon(Iǫ) [66], i.e., the minimum addi-tive term by which the elements of the objecaddi-tive vectors from a Pareto front approximation must be adjusted in order to dominate the objective vectors from the refer-ence front. This indicator presents convergrefer-ence to the reference front and isPareto compliant3. SmallerI
ǫ val-ues denote better Pareto front approximations.
2. Hypervolume (IHV) [65], which measures the volume in the objective space covered by a Pareto front approxima-tion with respect to the reference front (or a reference point). IHV measures both convergence and diversity, and is strictly Pareto compliant [62]. LargerIHV values denote better Pareto front approximations.
3. Inverted Generational Distance (IIGD) [58], which pro-vides an “error measure” as the Euclidean distance in the objective space between the reference front and the Pareto front approximation. IIGD shows both diversity and convergence to the reference front. Smaller IIGD values signify better Pareto front approximations.
We used inferential statistical tests to compare these quality indicators across the four algorithms [6, 38, 63]. As is typ-ical of multiobjective optimisation [63], the Shapiro-Wilk test showed that the quality indicators were not normally distributed, so we used the Kruskal-Wallis non-parametric test with 95% confidence level (α= 0.05) to analyse the re-sults without making assumptions about the distribution of the data or the homogeneity of its variance. We also carried out a post-hoc analysis with pairwise comparisons between the four algorithms by means of Dunn’s pairwise test, con-trolling the family-wise error rate using the Bonferroni cor-rectionpcrit=α/k, wherekis the number of comparisons.
3Pareto compliant indicators do not “contradict” the order
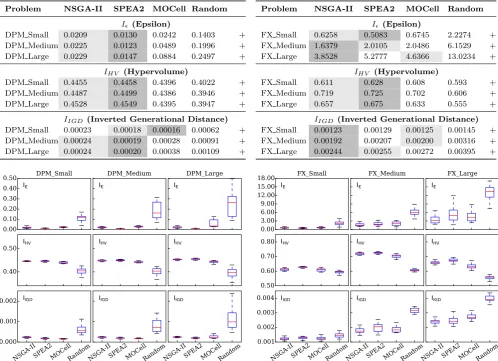
[image:8.595.53.292.616.716.2]Table 7: Mean quality indicator values for the system variants from Table 6
Problem NSGA-II SPEA2 MOCell Random
Iǫ (Epsilon)
DPM Small 0.0209 0.0130 0.0242 0.1403 +
DPM Medium 0.0225 0.0123 0.0489 0.1996 +
DPM Large 0.0229 0.0147 0.0884 0.2497 +
IHV (Hypervolume)
DPM Small 0.4455 0.4458 0.4396 0.4022 +
DPM Medium 0.4487 0.4499 0.4386 0.3946 +
DPM Large 0.4528 0.4549 0.4395 0.3947 +
IIGD (Inverted Generational Distance)
DPM Small 0.00023 0.00018 0.00016 0.00062 +
DPM Medium 0.00024 0.00019 0.00028 0.00091 +
DPM Large 0.00024 0.00020 0.00038 0.00109 +
Problem NSGA-II SPEA2 MOCell Random
Iǫ(Epsilon)
FX Small 0.6258 0.5083 0.6745 2.2274 +
FX Medium 1.6379 2.0105 2.0486 6.1529 +
FX Large 3.8528 5.2777 4.6366 13.0234 +
IHV (Hypervolume)
FX Small 0.611 0.628 0.608 0.593 +
FX Medium 0.719 0.725 0.702 0.606 +
FX Large 0.657 0.675 0.633 0.555 +
IIGD (Inverted Generational Distance)
FX Small 0.00123 0.00129 0.00125 0.00145 +
FX Medium 0.00192 0.00207 0.00200 0.00316 +
FX Large 0.00244 0.00255 0.00272 0.00395 +
0.00 0.10 0.20 0.30 0.40 0.50
0.40 0.50
NSG A-II
SPEA 2
MOC ell
Rand om 0.000
0.001 0.002
NSG A-II
SPEA 2
MOC ell
Rand om
NSG A-II
SPEA 2
MOC ell
Rand om
DPM_Small DPM_Medium DPM_Large
Iε Iε Iε
IHV IHV IHV
IIGD IIGD IIGD
0.00 3.00 6.00 9.00 12.00 15.00 18.00
0.50 0.60 0.70 0.80
NSG A-II
SPEA 2
MOC ell
Rand om 0.001
0.002 0.003 0.004
NSG A-II
SPEA 2
MOC ell
Rand om
NSG A-II
SPEA 2
MOC ell
Rand om
FX_Small FX_Medium FX_Large
Iε Iε Iε
IHV IHV IHV
[image:9.595.56.558.73.429.2]IIGD IIGD IIGD
Figure 6: Boxplots for the six system variants from Table 6, evaluated using the quality indicatorsIǫ,IHV andIIGD
5.4
Results and Discussion
RQ1(Validation). To answer the first research question,
we carried out the experiments described in the previous section. The results are reported in Table 7 and Fig. 6. The ‘+’ from the last column of the table entries indicate that the Kruskal-Wallis test showed significant difference among the four algorithms (p-value<0.05) for all six system variants and all Pareto-front quality indicators.
For both systems, EvoChecker with any MOGA achieved considerably better results than random search, for all qual-ity indicators and system variants. The post hoc analysis of pairwise comparisons between random search and the MO-GAs provided statistical evidence about the superiority of the MOGAs for all system variants and for all quality in-dicators. The best and, when obtained, the second best outcomes of this analysis per system variant and quality in-dicator are shaded and lightly shaded in the result tables, respectively. This superiority of the results obtained using EvoChecker with any of the MOGAs over those produced by random search can also be seen from the boxplots in Fig. 6.
We qualitatively support our findings by presenting in Fig. 7 the Pareto front approximations achieved by EvoChecker with
each of the MOGAs and by random search, for a typical run of the experiment for the FX system variants. We observe that irrespective of the MOGA, EvoChecker achieves Pareto front approximations with more, better spread and higher quality nondominated solutions than random search.
As explained in Section 2, the parameters we used for the DPM system variants (power usage, transition rates, etc.) correspond to the real-world system. In contrast, for the FX system variants we chose realistic values for the relia-bility, performance and cost of the third-party services. To mitigate the risk of accidentally choosing values that biased the EvoChecker evaluation, we performed additional experi-ments comprising 300 independent runs per FX system vari-ant (900 runs in total) in which these parameters were ran-domly instantiated. The results of this further analysis (re-ported on our project webpage but not included here due to space constraints) confirm the findings presented above.
0.96 0.92
1.00
30 45 60 75 90 16 18 20 22
Relia bility
Cost
T
im
e
[
s
] NSGA-IISPEA2
MOCell Random
(a) FX Small
Relia bility 0.96 0.92
1.00
20 40 60 80 100 16 20 24 28
Cost
T
im
e
[
s
] NSGA-II
SPEA2 MOCell Random
(b) FX Medium
0.96 0.92
1.00
60 90 120 150 30 35 40
25 45
Relia bility Cost
T
im
e
[
s
] NSGA-II SPEA2 MOCell Random
[image:10.595.51.557.55.173.2](c) FX Large
Figure 7: Typical Pareto front approximations for the FX system variants and optimisation objectivesR2-R4from Table 5
RQ2 (Comparison). To compare EvoChecker instances
based on different MOGAs, we first observe in Table 7 that NSGA-II and SPEA2 outperformed MOCell for all system variant–quality indicator combinations except DPM Small–
IIGD. Between SPEA2 and NSGA-II, the former achieved slightly better results for the smaller design spaces of the DPM system variants (across all indicators) and for the
IHV indicator (across all system variants), whereas NSGA-II yielded Pareto-front approximations with better Iǫ and IIGD indicators for the larger design spaces of the FX sys-tem variants (except the combination FX small–Iǫ).
Additionally, we carried out the post-hoc analysis described in Section 5.3, for 9 system variants (counting separately the FX system variants with chosen parameters and with randomly instantiated parameters)×3 quality indicators = 27 tests. Out of these tests, 22 tests (i.e., a percentage of 81.4%) showed high statistical significance in the differences between the performance achieved by EvoChecker with dif-ferent MOGAs (Table 8). The five system variant–quality indicator combinations for which the tests were unsuccessful are: FX Medium–Iǫ, FX(random) Small–Iǫ, FX(random) Medium–Iǫ, FX Small–IIGD and FX Medium–IIGD.
These results show that, like for any well-formulated opti-misation problem, different algorithms are more suitable in dealing with specific problems. They also confirm the gen-erality of EvoChecker, showing that its functionality can be realised using multiple established MOGAs.
RQ3 (Insights). We performed qualitative analyses of the
[image:10.595.54.296.557.705.2]Pareto front approximations produced by EvoChecker, with
Table 8: System variants for which the MOGAs in rows are significantly better than the MOGAs in columns
NSGA-II SPEA2 MOCell
N
S
G
A
-I
I Iǫ: FX L,RL DPM M,L
IHV: – DPM S,M,L;
FX M,L,RM,RL
IIGD: – FX L,RL
S
P
E
A
2 IIǫ: DPM S,M,L DPM S,M,L; FX S
HV: FX S,M,L, DPM S,M,L;
RS,RM,RL FX S,M,L,RS,RM,RL
IIGD: DPM S,M,L;
FX RS
DPM L; FX L,RS,RM,RL
MO
C
e
ll
Iǫ: – –
IHV: – –
IIGD: DPM S,M DPM S
Key: S=Small, M=Medium, L=Large, R=random parameters
the purpose of identifying actionable insights. We illustrate this for the FX and DPM Pareto front approximations from Fig. 7 and Fig. 4, respectively. First, the EvoChecker sults enable the identification of the “point of diminishing re-turns” for each system variant. The results from Fig. 7 show that design options with costs above approximately 52 for FX Small, 61 for FX Medium and 94 for FX Large provide only marginal response time and reliability improvements over the best designs achievable for these costs. Likewise, the results in Fig. 4 show that DPM designs with power use above 1.7W yield insignificant reductions in the number of lost requests, whereas designs with even slightly lower power use lead to much higher request loss. This key information helps designers avoid unnecessarily expensive solutions.
Second, we note the high density of design solutions in the areas with low reliability (below 0.95) for the FX system in Fig. 7, and with high request loss (above 0.09) for the DPM system in Fig. 4. For the FX system, for instance, these correspond to the use of the probabilistic service selec-tion strategy, for which numerous service combinaselec-tions can achieve similar reliability and response time with relatively low, comparable costs. Opting for a design from this area will make the FX system susceptible to failures, as when the only service invoked for an FX operation fails, the en-tire workflow execution will also fail. In contrast, reliability values above 0.995 correspond to high-cost designs that use the sequential service selection strategy, e.g., FX small must use the sequential strategy for theMarket watchand Funda-mental analysisservices in order to achieve 0.996 reliability.
Third, the EvoChecker results reveal design parameters that QoS properties are particularly sensitive to. For the FX sys-tem, for example, we noticed a strong dependency of the workflow reliability on the service selection strategy and the number of services used for each operation. Designs from high-reliability areas of the Pareto front not only use the sequential selection strategy, but also require multiple ser-vices per FX operation (e.g., three FX service providers are needed for success rates above 0.99).
5.5
Threats to Validity
Construct validitythreats may be due to the
simplifica-tions and assumpsimplifica-tions we made when modelling the DPM and FX systems. To mitigate this threat, the DPM system, model and requirements are based on a validated real-world case study taken from the literature [53, 56], which we were familiar with from our previous work [19]. For the FX sys-tem, the model and requirements were developed in close collaboration with a foreign exchange domain expert.
Internal validity threats can originate from the
stochas-tic nature of the optimisation algorithms employed in our study. To mitigate these threats, we adopted the recom-mended practice for empirical studies in this research area [6, 38]. In particular, we reported results over 30 repeated runs of each experiment, and employed statistical tests to check for significance in the achieved results. Thus, we used the Shapiro-Wilk test to assess the normality of data, and the Kruskall-Wallis and Dunn pairwise non-parametric tests to check for statistical significance between the considered op-timisation algorithms. Finally, we set the chance of commit-ting a Type I error (αconfidence limit) at 0.05, which is the standard value recommended for these studies.
External validitythreats might be due to the difficulty of
representing a software system and its QoS requirements as a probabilistic model synthesis problem (Section 3.3) using EvoChecker constructs (2)–(4), constraints (5) and optimi-sation objectives (6). We limit this threat by specifying EvoChecker probabilistic model templates in an extended version of the high-level modelling language of PRISM [45], a widely-used probabilistic model checker [50]. Moreover, given the generality of the EvoChecker constructs (2)–(4), other probabilistic modelling languages (e.g., those of the model checkers MRMC [40, 41] and Ymer [60]) can be natu-rally supported. Additionally, EvoChecker supports a wide range of probabilistic models and temporal logics (Table 1). Finally, to further reduce the risk that EvoChecker might be difficult to use in practice, we validated it through applica-tion to several variants of two realistic software systems with diverse characteristics in terms of application domain, size, complexity and requirements. Nevertheless, we are aware that our findings are by no means conclusive for all types of software systems, and more experiments are required to confirm the generality of the EvoChecker approach and tool.
6.
RELATED WORK
Search-based software engineering (SBSE) [38] has been suc-cessfully used in areas ranging from project management [29, 54, 57] and testing [5, 32, 36] to effort estimation [48], soft-ware repair and evolution [20, 52] and softsoft-ware product lines [35, 55]. However, as reported in Harmanet al.’s recent SBSE survey [37], this success does not yet extend to model checking. The only SBSE applications that we are aware of in this area are the approaches in [39, 42], which employ ge-netic evolution to synthesise model checking specifications, and the work in [1, 2], which uses ant colony optimisation to find counterexamples for large model checking problems. To the best of our knowledge, EvoChecker is the first SBSE approach to synthesising Pareto-optimal sets of probabilis-tic models for QoS software engineering. As mentioned in Section 1, the only related work we are aware of belongs to the area ofmodel repair [16, 61]. Unlike EvoChecker, most model repair research so far has focused on non-probabilistic
models [15, 16, 21, 22, 47]. Also different from EvoChecker, these approaches support a single type of model, and target its “repair” with respect to a single temporal logic property. In the probabilistic model checking domain, model repair involves automatically modifying the transition probabili-ties of a model that violates a formally-specified property in order to obtain a new model that satisfies the property and is “close” to the original model [10, 11, 23]. As prob-abilistic model repair modifies the original model only at transition probability level, and only to satisfy a single tem-poral logic property, its applicability is limited. In con-trast, EvoChecker handles multiple QoS requirements and uses multiobjective optimisation to derive a set of proba-bilistic models that approximates the Pareto-optimal model set associated with these QoS requirements. To confirm that EvoChecker subsumes the capabilities of probabilistic model repair, we used our EvoChecker tool to successfully replicate the results of the IPv4 Zeroconf Protocol [10] and Network Virus Infection [23] case studies. We did not include these additional experiments in the paper due to space constraints, but we make the results available on our project webpage. Finally, [31] synthesises Pareto front approximations over the policies of Markov decision processes (MDPs). However, its applicability is limited to fully specified MDPs, to a sub-set of probabilistic computation tree logic (i.e., reachability and expected total reward formulae), and to the finite search spaces that can be encoded as MDP policies. In contrast, EvoChecker fully supports all types of models and logics from Table 1, and solves a more general problem by starting from incompletely specified probabilistic model templates with potentially infinite search spaces (due to evolvable dou-bleparameters and distributions). Moreover, the implemen-tation in [31] currently supports only up to 3 optimisation objectives, while EvoChecker does not have this limitation.
7.
CONCLUSION
We defined the probabilistic model synthesis problem, and introduced EvoChecker, the first tool-supported search-based approach that tackles this problem with a focus on QoS software engineering. EvoChecker uses multiobjective op-timisation genetic algorithms to automate the synthesis of approximate Pareto-optimal probabilistic model sets associ-ated with the QoS requirements of a software system. We evaluated the EvoChecker approach and tool within two case studies from different domains, showing its effectiveness, po-tential applicability and flexibility. The limitations of our evaluation are discussed in Section 5.5.
The future research directions for our project include ex-tending the applicability of EvoChecker to other modelling formalisms and verification logics by exploiting established quantitative model checkers such as UPAAL [12], exploring alternative multiobjective optimisation [33], and integrating the EvoChecker approach with our related work on runtime probabilistic model checking [17, 18, 30]. The further explo-ration of the EvoChecker performance and its applicability to other domains represents another area of future work.
Acknowledgements
8.
REFERENCES
[1] E. Alba and F. Chicano. Finding safety errors with ACO. In9th Intl. Conf. on Genetic and Evolutionary Computation (GECCO’07), pages 1066–1073, 2007. [2] E. Alba and F. Chicano. Searching for liveness
property violations in concurrent systems with ACO. InIn 10th Intl. Conf. on Genetic and Evolutionary Computation (GECCO’08), pages 1727–1734, 2008. [3] R. Alur and T. Henzinger. Reactive modules.Formal
Methods in System Design, 15(1):7–48, 1999. [4] S. Andova, H. Hermanns, and J. P. Katoen.
Discrete-time rewards model-checked. InFORMATS 2003, volume 2791 ofLNCS, pages 88–104. 2004. [5] J. Andrews, T. Menzies, and F. Li. Genetic algorithms
for randomized unit testing.IEEE Trans. Softw. Eng., 37(1):80–94, 2011.
[6] A. Arcuri and L. Briand. A practical guide for using statistical tests to assess randomized algorithms in software engineering. In33rd Intl. Conf. Softw. Eng. (ICSE’11), pages 1–10, 2011.
[7] A. Aziz, K. Sanwal, V. Singhal, and R. Brayton. Verifying continuous time Markov chains. InComputer Aided Verification (CAV’96), pages 269–276, 1996. [8] C. Baier and J. P. Katoen.Principles of Model
Checking. MIT Press, 2008.
[9] C. Baier, J. P. Katoen, and H. Hermanns. Approximate symbolic model checking of
continuous-time Markov chains. In10th Intl. Conf. on Concurrency Theory (CONCUR’99), volume 1664 of LNCS, pages 146–161, 1999.
[10] E. Bartocci, R. Grosu, P. Katsaros, C. Ramakrishnan, and S. A. Smolka. Model repair for probabilistic systems. InTools & Algorithms Constr. & Analysis of Systems (TACAS’11), pages 326–340. 2011.
[11] M. Benedikt, R. Lenhardt, and J. Worrell. LTL model checking of interval Markov chains. InTools & Algorithms Constr. & Analysis of Systems (TACAS’13), pages 32–46. 2013.
[12] J. Bengtsson, K. Larsen, F. Larsson, P. Pettersson, and W. Yi.UPPAAL - a tool suite for automatic verification of real-time systems. Springer, 1996. [13] A. Bianco and L. de Alfaro. Model checking of
probabilistic and nondeterministic systems. In15th Intl. Conf. on Foundations of Software Technology and Theoretical Computer Science (FSTTCS’95), volume 1026 ofLNCS, pages 499–513, 1995.
[14] B. Boehm and V. R. Basili. Software Defect Reduction Top 10 List.Computer, 34(1):135–137, Jan. 2001. [15] B. Bonakdarpour and S. S. Kulkarni. Automated
model repair for distributed programs.ACM SIGACT News, 43(2):85–107, 2012.
[16] F. Buccafurri, T. Eiter, G. Gottlob, and N. Leone. Enhancing model checking in verification by AI techniques.Artificial Intelligence, 112:57–104, 1999. [17] R. Calinescu, C. Ghezzi, M. Kwiatkowska, and
R. Mirandola. Self-adaptive software needs
quantitative verification at runtime.Communications of the ACM, 55(9):69–77, September 2012.
[18] R. Calinescu, L. Grunske, M. Kwiatkowska, R. Mirandola, and G. Tamburrelli. Dynamic QoS management and optimization in service-based systems.IEEE Trans. Softw. Eng., 37:387–409, 2011.
[19] R. Calinescu and M. Z. Kwiatkowska. Using quantitative analysis to implement autonomic IT systems. In31st Intl. Conf. Softw. Eng. (ICSE’09), pages 100–110, 2009.
[20] G. Canfora, M. Di Penta, R. Esposito, and M. L. Villani. An approach for QoS-aware service
composition based on genetic algorithms. In7th Intl. Conf. on Genetic and Evolutionary Computation (GECCO’05), pages 1069–1075, 2005.
[21] M. Carrillo and D. A. Rosenblueth. CTL update of Kripke models through protections.Artificial Intelligence, 211(0):51 – 74, 2014.
[22] G. Chatzieleftheriou, B. Bonakdarpour, S. A. Smolka, and P. Katsaros. Abstract model repair. InNASA Formal Methods, pages 341–355. 2012.
[23] T. Chen, E. M. Hahn, T. Han, M. Kwiatkowska, H. Qu, and L. Zhang. Model repair for Markov decision processes. In7th Intl. Symp. Theoretical Aspects of Softw. Eng. (TASE’13), pages 85–92, 2013. [24] E. M. Clarke, O. Grumberg, and D. Peled.Model
checking. MIT press, 1999.
[25] L. O. Damm and L. Lundberg. Company-wide implementation of metrics for early software fault detection. In29th Intl. Conf. Softw. Eng. (ICSE’07), pages 560–570, 2007.
[26] K. Deb, A. Pratap, S. Agarwal, and T. Meyarivan. A fast and elitist multiobjective genetic algorithm: NSGA-II. IEEE Trans. Evol. Comp., 6(2):182–197, 2002.
[27] J. J. Durillo and A. J. Nebro. jMetal: A Java framework for multi-objective optimization.Advances in Engineering Software, 42:760–771, 2011.
[28] J. J. Durillo, A. J. Nebro, C. A. Coello Coello, J. Garc´ıa-Nieto, F. Luna, and E. Alba. A study of multiobjective metaheuristics when solving parameter scalable problems.IEEE Trans. on Evolutionary Computation, 14(4):618–635, 2010.
[29] F. Ferrucci, M. Harman, J. Ren, and F. Sarro. Not going to take this anymore: Multi-objective overtime planning for software engineering projects. In35th Intl. Conf. Softw. Eng. (ICSE’13), pages 462–471, 2013.
[30] A. Filieri, C. Ghezzi, and G. Tamburrelli. A formal approach to adaptive software: continuous assurance of non-functional requirements.Formal Asp. Comput., 24(2):163–186, 2012.
[31] V. Forejt, M. Kwiatkowska, and D. Parker. Pareto curves for probabilistic model checking. In10th Intl. Symp. Automated Technology for Verif. & Analysis, volume 7561 ofLNCS, pages 317–332. Springer, 2012. [32] G. Fraser and A. Arcuri. Whole test suite generation.
IEEE Trans. Softw. Eng., 39(2):276–291, 2013. [33] X. Gandibleux.Metaheuristics for multiobjective
optimisation, volume 535. Springer Science & Business Media, 2004.
[34] H. Hansson and B. Jonsson. A logic for reasoning about time and reliability.Formal Aspects of Computing, 6(5):512–535, 1994.
Softw. Product Line Conf., pages 5–18, 2014. [36] M. Harman, Y. Jia, and W. B. Langdon. Strong
higher order mutation-based test data generation. In 19th ACM SIGSOFT Symposium and the 13th European Conf. on Foundations of Software Engineering (ESEC/FSE’11), pages 212–222, 2011. [37] M. Harman, S. A. Mansouri, and Y. Zhang.
Search-based software engineering: Trends, techniques and applications.ACM Computing Surveys,
45(1):11:1–11:61, 2012.
[38] M. Harman, P. McMinn, J. de Souza, and S. Yoo. Search based software engineering: Techniques, taxonomy, tutorial. InEmpirical Softw. Eng. and Verif., volume 7007 ofLNCS, pages 1–59. 2012. [39] C. Johnson. Genetic programming with fitness based
on model checking. InGenetic Programming, volume 4445 ofLNCS, pages 114–124. 2007.
[40] J. P. Katoen, M. Khattri, and I. S. Zapreev. A Markov reward model checker. InQuantitative Evaluation of Systems (QEST’05), pages 243–244, 2005.
[41] J. P. Katoen, I. S. Zapreev, E. M. Hahn,
H. Hermanns, and D. N. Jansen. The ins and outs of the probabilistic model checker MRMC.Performance Evaluation, 68(2):90–104, 2011.
[42] G. Katz and D. Peled. Synthesis of parametric programs using genetic programming and model checking. In15th Intl. Workshop Verif. Infinite-State Systems (INFINITY’13), pages 70–84, 2013.
[43] J. R. Koza.Genetic Programming: On the Programming of Computers by Means of Natural Selection. MIT Press, Cambridge, MA, USA, 1992. [44] M. Kwiatkowska. Quantitative verification: Models,
techniques and tools. In6th ACM SIGSOFT Symp. Foundations of Softw. Eng. (ESEC/FSE), pages 449–458, 2007.
[45] M. Kwiatkowska, G. Norman, and D. Parker. PRISM 4.0: Verification of probabilistic real-time systems. In 23rd Intl. Conf. on Computer Aided Verification (CAV’11), volume 6806 ofLNCS, pages 585–591, 2011. [46] M. Z. Kwiatkowska, G. Norman, and D. Parker.
Probabilistic symbolic model checking with PRISM: A hybrid approach.Int. Journal on Software Tools for Technology Transfer, 6(2):128–142, 2004.
[47] U. Martinez-Araiza and E. Lopez-Mellado. A CTL model repair method for Petri Nets. InWorld
Automation Congress (WAC’14), pages 654–659, 2014. [48] L. L. Minku and X. Yao. Software effort estimation as a multiobjective learning problem.ACM Trans. Softw. Eng. Methodol., 22(4):35:1–35:32, 2013.
[49] A. J. Nebro, J. J. Durillo, F. Luna, B. Dorronsoro, and E. Alba. MOCell: A cellular genetic algorithm for multiobjective optimization.Intl. Journal of
Intelligent Systems, 24(7):726–746, 2009.
[50] G. Norman and D. Parker. Quantitative verification: Formal guarantees for timeliness, reliability and performance. Technical report, The London
Mathematical Society and the Smith Institute, 2014. [51] A. Pnueli. The temporal logic of programs. In18th
Annual Symposium on Foundations of Computer Science, pages 46–57, 1977.
[52] K. Praditwong, M. Harman, and X. Yao. Software module clustering as a multi-objective search problem. IEEE Trans. Softw. Eng., 37(2):264–282, March 2011. [53] Q. Qiu, Q. Qu, and M. Pedram. Stochastic modeling
of a power-managed system-construction and
optimization.IEEE Trans. Computer-Aided Design of Integrated Circuits & Systems, 20(10):1200–1217, 2001. [54] J. Ren, M. Harman, and M. Di Penta. Cooperative
co-evolutionary optimization of software project staff assignments and job scheduling. InSearch Based Software Engineering (SSBSE’11), volume 6956 of LNCS, pages 127–141. 2011.
[55] A. Sayyad, J. Ingram, T. Menzies, and H. Ammar. Scalable product line configuration: A straw to break the camel’s back. In28th Intl. Conf. on Automated Software Engineering (ASE’13), pages 465–474, 2013. [56] A. Sesic, S. Dautovic, and V. Malbasa. Dynamic
power management of a system with a two-priority request queue using probabilistic-model checking. IEEE Trans. on Computer-Aided Design of Integrated Circuits and Systems, 27(2):403–407, 2008.
[57] C. Stylianou, S. Gerasimou, and A. Andreou. A novel prototype tool for intelligent software project
scheduling and staffing enhanced with personality factors. In24th Intl. Conf. on Tools with Artificial Intelligence (ICTAI’12), pages 277–284, 2012. [58] D. A. Van Veldhuizen.Multiobjective Evolutionary
Algorithms: Classifications, Analyses, and New Innovations. PhD thesis, 1999.
[59] J. Woodcock, P. G. Larsen, J. Bicarregui, and J. Fitzgerald. Formal methods: Practice and
experience.ACM Computing Surveys, 41(4):19, 2009. [60] H. L. S. Younes. Ymer: A statistical model checker. In
Computer Aided Verification (CAV’05), volume 3576 ofLNCS, pages 429–433. 2005.
[61] Y. Zhang and Y. Ding. CTL model update for system modifications.Journal of Artificial Intelligence Research (JAIR), 31:113–155, 2008.
[62] E. Zitzler, D. Brockhoff, and L. Thiele. The hypervolume indicator revisited: On the design of pareto-compliant indicators via weighted integration. In4th Intl. Conf. on Evolutionary Multi-criterion Optimization (EMO’07), pages 862–876, 2007. [63] E. Zitzler, J. Knowles, and L. Thiele. Quality
assessment of Pareto set approximations. In Multiobjective Optimization, volume 5252 ofLNCS, pages 373–404. 2008.
[64] E. Zitzler, M. Laumanns, and L. Thiele. SPEA2: Improving the strength Pareto evolutionary algorithm. InEvolutionary Methods for Design Optimization and Control with Applications to Industrial Problems (EUROGEN’01), pages 95–100, 2001.
[65] E. Zitzler and L. Thiele. Multiobjective evolutionary algorithms: a comparative case study and the strength pareto approach.IEEE Trans. on Evolutionary Computation, 3(4):257–271, 1999.
[66] E. Zitzler, L. Thiele, M. Laumanns, C. Fonseca, and V. da Fonseca. Performance assessment of