Int. J. Electrochem. Sci., 6 (2011) 52 - 62
International Journal of
ELECTROCHEMICAL
SCIENCE
www.electrochemsci.org
Nanocomposite Based Carbon Paste Electrode for Selective
Analysis of Copper
Mohammad Reza Ganjali1,*, Sajjad Aghabalazadeh1, Mehdi khoobi2,3,4, Ali Ramazani2, Alireza Foroumadi3,4, Abbas Shafiee3,4 and Parviz Norouzi1
1
Center of excellence in Electrochemistry, Faculty of Chemistry, University of Tehran, Tehran, Iran 2
Chemistry Department, Zanjan University, P.O. Box 45195-313, Zanjan, Iran 3
Department of Medicinal Chemistry, Faculty of Pharmacy, Tehran University of Medical Sciences, Tehran, 14176, Iran
4
Pharmaceutical Sciences Research Center, Tehran University of Medical Sciences, Tehran, 14176, Iran
*
E-mail: [email protected]
Received: 15 November 2010 / Accepted: 1 December 2010 / Published: 1 January 2011
Nanocomposite based carbon paste ion-selective electrode for analysis of copper was prepared. The sensing material used in this sensor was a coumarin derivative. Conductomeric study in acetonitrile solution showed a selective interaction between sensing material and copper ions in comparison with other common metal ions. Multi-walled carbon nanotubes (MWCNTs) and nanosilica was used for modifying the sensor response. The proposed electrode showed a stable potential response to Cu2+ ions with Nernstian slope of 29.3±0.5 mV decade-1 over a wide linear concentration range of 10-6-10-1 mol L-1. The electrode has short response time of 15 s and could be used for a period of 6 weeks. The electrode was used successfully for analysis of copper in waste water samples.
Keywords: Multi-Walled Carbon Nanotubes, Sensor, Copper Ions, Carbon Paste, Ion Selective Electrode, Potentiometry
1. INTRODUCTION
acid chains, exerting a deleterious influence on shelf life and nutritional value [4]. Therefore, determination of trace levels of it is important.
Some of analytical methods such as atomic absorption, UV–Vis spectrometry and inductively coupled plasma (ICP) are utilized for the determination of copper at low concentration levels and they are either time consuming, involving multiple sample manipulations, or too expensive. Another method for determination of copper is potentiometric method with using an ion sensor as an indicator electrode. Potentiometric measurements using these electrodes are a simple, low cost, selective, accurate and rapid method of analysis, which have found applications in different fields [5-9].
Carbon pastes have obtained noticeable attention as useful materials for the fabrication of sensors and biosensors [10-19]. The important factors that promote the use of carbon paste electrode are simplicity of preparation, the versatility of chemical modification, and rapid renewal of the electrode surface.
Nano-silica-based materials are robust inorganic solids displaying both high specific surface area (200-1500 m2 g-1) and a three-dimensional structure made of highly open spaces interconnected to each other. This would impart high diffusion rates of selected target analytes to a large number of accessible binding sites, which constitutes definite key factor in designing sensor devices with high sensitivity [20].
O O
[image:2.596.205.405.388.486.2]S HN
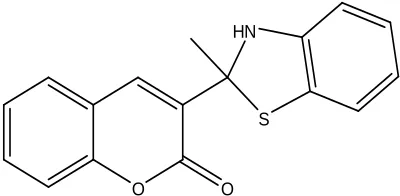
Figure 1. Chemical structure of L
Durinng the recent years, multi-walled carbon nanotubes (MWCNTs) have also been used in composition of carbon paste electrodes [21-27] because of their interesting and extraordinary physicochemical properties, such as an ordered structure with high aspect ratio, ultra-light weight, high thermal conductivity, metallic or semi-metallic behavior, high surface area, high electrical conductivity and remarkable mechanical strength [28-32].
In this research, interaction study of 3-(2-methyl-2,3-dihydrobenzothiazol-2-yl)-2H-chromen-2-one (L), Fig. 1, with common metal ions was carried out in acetonitrile solution. Since L showed a selective manner toward Cu2+ ion comparison with other tested cations, it was used in construction of Cu2+ carbon paste electrode.
2. EXPERIMENTAL SECTION
2.1. Apparatus
The glass cell, where the Cu2+ carbon paste electrode was placed, consisted of an R684 model Analion Ag/AgCl double junction reference electrode as a reference electrode. A Corning ion analyzer 250 pH/mV meter was used for the potential measurements at 25.0±0.1 °C.
2.2. Reagents
The graphite powder with a <50 μm particle size (Merck), and 2.2 g/cm3 density; along with the paraffin oil (Aldrich) was of high purity and was used for the preparation of the carbon pastes. The multi-walled carbon nanotubes (MWCNTs) with 10-40 nm diameters, 1-25 μm length, core diameter: 5-10 nm, SBET: 40-600 m2/g, Vtotal: 0.9 cm3/g, bulk density 0.1 g/cm3, true density 2.1 g/cm3 and with 95% purity were purchased from local factory (Iran). Nanosilica used is Wacker HDK® H20 with BET surface of the hydrophilic silica of 170-230 m2/g, Vtotal: 0.81 cm3/g and tamped density 40 g/lit.
The ionophore (L) was synthesized as followed:
2.2.1. General procedure for Synthesis of 3-Acetyl coumarins by Knoevenagel condensation:
To a cold mixture of salicylaldehyde derivatives (0.2 M) and ethylacetoacetate (0.2 M), 2 ml of piperidine was added by rapid stirring. After 20 min the yellowish solid separated was filtered off subsequently washed with ethanol and was recrystallised from water:ethanol (3:7), yields was 83.6-95% [33,34].
2.2.2. General Procedure for the reaction of 3-Acetyl coumarins and 2-Aminothiophenole
To a mixture of 3-acetylcoumarins (10 mmol) and 2-aminothiophenole (12 mmol) were added catalytic amount of AcOH. The mixture was irradiated with microwaves at 150 ºC (internal probe) for 3×5 minutes. Similar procedure can be performed in reflux conditions for 24 h. The progress of reaction was followed by TLC. After completion of the reactions, mixture was cooled and the precipitated solid was filtered off and washed with Et2O. Further purifications were done by crystallization from EtOH.
2.3. Carbon Paste Electrode Preparation
Different amounts of the ionophore (L) along with appropriate amount of graphite powder, nanosilica and MWCNTs were thoroughly mixed. The resulting mixture was transferred into a glass tube. The electrode body was fabricated from a glass tube of i.d. 5 mm and a height of 3 cm. After the mixture homogenization, the paste was packed carefully into the tube tip to avoid possible air gaps, often enhancing the electrode resistance. A copper wire was inserted into the opposite end to establish electrical contact. The external electrode surface was smoothed with soft paper. A new surface was produced by scraping out the old surface and replacing the carbon paste. The electrode was finally conditioned for 24 h by soaking in a 1.0×10⁻³ M Cu(NO3)3 solution.
2.4. Emf measurements
The electrochemical cell can be represented as follows:
Ag, AgCl(s), KCl (3 M) || sample solution | carbon paste electrode
Calibration graph was drawn by plotting the potential, E, versus the logarithm of the copper ion concentration.
3. RESULTS AND DISCUSSIONS
Selectivity for a certain ion selective sensor is greatly related to the ionophore used [35-40]. Due to the existence of donor atoms, which is a soft base, in the structure of L, its interaction with some mono, di and trivalent metal ions was studied conductometricly in acetonitrile solution [41,42]. The results showed that L has selective interaction with Cu2+ ions in comparison with other cations tested (log Kf =5.87±0.35) and may be acts as a suitable ion carrier in fabrication of Cu2+ carbon paste electrode.
3.1. Electrode composition and modification
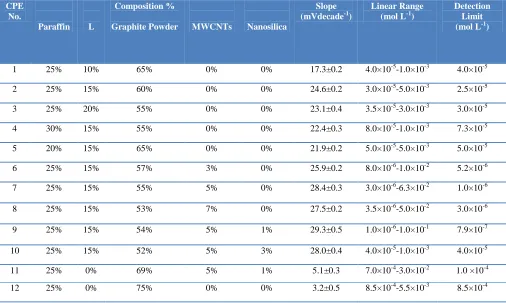
Different carbon paste compositions, as shown in Table 1, were prepared. As it can be seen, two kind of carbon paste electrode was prepared (modified and unmodified CPEs). The best unmodified CPE, with optimized composition (CPE No. 2), shows a near Nernstian slope about 24.6 mV decade-1.
Table 1. The optimization of the carbon paste ingredients
CPE No.
Paraffin L
Composition %
Graphite Powder MWCNTs Nanosilica
Slope (mVdecade-1)
Linear Range (mol L-1)
Detection Limit (mol L-1)
1 25% 10% 65% 0% 0% 17.3±0.2 4.0×10⁻⁵-1.0×10⁻³ 4.0×10⁻⁵
2 25% 15% 60% 0% 0% 24.6±0.2 3.0×10⁻⁵-5.0×10⁻³ 2.5×10⁻⁵
3 25% 20% 55% 0% 0% 23.1±0.4 3.5×10⁻⁵-3.0×10⁻³ 3.0×10⁻⁵
4 30% 15% 55% 0% 0% 22.4±0.3 8.0×10⁻⁵-1.0×10⁻³ 7.3×10⁻⁵
5 20% 15% 65% 0% 0% 21.9±0.2 5.0×10⁻⁵-5.0×10⁻³ 5.0×10⁻⁵
6 25% 15% 57% 3% 0% 25.9±0.2 8.0×10⁻⁶-1.0×10⁻² 5.2×10⁻⁶
7 25% 15% 55% 5% 0% 28.4±0.3 3.0×10⁻⁶-6.3×10⁻² 1.0×10⁻⁶
8 25% 15% 53% 7% 0% 27.5±0.2 3.5×10⁻⁶-5.0×10⁻² 3.0×10⁻⁶
9 25% 15% 54% 5% 1% 29.3±0.5 1.0×10⁻⁶-1.0×10⁻¹ 7.9×10⁻⁷
10 25% 15% 52% 5% 3% 28.0±0.4 4.0×10⁻⁵-1.0×10⁻³ 4.0×10⁻⁵
11 25% 0% 69% 5% 1% 5.1±0.3 7.0×10⁻⁴-3.0×10⁻² 1.0 ×10⁻⁴
12 25% 0% 75% 0% 0% 3.2±0.5 8.5×10⁻⁴-5.5×10⁻³ 8.5×10⁻⁴
Nanosilica in the composition of the carbon paste can also improve the response of the electrode. Nanosilica is a filler compound which has high specific surface area that helps extraction of the ions into the surface of the CPE. In addition, using nanosilica in carbon paste enhances the mechanical properties of the electrode.
As it can be seen from Table 1, modified carbon paste electrode based on 1% nanosilica, 5% MWCNT, 15% L, 25% paraffin oil and 54% graphite shows the best response (CPE No. 9).
CPE without ionophore L (CPE Nos. 11 and 12) have no acceptable responses which confirm the roles of the L as a sensing material in the proposed sensor.
3.2. Calibration curve
The measuring range of an ion selective electrode includes the linear part of the calibration graph as shown in Fig. 2 [43-45]. Measurements can be performed in this lower range. According to another definition, the measuring range of an ion selective electrode is defined as the activity range between the upper and lower detection limits [46-54]. The applicable measuring range of the modified sensor as shown in Fig. 2 is between 1.0×10⁻⁶-1.0×10⁻¹ M. By extrapolating the linear parts of the ion selective calibration curve, the detection limit of an ion selective electrode can be calculated.
y = 29.32x + 254.7 R² = 0.998
50 70 90 110 130 150 170 190 210 230 250
0 1 2 3 4 5 6 7 8
E/m
V
[image:6.596.173.367.72.245.2]pCu
Figure 2. The calibration curve of the Cu2+ modified CPE (electrode no. 9)
3.3. pH effect on the electrode response
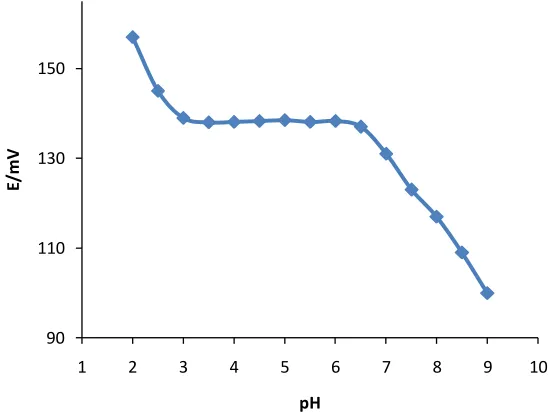
In order to investigate the pH effect on the potential response of the electrode, the potentials were measured for a fixed concentration of Cu2+ ion solution (1.0×10⁻⁴ M) having different pH values. The pH varied from (2-9) by addition of HNO3 or NaOH. The potential variation as a function of pH is plotted in Fig. 3.
90 110 130 150
1 2 3 4 5 6 7 8 9 10
E/m
V
pH
Figure 3. pH effect on the potential response of the Cu2+ modified CPE (electrode no. 9)
[image:6.596.180.457.467.676.2]
pH range, as no interference from H+ or OH– is observed in the range. The fluctuations above the pH value of 6.5 might be justified by the formation of the soluble and insoluble Cu2+ ion hydroxy complexes in the solution. And the fluctuations below the pH value of 3 were attributed to the partial protonation of the employed ligand [55-57].
3.4. Response time
The response time of an ion-selective electrode is also an important factor for any analytical application.
70 90 110 130 150 170 190 210 230 250
0 15 30 45 60 75 90 105 120 135 150 165 180
E/m
V
[image:7.596.145.504.256.552.2]time/s
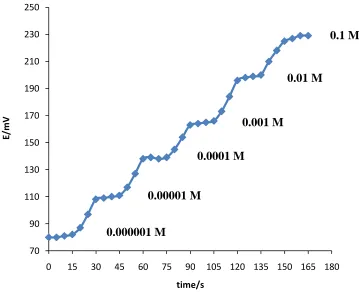
Figure 4. Response time of the Cu2+ modified CPE (electrode no. 9)
In the case of all electrodes, the average response time was defined as the required time for the electrodes to reach a cell potential of 90% of the final equilibrium values, after successive immersions in a series of solutions, each having a 10-fold concentration difference [58-61]. The resulting potential–time responses for the mentioned electrode were obtained upon changing the Cu2+ concentration from 0.000001 to 0.1 M (by fast injection of μL-amounts of a concentrated solution of Cu2+). Results in Fig. 4 showed that the potentiometric response time of the electrode was about 15 s in whole concentration range.
0.000001 M
0.00001 M
0.0001 M
0.001 M
0.01 M
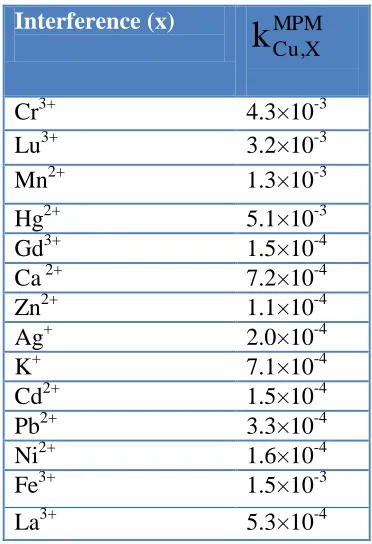
3.5. Interference studies
The potentiometric selectivity coefficients, describing the preference of the suggested electrode for an interfering ion, X, with reference to the copper ion, Cu2+, were determined by the matched potential method (MPM) [62,63]. The MPM is recommended by IUPAC to overcome the difficulties associated with the methods based on the Nicolsky– Eisenman equation. According to this method, the specified activity (concentration) of the primary ion is added to a reference solution (0.000001 M copper nitrate, in this case) and the potential is measured. In a separation experiment, interfering ions (X) are successively added to an identical reference solution, until the measured potential matched that obtained before the addition of the primary ions. The matched potential method selectivity coefficient,
MPM X Cu
k
, is then given by the resulting primary ion to the interfering ion activity (concentration) ratio, MPMX Cu
[image:8.596.205.391.327.599.2]k
, = ∆aCu/aX. The resulting values for the Cu2+ CPE are listed in Table 2.Table 2. The selectivity coefficients of various interfering cations for the electrode no. 9 in pH=3.5.
Interference (x) MPM
X Cu,
k
Cr3+ 4.3×10⁻³
Lu3+ 3.2×10⁻³
Mn2+ 1.3×10⁻³
Hg2+ 5.1×10⁻³
Gd3+ 1.5×10⁻⁴
Ca 2+ 7.2×10⁻⁴
Zn2+ 1.1×10⁻⁴
Ag+ 2.0×10⁻⁴
K+ 7.1×10⁻⁴
Cd2+ 1.5×10⁻⁴
Pb2+ 3.3×10⁻⁴
Ni2+ 1.6×10⁻⁴
Fe3+ 1.5×10⁻³
La3+ 5.3×10⁻⁴
3.6. Lifetime
The lifetime of the modified electrode was studied by periodically recalibrating the potentiometric response to Cu2+ ion in standard copper nitrate solutions.
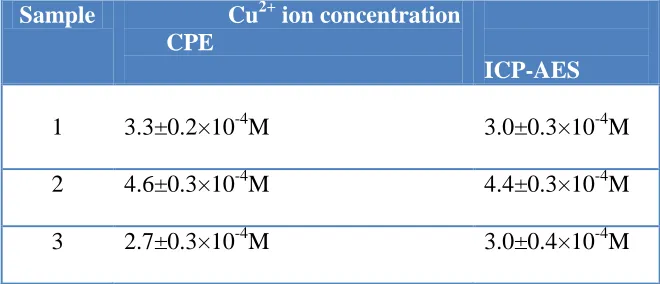
3.7. Analysis of copper in waste water sample
To assess the applicability of proposed electrode in real samples an attempt was made to determine copper ions in waste water samples. The analysis was performed by using the direct potentiometry using calibration curve method.
Table 3. Determination of Cu2+ in waste water samples; the results are based on triplicates measurements.
Sample Cu2+ ion concentration CPE
ICP-AES
1 3.3±0.2×10⁻⁴M 3.0±0.3×10⁻⁴M
2 4.6±0.3×10⁻⁴M 4.4±0.3×10⁻⁴M
3 2.7±0.3×10⁻⁴M 3.0±0.4×10⁻⁴M
The results are given in Table 3. The results obtained by the modified electrode in combination with those obtained by inductively coupled plasma (ICP) method. These results demonstrated the applicability of the developed sensor with the employment of the nanosilica and carbon nanotubes for interference-free determination of copper traces in the analyzed environmental samples.
4. CONCLUSION
A new Cu2+ nanocomposite carbon paste electrode was introduced. The electrode based on 3-(2-methyl-2,3-dihydrobenzothiazol-2-yl)-2H-chromen-2-one (L) which its interaction with common metal ions was initially studied in acetonitrile solution by conductometric method. Then, the electrode was modified by MWCNTs and nanosilica to achieve the better electrode response. The sensor exhibited linear response over a wide concentration range with a Nernstian slope, and short response time of about 15 s. The present sensor can be used over the pH range of 3-6.5. Also it was successfully employed to detect copper ion in waste water samples.
References
1. M. C. Neuman and A. W. Mcintosh (Eds.), Metal Ecotoxicity, Concepts and Applications, Lewis Publishers, Chelsa, MI (1991)
2. E. Rojas, L. A. Herrera, L. A. Poirier and P. Ostrosky-Wegman, Mutat. Res, 443 (1999) 157
[image:9.596.133.463.219.361.2]
5. H.A. Zamani, G. Rajabzadeh and M.R. Ganjali, Talanta 72 (2007) 1093
6. J. Koryta and K. Stulik, Ion Selective Electrodes, Cambridge University Press, Cambridge (1983) 7. M.R. Ganjali, T. Poursaberi, F. Basiripour, M. Salavati-Niasari, M. Yousefi, M. Shamsipur,
Fresenius J. Anal. Chem., 370 (2001) 1091
8. M. R. Ganjali, P. Norouzi, F. Faridbod, M. Ghorbani and M. Adib, Anal. Chim. Acta, 569 (2006) 35
9. V. K. Gupta, R. N. Goyal and R. A. Sharma, Int. J. Electrochem. Sci., 4 (2009) 156
10.M. Javanbakht, A. Badiei, M. R. Ganjali, P. Norouzi, A. Hasheminasab and M. Abdouss, Anal. Chim. Acta, 601 (2007) 172
11.S. Chitravathi, B. E. Kumaraswamy, E. Niranjana, U. Chandra, G. P. Mamatha and B. S. Sherigara, Int. J. Electrochem. Sci., 4 (2009), 223
12.U. Chandra, O. Gilbert, B. E. K. Swamy, Y. D. Bodke and B. S. Sherigara, Int. J. Electrochem. Sci. 3 (2008), 1044
13.J. G. Manjunatha, B. E. K. Swamy, R. Deepa, V. Krishna, G. P. Mamatha, U. Chandra, S. S. Shankar and B. S. Sherigara, Int. J. Electrochem. Sci. 4 (2009) 662
14.B. N. Chandrashekar, B. E. K. Swamy, K. R. V. Mahesh, U. Chandra and B. S. Sherigara, Int. J. Electrochem. Sci. 4 (2009) 471
15.F. Faridbod, M. R. Ganjali, B. Larijani, M. Hosseini and P. Norouzi, Mater. Sci. Eng. C, 30 (2010) 555
16.F. Faridbod, M. R. Ganjali, B. Larijani, P. Norouzi, Electrochim. Acta 55 (2009) 234
17.O. Gilbert, B. E. K. Swamy, U. Chandra and B. S. Sherigara, Int. J. Electrochem. Sci. 4 (2009) 582.
18.N. Chowdappa, B. E. K. Swamy, E. Niranjana and B. S. Sherigara, Int. J. Electrochem. Sci. 4 (2009) 425.
19.M. Pandurangachar, B. E. K. Swamy, B. N. Chandrashekar and B. S. Sherigara, Int. J. Electrochem. Sci. 4 (2009) 1319.
20.A. Walcarius, Electroanalysis, 13 (2001) 701
21.B. Rezaei and S. Damiri, IEEE Sensors, 8 (2008) 1523
22.M. R. Ganjali, N. Motakef-Kazami, F. Faridbod, S. Khoee, P. Norouzi, J. Hazard. Mater. 173 (2010) 415
23.H. R. Zare and N. Nasirizadeh, Int. J. Electrochem. Sci, 4 (2009) 1691
24.J. B. Raoof, M. S. Hejazi, R. Ojani and E. H. Asl, Int. J. Electrochem. Sci., 4 (2009) 1436 25.G. P. Guo, F. Q. Zhao, F. Xiao and B. Z. Zeng, Int. J. Electrochem. Sci., 4 (2009) 1365 26.H. R. Zare, R. Samimi and M. M. Ardakani, Int. J. Electrochem. Sci., 4 (2009) 730
27.K. Kostarelos, L. Lacerda, G. Pastorin, W. Wu, S. Wieckowski, J. Luangsivilay, S. Godefroy, D. Pantarotto, J. P. Briand, S. Muller, M. Prato and A. Bianco, Nat. Nanotechnol., 2 (2007) 108 28.L. Lacerda, A. Bianco, M. Prato and K. Kostarelos, Adv. Drug Deliv. Rev., 58 (2006) 1460 29. M. R. Ganjali, N. Motakef-Kazemi, P. Norouzi and S. Khoee, Int. J. Electrochem. Sci., 4 (2009)
906
30. M. R. Ganjali, H. Khoshsafar, A. Shirzadmehr, M. Javanbakht and F. Faridbod, Int. J. Electrochem. Sci., 4 (2009) 435
31. H. Yaghoubian, H. Karimi-Maleh, M. A. Khalilzadeh and F. Karimi, Int. J. Electrochem. Sci. 4 (2009), 993
32. H. J. Wang, C. M. Zhou, J. H. Liang, H. Yu, F. Peng and J. Yang, Int. J. Electrochem. Sci. 3 (2008) 1258
33. D. J. Bogdal, Chem. Res., (1998) 468
34.S. Khode, V. Maddi, P. Aragade, M. Palkar, P. K. Ronad, Sh. Mamledesai, A. H. M. Thippeswamy, D. Satyanarayana, Europ. Jour. Med. Chem., (2008) 1
36.V. K. Gupta and P. Kumar, Anal. Chim. Acta, 389 (1999) 205
37.H. A. Zamani, M. T. Hamed-Mosavian, E. Hamidfar, M. R. Ganjali and P. Norouzi, Mater. Sci. Eng. C, 28 (2008) 1551
38.V. K. Gupta, A. K. Jain, L. P. Singh and U. Khurana, Anal. Chim. Acta, 355 (1997) 33 39.F. Faridbod, M. R. Ganjali and P. Norouzi, Int. J. Electrochem. Sci, 4 (2009) 1679 40.V. K. Gupta, A. K. Singh and B. Gupta, Anal. Chim. Acta, 575 (2006) 198
41.M. R. Ganjali, M. H. Zargazi and A. Mohajeri, Polish J. Chem., 75 (2001) 743
42.M. R. Ganjali, A. Rouhollahi, A. R. Mardan and M. Shamsipur, J. Chem. Soc-Faraday Trans, 94 (1998) 1959
43.A. K. Jain, V. K. Gupta, B. B. Sahoo and L. P. Singh, Analytical Proceedings including Analytical Communications, 32 (1995) 99
44.M. R. Ganjali, A. Alipour, S. Riahi and P. Norouzi, Int. J. Electrochem. Sci, 4 (2009) 1153 45.V. K. Gupta, R. Mangla and S. Agarwal, Electroanalysis 14 (2002) 1127
46.R. Prasad, V. K. Gupta and A. Kumar, Anal. Chim. Acta, 508 (2004) 61
47.A. K. Jain, V. K. Gupta, L. P. Singh, P. Srivastava and J. R. Raisoni, Talanta 65 (2005) 716 48.V. K. Gupta, R. Ludwig and S. Agarwal, Anal. Chim. Acta, 538 (2005) 213
49.A. K. Singh, V. K. Gupta and B. Gupta, Anal. Chim. Acta, 1 (2007) 171 50.S. K. Srivastava, V. K. Gupta, S. Jain, Electroanalysis 8 (1996) 938
51.F. Faridbod, M. R. Ganjali, L. Safaraliee, S. Riahi, M. Hosseini and P. Norouzi Int. J. Electrochem. Sci, 4 (2009) 1419
52.F. Faridbod, M. R. Ganjali, B. Larijani, M. Hosseini, K. Alizadeh and P. Norouzi, Int. J. Electrochem. Sci., 4 (2009) 1528
53.M. R. Ganjali, A. Alipour, S. Riahi, B. Larijani and P. Norouzi, Int. J. Electrochem. Sci., 4 (2009) 1262
54.M. R. Ganjali, B. Vesimohammadi, S. Riahi and P. Norouzi, Int. J. Electrochem. Sci., 4 (2009) 740 55.M. R. Ganjali, H. Shams, F. Faridbod, L. Hajiaghababaei, and P. Norouzi, Mater. Sci. Eng. C 29
(2009) 1380.
56.M. R. Ganjali, N. Davarkhah, H. Ganjali, B. Larijani, P. Norouzi and M. Hossieni, Int. J. Electrochem. Sci., 4 (2009) 762
57.M. R. Ganjali, F. Aboufazeli, S. Riahi, R. Dinarvand, P. Norouzi, M. H. Ghasemi, R. Kiani-Anbuhi and S. Meftah, Int. J. Electrochem. Sci., 4 (2009) 1138
58.M. R. Ganjali, P. Norouzi, A. Atrian, F. Faridbod, S. Meghdadi, and M. Giahi, Mater. Sci. Eng. C, 29 (2009) 205
59.S. Ershad and S. Kangari, Int. J. Electrochem. Sci., 4 (2009) 1100 60.A. S. Al Attas, Int. J. Electrochem. Sci., 4 (2009) 20
61.A. S. Al Attas, Int. J. Electrochem. Sci., 4 (2009) 9
62.F. Faridbod, M. R. Ganjali, S. Labbafi, R. Dinarvand, S. Riahi and P. Norouzi, Int. J. Electrochem. Sci., 4 (2009) 772
63.M. R. Ganjali, R. Nemati, F. Faridbod, P. Norouzi, F. Darviche, Int. J. Electrochem. Sci, 3 (2008) 1288