International Journal of Innovative Technology and Exploring Engineering (IJITEE) ISSN: 2278-3075, Volume-8 Issue-10, August 2019
Portfolio Selection using DEA-COPRAS at Risk –
Return Interface Based on NSE (India)
S. Gupta, G. Bandyopadhyay, M. Bhattacharjee, S. Biswas
Abstract: Portfolio formation holds paramount importance in the process of the investment decision making since, a single door investment (SDI) option is much riskier than a multiple door investment (MDI) option. Among available financial instruments, the stock market (SM) has allured investors because of its liquidity and growth opportunities. However, the effectiveness of the investment decision is largely reflected in the selection of the constituent elements of the portfolio by an investor while trading off risk and return. In this paper, after an initial level selection of for formulating a possible portfolio by using Perceptual Map (PM), we have applied DEA to calculate the efficiency of the stocks at the risk-return interface based on the market performance. In order to ascertain that the stock selection is logical and worthwhile, we further probe the fundamental performances over a time period of five consecutive financial years using the method of Multi-Criteria Decision Analysis (MCDA) framework based on the Complex Proportional Assessment (COPRAS) method, where, the criteria weights are calculated by using the entropy method. A consistency is visible in the yearly fundamental performances and a significant pattern with regard to the portfolio selection.
Keywords: Portfolio Selection, Stock Market, Perceptual Mapping, Data Envelopment Analysis (DEA), Complex Proportional Assessment (COPRAS).
I. INTRODUCTION
In the post-liberalization period, the Indian stock market (ISM) has witnessed a transformational growth, which substantially has accelerated by several reformatory initiatives taken by the Govt. of India (GOI) and rapid development at the Information Technology (IT) frontier. Because of its comparatively higher return with respect to the other conventional investment options like Fixed Deposits (FD), National Savings Certificates (NSC), and Public Provident Funds (PPF), ISM has been a lucrative investment avenue for the investors. However, in line with the famous propositions of renowned investment experts, one has to invest in multiple stocks instead of choosing a ‘perfect’ single stock because of two reasons: first, as stock market movement is dynamic and changing in nature and so as the behavior of the investors, the word ‘perfect’ is quite far-fetched; second, a bundle of stocks
Revised Manuscript Received on August 05, 2019
Sayan Gupta, Management studies, National Institute of Technology, Durgapur, India.
Gautam Bandyopadhyay, Management studies, National Institute of Technology, Durgapur, India.
Malay Bhattacharjee, Management studies, National Institute of Technology, Durgapur, India. Email: malay.
Sanjib Biswas, Management studies, Calcutta Business School, Kolkata, India.
(preferably from the heterogeneous sectors) eases out the effect of the total risk. For rational capital investment in the stock market forming a portfolio is therefore quite imperative for negating the ‘risk’ factor while increasing the ‘return’ (Steinbach, 2001; Rubinstein, 2002). The underlying quest is how to allocate the total capital among the stocks forming the portfolio for balancing risk and return in line with the investors’ financial perspectives and choices. In other words, the basic intention is to reduce the apparent controllable risk through effective diversification, which, in the domain of portfolio management, known as the diversifiable or unsystematic risk. Essentially, it forms the basic premise of the Modern Portfolio Theory (MPT) which rests on the principles of maximizing the return expected from a given portfolio while reducing portfolio risk (Fabozzi et al., 2002). MPT started with the seminal work by Markowitz (1952) addressed the issue of the portfolio selection within the framework of Mean-Variance (MV). While extending the theory, researchers postulated the use of Skewness and Kurtosis (Jaro and Na, 2005; Bhattacharyya et al., 2011; Bhattacharyya and Kar, 2011). In this regard, Briec et al. (2007) put forth the shortage function concept for measuring relative efficiencies with the objectives such as an increase in the mean return and skewness while decreasing the variances. Therefore, selection of the stocks for constructing a portfolio depends on multiple objectives which not only covers the return aspects, but also considers risk-based attributes and timing considerations. Further, the choice of portfolio selection is subject to the fulfillment of multiple objectives or criteria by trading off at the risk-return interface. Meanwhile, it is equally important to reflect on the fundamental performances of the constituent stocks at the organizational level, complementing the framework suggested by Markowitz (1952) and subsequently other extended frameworks (Jaro and Na, 2005). Quite understandably it provides the stability to the rational investment decision making by understanding the intrinsic value of the organizations (which assumes fair linkage with the stock level performance), efficiency and growth (Yoo and Shin, 2015). With this pretext, the paper is organized as follows. The next part looks into literature of same area of study. In the third part, we summarize the methodological framework used for the study.
After this, we present the results and include subsequent discussions related to the findings. Lastly, the concluding section of the paper presents some remarks based on the result and highlights further scope for research.
II. LITERATURE REVIEW
DEA has been a widely used non-parametric approach for performance evaluation (Zohdiet al., 2012) used for measuring efficiencies of the Decision-Making Units or DMUs in terms of efficiency scores which considers how much output is produced at a given consumption of the inputs. It has been considered by several researchers in evaluating the stocks based on the market performances as well as at the fundamental level. DEA intends to form an efficient frontier which points out maximum output (minimum input) at a specified level of input (output) as derived from the outputs and inputs which are observed in the DMUs. In turn, the DMUs which lie on and above the best practice or efficient frontier are accepted as ‘efficient’ units as compared to those which fall under the same (relatively efficient or non-efficient as decided by their relative distances from the efficient frontier) (Ferreira and Souza, 2015).The author (Morey and Morey, 1999) applied DEA in the context of the MV framework where they considered the variance as the input and expected return as the output. Abad et al. (2004) proposed a double-staged DEA framework based on the fundamental accounting parameters. Edirisinghe and Zhang (2007) put forth a generalized DEA framework to ascertain the financial strengths of the incumbent stocks in terms of predictive stock price return which is based on financial statements analysis. Zohdi et al. (2012) applied DEA in order to compare the stocks using financial ratios. However, though DEA is assessing the efficiencies of the DMUs which are comparable under a homogeneous operating environment, it cannot discriminate them in the orderly fashion precisely consider the preferences of the consumers, here, investors (Madlener et al., 2009). In other words, DEA classifies the DMUs into two broad categories: efficient and non-efficient. This paves the way to use the MCDM frameworks which enable the decision maker to rank the DMUs in tune with a number of criteria as provided by a decision maker. Over the years, researchers (Tsao, 2003; Xidonas et al., 2009, 2010; Tiryaki and Ahlatcioglu, 2009; Kiris and Ustun, 2010; Qu et al., 2011; Baležentis et al., 2012; Maikaew and Yanpirat, 2012; Shen et al., 2014; Poklepovic and Babic, 2014; Jamshidi and Ramshini, 2014; Dincer, 2015; Karmakar et al., 2018) have adopted and applied several outranking and attribute based MCDM approaches (using the crisp as well as the fuzzy frameworks) like TOPSIS, ELECTRE III, PROMETHEE, VIKOR, SAW, ARAS, AHP, MOORA, and MABAC. Some researchers (Tsao, 2006; Ballestero and Pla-Santamaria, 2003; Parra et al., 2001; Ehrgott et al., 2004; Ogryczak, 2000) also attempted to construct and solve the portfolio choice related decision through mathematical programs. While doing the performance-based assessment of the stocks
for portfolio selection, researchers put emphasis on both the fundamental as well as return based parameters. Tsao (2003) considered ROE, EPS, Operational Income per Capital employed Net Income along with qualitative parameters like Service Quality. Ehrgott (2004) followed the utility-based assessment approach. Gupta et al. (2008) put forth a Semi-Absolute Deviation (SAD) framework considering both the aggressive and semi-aggressive standpoints. Xidonas et al. (2009) took into account three dimensions such as risk, return and market perception (i.e., acceptance) related to the fundamental and market return parameters. In line with this work, Ghaffari Nasab et al. (2011) contemplated on the stock performance using the parameters like liquidity, sales and market share. On the other hand, Ferreira et al. (2009) considered the economic indicators. With respect to these works, Kiris and Ustun (2010) attempted to view the whole agenda from the perspectives of investors, financial structure and sustainable business results. Baležentis et al. (2012) compared different sectors of Lithuania based on financial ratios while Pokle povic and Babic (2014)’s framework took into account the criteria like Beta, EPS, P/B ratio, P/S ratio, ROE, and ROA along with Volume, Standard Deviation, and Mean. Additionally, Deep et al. (2009) considered dividend where they took both the short run as well as long run return. However, there are limited instances wherein efficiency assessment and subsequent rankings have been carried out, though, Mansouri et al. (2014) in the context of the Tehran stock exchange attempted to provide a DEA-TOPSIS based framework. Hence, in this study, we propose a combined framework wherein after identifying the efficient DMUs or stocks based on their relative market performances (using PM and DEA), we use MCDM framework for classifying them further considering the fundamental (i.e., accounting based) parameters.
III.
METHODOLOGYInternational Journal of Innovative Technology and Exploring Engineering (IJITEE) ISSN: 2278-3075, Volume-8 Issue-10, August 2019
After obtaining the results, a proportionate based comparative ranking method (i.e., MCDM) such as COPRAS is applied taking into considerations four fundamental parameters at risk-return interface.
A. DATA
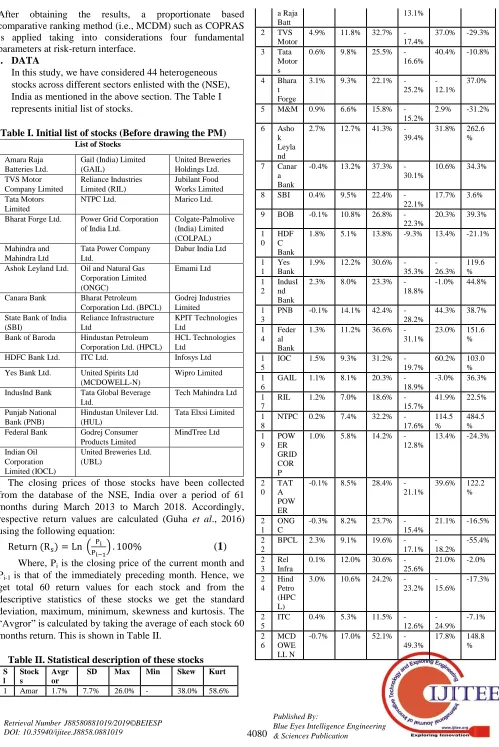
In this study, we have considered 44 heterogeneous stocks across different sectors enlisted with the (NSE), India as mentioned in the above section. The Table I represents initial list of stocks.
Table I. Initial list of stocks (Before drawing the PM)
List of Stocks
Amara Raja Batteries Ltd.
Gail (India) Limited (GAIL) United Breweries Holdings Ltd. TVS Motor Company Limited Reliance Industries Limited (RIL) Jubilant Food Works Limited Tata Motors Limited
NTPC Ltd. Marico Ltd. Bharat Forge Ltd. Power Grid Corporation
of India Ltd.
Colgate-Palmolive (India) Limited (COLPAL) Mahindra and
Mahindra Ltd
Tata Power Company Ltd.
Dabur India Ltd Ashok Leyland Ltd. Oil and Natural Gas
Corporation Limited (ONGC)
Emami Ltd Canara Bank Bharat Petroleum
Corporation Ltd. (BPCL)
Godrej Industries Limited State Bank of India
(SBI)
Reliance Infrastructure Ltd
KPIT Technologies Ltd
Bank of Baroda Hindustan Petroleum Corporation Ltd. (HPCL)
HCL Technologies Ltd
HDFC Bank Ltd. ITC Ltd. Infosys Ltd Yes Bank Ltd. United Spirits Ltd
(MCDOWELL-N)
Wipro Limited IndusInd Bank Tata Global Beverage
Ltd.
Tech Mahindra Ltd Punjab National
Bank (PNB)
Hindustan Unilever Ltd. (HUL)
Tata Elxsi Limited Federal Bank Godrej Consumer
Products Limited
MindTree Ltd Indian Oil
Corporation Limited (IOCL)
United Breweries Ltd. (UBL)
The closing prices of those stocks have been collected from the database of the NSE, India over a period of 61 months during March 2013 to March 2018. Accordingly, respective return values are calculated (Guha et al., 2016) using the following equation:
(
1
)
Where, Pi is the closing price of the current month and
Pi-1 is that of the immediately preceding month. Hence, we
[image:3.612.49.548.42.789.2] [image:3.612.47.299.181.523.2]get total 60 return values for each stock and from the descriptive statistics of these stocks we get the standard deviation, maximum, minimum, skewness and kurtosis. The “Avgror” is calculated by taking the average of each stock 60 months return. This is shown in Table II.
Table II. Statistical description of these stocks
S l Stock s Avgr or
SD Max Min Skew Kurt
1 Amar 1.7% 7.7% 26.0% - 38.0% 58.6%
a Raja Batt
13.1% 2 TVS
Motor
4.9% 11.8% 32.7% -17.4%
37.0% -29.3% 3 Tata
Motor s
0.6% 9.8% 25.5% -16.6%
40.4% -10.8% 4 Bhara
t Forge
3.1% 9.3% 22.1% -25.2%
-12.1%
37.0% 5 M&M 0.9% 6.6% 15.8%
-15.2%
2.9% -31.2% 6 Asho
k Leyla nd
2.7% 12.7% 41.3% -39.4%
31.8% 262.6 % 7 Canar
a Bank
-0.4% 13.2% 37.3% -30.1%
10.6% 34.3% 8 SBI 0.4% 9.5% 22.4%
-22.1%
17.7% 3.6% 9 BOB -0.1% 10.8% 26.8%
-22.3%
20.3% 39.3% 1
0 HDF C Bank
1.8% 5.1% 13.8% -9.3% 13.4% -21.1% 1
1 Yes Bank
1.9% 12.2% 30.6% -35.3% -26.3% 119.6 % 1 2 IndusI nd Bank
2.3% 8.0% 23.3% -18.8%
-1.0% 44.8% 1
3
PNB -0.1% 14.1% 42.4% -28.2%
44.3% 38.7% 1
4 Feder al Bank
1.3% 11.2% 36.6% -31.1%
23.0% 151.6 % 1
5
IOC 1.5% 9.3% 31.2% -19.7%
60.2% 103.0 % 1
6
GAIL 1.1% 8.1% 20.3% -18.9%
-3.0% 36.3% 1
7
RIL 1.2% 7.0% 18.6% -15.7%
41.9% 22.5% 1
8
NTPC 0.2% 7.4% 32.2% -17.6% 114.5 % 484.5 % 1 9 POW ER GRID COR P
1.0% 5.8% 14.2% -12.8%
13.4% -24.3%
2 0 TAT A POW ER
-0.1% 8.5% 28.4% -21.1%
39.6% 122.2 % 2
1 ONG C
-0.3% 8.2% 23.7% -15.4%
21.1% -16.5% 2
2
BPCL 2.3% 9.1% 19.6% -17.1% -18.2% -55.4% 2 3 Rel Infra
0.1% 12.0% 30.6% -25.6%
21.0% -2.0% 2 4 Hind Petro (HPC L)
3.0% 10.6% 24.2% -23.2% -15.6% -17.3% 2 5
ITC 0.4% 5.3% 11.5% -12.6% -24.9% -7.1% 2 6 MCD OWE LL N
-0.7% 17.0% 52.1% -49.3%
2 7
TAT A GLO BAL
1.3% 9.3% 23.5% -20.0%
-15.2%
-14.9%
2 8
HUL 1.8% 6.1% 22.3% -6.8% 109.2 %
234.5 % 2
9 GOD REJ CP
1.7% 6.3% 16.4% -12.9%
0.9% 15.9% 3
0
UBL 0.7% 8.8% 22.4% -21.2%
-44.2%
124.4 % 3
1 UB (H) L
-3.2% 19.6% 42.9% -51.7%
-26.2%
49.9% 3
2 JUBI LAN T FOO DWO RKS
0.6% 11.5% 33.1% -24.6%
39.5% 11.8%
3 3
MAR ICO
1.8% 5.5% 17.9% -12.8%
5.0% 80.6% 3
4 COLP AL
0.8% 5.6% 17.0% -13.4%
-3.9% 159.1 % 3
5 DAB UR
1.6% 4.8% 11.5% -10.0%
-22.3%
-40.3% 3
6 EMA MI LTD
2.1% 7.8% 18.7% -15.3%
18.7% 9.6% 3
7 GOD REJ IND
1.2% 8.4% 21.4% -18.4%
14.0% -2.3% 3
8 KPIT TEC H
0.8% 12.7% 24.8% -58.4%
-185.4 %
746.2 % 3
9 HCL TEC H
1.6% 6.8% 18.9% -12.5%
10.1% 5.7% 4
0 INFO SYS
0.7% 7.8% 18.5% -25.7%
-66.8%
135.7 % 4
1
Wipro 0.7% 7.2% 22.7% -22.7%
-11.6%
225.5 % 4
2 TEC H MAH INDR A
1.2% 7.8% 16.2% -18.8%
-34.4%
-35.1%
4 3
TAT A ELXS I
3.7% 12.6% 37.6% -20.6%
111.0 %
106.7 % 4
4 MIN DTR EE
1.9% 9.4% 17.6% -21.8%
-45.6%
-51.4%
We apply perceptual map (PM) where the origin of axes is shifted to the point having Combined Mean (CAR) and combined Standard Deviation (CSD) values. Hence, the results construct four new quadrants representing “(Low SD, Low Mean), (Low SD, High Mean) (High Mean, High SD), (High SD, Low Mean)”, shown in the figure 1.
Combined AVROR (CAR) = Average (AVROR) (2)
Combined SD (CSD) =
; where, dj= Average
return for jth Stocks – CAR; j = 1,2,…k (3)
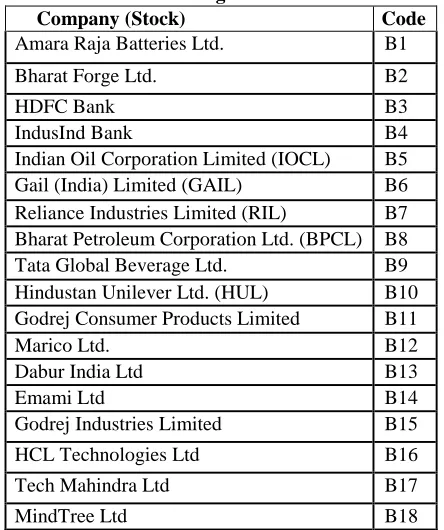
[image:4.612.317.539.108.373.2]The PM classifies the stocks and accordingly we get total 18 stocks fall under the category ‘low risk and high return’ (Table III).
Table III.List of the selected 18 companies (i.e., stocks) using PM
Company (Stock) Code
Amara Raja Batteries Ltd. B1
Bharat Forge Ltd. B2
HDFC Bank B3
IndusInd Bank B4
Indian Oil Corporation Limited (IOCL) B5
Gail (India) Limited (GAIL) B6
Reliance Industries Limited (RIL) B7
Bharat Petroleum Corporation Ltd. (BPCL) B8
Tata Global Beverage Ltd. B9
Hindustan Unilever Ltd. (HUL) B10
Godrej Consumer Products Limited B11
Marico Ltd. B12
Dabur India Ltd B13
Emami Ltd B14
Godrej Industries Limited B15
HCL Technologies Ltd B16
Tech Mahindra Ltd B17
MindTree Ltd B18
In the next phase, we have used DEA to calculate the efficiency-based scores of the stocks (total 18 numbers as obtained from the PM) based on four parameters: Average Return (Avgror), Standard Deviation (SD), Skewness (Skew) and Kurtosis (Kurt). In the present study, the normalized values of all these parameters are used. Average return, the first order moment about the origin signifies the mean return generated by the stock over the period of study while SD (second order moment about the mean) represents the variability in the return (i.e., the scattered nature of the return distribution). However, several researchers (Samuelson, 1970; Konno and Suzuki, 1995; Konno et al., 1993; Stone, 1973; Chunhachinda et al., 1997; Bhattacharyya et al., 2011; Beardsley et al., 2012) have pointed out that the higher order moments are of significance in deciding the performance of the stocks. Hence, we also include them (Skewness and Kurtosis) in our study. Skewness (third order moment about the mean) signifies the possibility of a higher pay-off at the given values of mean and variance while Kurtosis (fourth order moment about the mean) is an indicator of the peakedness which essentially represents the future price behavior adjusted by the volatility.
International Journal of Innovative Technology and Exploring Engineering (IJITEE) ISSN: 2278-3075, Volume-8 Issue-10, August 2019
The underlying aim is to formulate an optimal portfolio from the perspective of the investor which ensures maximum possible return under varying risk levels or minimum affordable risk with varying expected return values (Banihashemi and Sanei, 2015). In order to rank these stocks using COPRAS we consider four fundamental criteria such as: Return on Assets (ROA), Return on Equity (ROE), Asset Turnover (AT), and Financial Leverage (FL). For calculation purposes necessary data are obtained from the database of CMIE Prowess IQ. The value of ROA (net income /total assets) signifies the capacity of the company to make profits (i.e., return) by using its assets. On the other hand, the value of ROE (net income/ shareholders’ equity) is interpreted as the ability to report profit (i.e., return) by the organization on account of the investment made by the investors (Heikal et al., 2014). AT (Ratio of total sales and total assets) is an indicator of the ability of the organizations to generate sales out of their assets. In other words, it specifies the competitive capabilities of the management (Altman, 1968). Higher values of these ratios indicate healthy position of the company. Hence, they are beneficial (B) criteria from the perspective of the investors. Meanwhile, FL indicates firm’s liability in relation to its assets, i.e., default risk in the near future (Rajan and Zingales, 1995). Therefore, it is non-beneficial (NB) in nature.
B. PERCEPTUAL MAP (PM)
Perceptual Mapping is a diagrammatic technique to display the perception of investor with respect to mean (Return) and SD (Risk). In our study, PM typically displayed the position of mean and SD with respect to combined mean and combined SD. Here, combined mean and combined SD shifted its axis from the origin and classify the map into four quadrant which are High Mean High SD, High Mean Low SD , Low Mean High SD and Low Mean Low SD.
C. DEA (DATA ENVELOPMENT ANALYSIS) In operations research and economics study, the data envelopment analysis (DEA) is a nonparametric method to estimate the production frontiers. It is utilized to exactly quantify beneficial effectiveness of basic leadership units (DMUs). In the study works of Charnes et al. (1978) and Banker et al. (1989), the calculations for an input-oriented DEA are given as under:
Constant Return to Scale (CRS) model:
Subject to
(4)
(5) Variable Return to Scale (VRS) model:
Subject to
(6)
(7) ;
In case if two or more DMUs stand efficient (i.e. θ = 1 or 100%) then the Super-efficiency value is calculated in order to discriminate them. For VRS the super efficiency is given by:
Subject to
(8)
(9) ; ; j ≠ t
D. ENTROPY METHOD
This is an objective method for calculating the criteria weights based on the relative information storage, i.e., based on the level of disorder (Shannon, 1948). Higher entropy value signifies greater amount of information contained by the respective criterion. In line with the steps as described by Li et al. (2011), the said method can be explained as:
Let, is the decision matrix where i=
1,2,3….m is the number of alternatives and j= 1,2,3… n is the number of criteria. Hence, : jth criterion value for the
alternative ith
Step1: Standardization of the Criteria (for avoiding criteria influence on the alternatives)
Suppose, is the standardized matrix.
Where
(For
beneficial criteria) (10)
(For non-beneficial criteria) Step 2: Entropy calculation
Entropy of the jth criterion is given by: = -
(11)
Where,
=
(12)
Step 3: Derivation of the weight
The weight (based on entropy value) of the jth criterion is obtained by:
E. COPRAS (COMPLEX PROPORTIONAL ASSESSMENT)
The COPRAS method considers the direct and proportional dependencies of the conflicting criteria (maximizing or minimizing in nature) on the alternatives for generating evaluation results (Zavadskas et al., 2009; Chatterjee and Chakraborty, 2014). There has been a plethora of research contributions using COPRAS as an MCDA aid in solving complex decision-making problems (Vilutiene and Zavadskas, 2003; Kaklauskas et al., 2005; Viteikiene and Zavadskas, 2007; Madićet al., 2014; Kundakcı and Işık, 2016). The steps in evaluating the significance and priority of the alternatives using COPRAS method are as under:
Step 1: Construct the normalized decision matrix
There are a number of approaches available for normalization (Ginevicius, 2007; Zavadskas et. al., 2008). In this method, the normalized value of the ith alternative for jth criterion is given by:
(14)
i = 1,2…..m (number of alternatives); j= 1, 2, 3… n (number of criteria)
Step 2: Calculation of the sums of the weighted normalized criteria
The underlying objective of this method is to optimize both the maximizing and minimizing criteria, but in two directions: ideal and anti-ideal. Necessary calculations for maximizing and minimizing criteria are given as:
(15) (16)
Here, k is the number of maximizing (i.e., beneficial) criteria and is the significance of the jth criterion.
Step 3: Calculation of the relative weights of the alternatives
The relative weight for any alternative (ith) is given as:
(17) Or (in simpler form)
(18) The utility for each alternative is given by:
(19) Decision rule: The alternative which secures highest utility will be ranked first and so on.
For analysis purpose in our study we use Microsoft Excel (office 10 version) and IBM SPSS (version 20) software tools.
[image:6.612.315.537.164.340.2]IV. RESULTS AND ANALYSIS
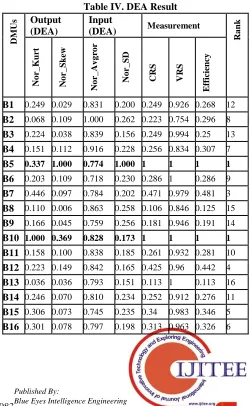
Fig 1 exhibits the PM which classifies the stocks based on return (high or low) and risk (high or low) dimensions. Accordingly, we get the 18 stocks as mentioned in the table III. We then conduct DEA. Table IV summarizes the findings of DEA. It is evident from the results of the DEA
that B10 (i.e. HUL) and B5 (i.e. IOCL) both achieves 100 percent efficiency and B7 (i.e. RIL) comes in the top 3 list. On the other hand, B13 (i.e. Dabur), B17 (i.e. Tech Mahindra) and B18 (i.e. MindTree) belong to bottom 3 lists.
However, looking into their price movements during the study period and considering their relative business value, it is not so comprehensive in nature, though; DEA provides a considerably fair idea about their relative positions based on return distribution-based parameters.
[image:6.612.302.552.369.775.2]Fig 1. Perceptual Map (for 44 stocks – initial list)
Table IV. DEA Result
DMUs
Output (DEA)
Input
(DEA) Measurement
Ra
n
k
No
r_
K
u
rt
No
r_
S
k
ew
No
r_
Av
g
ro
r
No
r_
S
D
CRS VRS
Efficie
n
cy
B1 0.249 0.029 0.831 0.200 0.249 0.926 0.268 12
B2 0.068 0.109 1.000 0.262 0.223 0.754 0.296 8
B3 0.224 0.038 0.839 0.156 0.249 0.994 0.25 13
B4 0.151 0.112 0.916 0.228 0.256 0.834 0.307 7
B5 0.337 1.000 0.774 1.000 1 1 1 1
B6 0.203 0.109 0.718 0.230 0.286 1 0.286 9
B7 0.446 0.097 0.784 0.202 0.471 0.979 0.481 3
B8 0.110 0.006 0.863 0.258 0.106 0.846 0.125 15
B9 0.166 0.045 0.759 0.256 0.181 0.946 0.191 14
B10 1.000 0.369 0.828 0.173 1 1 1 1
B11 0.158 0.100 0.838 0.185 0.261 0.932 0.281 10
B12 0.223 0.149 0.842 0.165 0.425 0.96 0.442 4
B13 0.036 0.036 0.793 0.151 0.113 1 0.113 16
B14 0.246 0.070 0.810 0.234 0.252 0.912 0.276 11
B15 0.306 0.073 0.745 0.235 0.34 0.983 0.346 5
International Journal of Innovative Technology and Exploring Engineering (IJITEE) ISSN: 2278-3075, Volume-8 Issue-10, August 2019
B17 0.083 0.035 0.794 0.232 0.089 0.923 0.097 17
B18 0.036 0.017 0.862 0.271 0.037 0.838 0.044 18
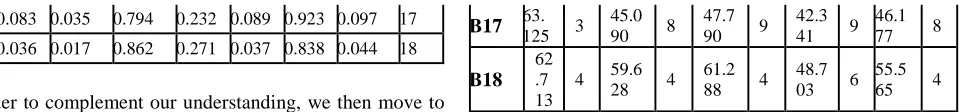
[image:7.612.71.551.48.104.2]In order to complement our understanding, we then move to analyzing the fundamental performances (year wise) of the stocks under consideration during the study period (i.e., April 2013 to March 2018). In order to do so, we apply the COPRAS method. Table VI provides the year to year ranking of the stocks (18 numbers) based on the fundamental criteria as mentioned in the above, while table V. presents the criteria weight as obtained from the Entropy method.
Table V. Criteria Weights (From Entropy Method) Criterio
n C1 C2 C3 C4
H-Value 0.925056 0.945288 0.938938 0.964535
[image:7.612.47.293.307.743.2]Weights 0.331344 0.241893 0.269967 0.156797
Table VI. COPRAS Based Ranking Of The Stocks (Yearly Basis)
DM Us FR 2013-14 FR 2014-15 FR 2015-16 FR 2016-17 FR 2017-18 U - Va lu e Ra n k U - Va lu e Ra n k U - Va lu e Ra n k U - Va lu e Ra n k U - Va lu e Ra n k
B1 56.
412 5 56.4
34 6
60.8 53 5
53.5 24 4
49.4
87 6
B2 27.
556 1 3 34.1 23 1 1 31.1 54 1 2 30.8 77 1 2 33.1 01 1 3
B3 9.4
70 1 8 9.77 1 1 8 10.0 66 1 8 10.5 34 1 8 11.5 03 1 8
B4 9.930 17 10.547 17 80 11.0 17 10.783 17 11.611 17 B5 27.
811 1 2 25.0 44 1 2 31.4 24 1 1 38.3 28 1 1 39.9 07 1 1
B6 29.
802 1 1 23.3 58 1 3 21.5 60 1 5 26.5 45 1 3 33.7 83 1 2
B7 27.
152 1 4 22.9 87 1 4 21.6 60 1 4 20.2 85 1 5 21.9 12 1 5
B8 42.
850 9 42.0
06 9
48.0 12 8
47.5 98 7
47.5
52 7
B9 24.
982 1 5 19.8 87 1 5 23.4 77 1 3 23.4 40 1 4 25.3 09 1 4
B10 100 1 100 1 100 1 100 1 100 1
B11 33.
151 1 0 34.6 89 1 0 40.1 09 1 0 38.3 65 1 0 41.3
75 9
B12 45.
411 8 58.9
20 5
68.8 77 2
69.6 62 2
67.1
37 2
B13 53.
305 7 53.4
60 7
57.4 42 6
52.5 05 5
50.7
06 5
B14 76.
229 2 75.8
69 2
50.5 86 7
43.6 96 8
40.8 22
1 0
B15 17.
705 1 6 18.5 32 1 6 20.3 19 1 6 15.2 57 1 6 16.6 46 1 6
B16 54.
071 6 62.0
32 3
61.7 12 3
54.6 70 3
55.9
07 3
B17 63.
125 3 45.0
90 8
47.7
90 9
42.3 41 9
46.1
77 8
B18
62 .7 13
4 59.6
28 4
61.2
88 4
48.7 03 6
55.5
65 4
It is now comprehensibly evident that B10(HUL) stands out the top performer based on fundamental performance criteria during the entire study period. The same holds good for B15 (Godrej Industries Ltd), B4 (IndusInd Bank), and B3(HDFC Bank) as they consistently hold the last three positions. However, there are some interesting observations. First, it is only HUL that could secure the top position both in terms of the market performance as well as the fundamental one. Otherwise, there is no significant consistency between the market performance (as revealed through the DEA results) and fundamental criteria-based rankings (as obtained through COPRAS). There could be many reasons. Perhaps, as during the study period some sectors (e.g., Banks) underwent major reformatory moves as compared to the sectors like FMCG, there is an inconsistency between the performances of the stocks at two levels: market and account. Second, the performances of the stocks at the fundamental level are consistent in nature and the consistency level is statistically highly significant. This we can infer from the results of the Spearman’s Rank Correlation test (Table VII). Under this method, the correlation coefficient is given by:
(20)
Here, di is the difference in the rankings for the alternative
i, as generated by different MCDM methods. Table VII. Rank Correlation Results
Here, FR_2013_14 indicates the ranking of the alternatives (i.e., DMUs) based on the fundamental parameters for the financial year 2013-14.
V. CONCLUSION
In the present study, a holistic approach has been adopted for understanding the performances of the stocks which is provided by integrating the market performance with the fundamental counterpart in an MCDM framework using a three stage model (Perceptual Map – DEA – COPRAS) and we found that B10(HUL) stands out the top performer based market performance and fundamental performance. The study aims to bolster the individual investors to invest in the stock which has low stock price and choose their portfolio on the basis of high return- low
risk.
FR_2013_14 FR_2014_15 FR_2015_16 FR_2016_17 FR_2017_18
FR_2013_14 1.000
FR_2014_15 .946** 1.000
FR_2015_16 .866** .950** 1.000
FR_2016_17 .858** .932** .986** 1.000
FR_2017_18 .847** .907** .973** .983** 1.000
VI. FUTURE SCOPE
This study provokes some interesting further research agenda. One can study the detailed organizational level performance study. As a matter of fact, the sample considered is rather small in nature and poses a challenge to a detailed study. Thus, it might be appropriate to consider this as a ‘pilot study’ which needs further exploration. But individual conservative investors are likely to profit by the outcome of the study in their portfolio construction.
ACKNOWLEDGEMENT
Authors acknowledge the MHRD and National Institute of Technology, Durgapur for providing the research fellowship
to one the author of this study.
REFERENCES:
1. Abad, C., Thore, S. A., & Laffarga, J. (2004). Fundamental analysis of stocks by two‐stage DEA. Managerial and Decision Economics, 25(5), 231-241
2. Altman, E. I. (1968). Financial ratios, discriminant analysis and the prediction of corporate bankruptcy. The journal of finance, 23(4), 589-609.
3. Baležentis, A., Baležentis, T., & Misiunas, A. (2012). An integrated assessment of Lithuanian economic sectors based on financial ratios and fuzzy MCDM methods. Technological and Economic Development of Economy, 18(1), 34-53.
4. Ballestero, E., & Plà–Santamaría, D. (2003). Portfolio selection on the Madrid exchange: A compromise programming model. International Transactions in Operational Research, 10(1), 33-51.
5. Banihashemi, S., & Sanei, M. (2015). Portfolio performance evaluation in modified mean-variance models. International Journal of Applied, 5(4), 103-117.
6. Banker, R. D., Charnes, A., Cooper, W. W., & Clarke, R. (1989). Constrained game formulations and interpretations for data envelopment analysis. European Journal of Operational Research, 40(3), 299-308.
7. Beardsley, X. W., Field, B., & Xiao, M. (2012). Mean-variance-skewness-kurtosis portfolio optimization with return and liquidity. Communications in Mathematical Finance, 1(1), 13-49. 8. Bhattacharyya, R., Kar, S., & Majumder, D. D. (2011). Fuzzy mean–
variance–skewness portfolio selection models by interval analysis. Computers & Mathematics with Applications, 61(1), 126-137.
9. Bhattacharyya, R., & Kar, S. (2011). Multi-objective fuzzy optimization for portfolio selection: an embedding theorem approach. Turkish Journal of Fuzzy Systems, 2(1), 14-35.
10. Briec, W., Kerstens, K., & Jokung, O. (2007). Mean-variance-skewness portfolio performance gauging: a general shortage function and dual approach. Management science, 53(1), 135-149.
11. Charnes, A., Cooper, W. W., & Rhodes, E. (1978). Measuring the efficiency of decision making units. European journal of operational research, 2(6), 429-444.
12. Chatterjee, P., & Chakraborty, S. (2014). Flexible manufacturing system selection using preference ranking methods: A comparative study. International Journal of Industrial Engineering Computations, 5(2), 315-338.
13. Chunhachinda, P., Dandapani, K., Hamid, S., & Prakash, A. J. (1997). Portfolio selection and skewness: Evidence from international stock markets. Journal of Banking & Finance, 21(2), 143-167.
14. Deep, K., Singh, K. P., Kansal, M. L., & Mohan, C. (2009). A fuzzy interactive approach for optimal portfolio management. Opsearch, 46(1), 69-88.
15. Dincer, H. (2015). Profit-based stock selection approach in banking sector using Fuzzy AHP and MOORA method. Global Business and Economics Research Journal, 4(2), 1-26.
16. Edirisinghe, N. C., & Zhang, X. (2007). Generalized DEA model of fundamental analysis and its application to portfolio optimization. Journal of banking & finance, 31(11), 3311-3335.
17. Ehrgott, M., Klamroth, K., & Schwehm, C. (2004). An MCDM approach to portfolio optimization. European Journal of Operational Research, 155(3), 752-770.
18. Fabozzi, F. J., Gupta, F., & Markowitz, H. M. (2002). The legacy of modern portfolio theory. The Journal of Investing, 11(3), 7-22. 19. Ferreira, N., & Souza, A. M. (2015). Efficiency in stock markets with
DEA: evidence from PSI20. Efficiency in stock markets with DEA: evidence from PSI20, (1), 861-865.
20. Ghaffari-Nasab, N., Ahari, S., & Makui, A. (2011). A portfolio selection using fuzzy analytic hierarchy process: A case study of Iranian pharmaceutical industry. International Journal of Industrial Engineering Computations, 2(2), 225-236.
21. Ginevičius, R. (2008). Normalization of quantities of various dimensions. Journal of business economics and management, (1), 79-86.
22. Guha, B., Dutta, A., & Bandyopadhyay, G. (2016). measurement of risk vs return of Indian sectoral indices. Journal of Advanced Management Science Vol, 4(2).
23. Gupta, S., Bandyopadhyay, G., Biswas, S., & Upadhyay, A. (2019). A Hybrid Machine Learning and Dynamic Nonlinear Framework for Determination of Optimum Portfolio Structure. In Innovations in Computer Science and Engineering (pp. 437-448). Springer, Singapore.
24. Khadafi, M., Heikal, M., & Ummah, A. (2014). Influence analysis of return on assets (ROA), return on equity (ROE), net profit margin (NPM), debt to equity ratio (DER), and current ratio (CR), against corporate profit growth in automotive in Indonesia Stock Exchange. International Journal of Academic Research in Business and Social Sciences, 4(12).
25. Joro, T., & Na, P. (2006). Portfolio performance evaluation in a mean– variance–skewness framework. European Journal of Operational Research, 175(1), 446-461.
26. Kaklauskas, A., Zavadskas, E. K., & Raslanas, S. (2005). Multivariant design and multiple criteria analysis of building refurbishments. Energy and Buildings, 37(4), 361-372.
27. Kaklauskas, A., Zavadskas, E. K., Raslanas, S., Ginevicius, R., Komka, A., & Malinauskas, P. (2006). Selection of low-e windows in retrofit of public buildings by applying multiple criteria method COPRAS: A Lithuanian case. Energy and buildings, 38(5), 454-462. 28. Karmakar, P., Dutta, P., & Biswas, S. (2018). Assessment Of Mutual
Fund Performance Using Distance Based Multi-Criteria Decision Making Techniques-An Indian Perspective. Research Bulletin, 44(1), 17-38.
29. Konno, H., Shirakawa, H., & Yamazaki, H. (1993). A mean-absolute deviation-skewness portfolio optimization model. Annals of Operations Research, 45(1), 205-220.
30. Konno, H., & Suzuki, K. I. (1995). A mean-variance-skewness portfolio optimization model. Journal of the Operations Research Society of Japan, 38(2), 173-187.
31. Kundakcı, N., & Işık, A. (2016). Integration of MACBETH and COPRAS methods to select air compressor for a textile company. Decision Science Letters, 5(3), 381-394.
32. Li, X., Wang, K., Liu, L., Xin, J., Yang, H., & Gao, C. (2011). Application of the entropy weight and TOPSIS method in safety evaluation of coal mines. Procedia Engineering, 26, 2085-2091. 33. Madić, M., Marković, D., Petrović, G., & Radovanović, M. (2014).
Application of COPRAS method for supplier selection. In The Fifth International Conference Transport and Logistics-TIL 2014, Proceedings (pp. 47-50).
34. Madlener, R., Antunes, C. H., & Dias, L. C. (2009). Assessing the performance of biogas plants with multi-criteria and data envelopment analysis. European Journal of Operational Research, 197(3), 1084-1094.
International Journal of Innovative Technology and Exploring Engineering (IJITEE) ISSN: 2278-3075, Volume-8 Issue-10, August 2019
36. Mansouri, A., Naser, E., & Ramazani, M. (2014). Ranking of companies based on TOPSIS-DEA approach methods (case study of cement industry in Tehran stock exchange). Pakistan Journal of Statistics and Operation Research, 10(2).
37. Markowitz, H. (1952). Portfolio selection. The journal of finance, 7(1), 77-91.
38. Morey, M. R., & Morey, R. C. (1999). Mutual fund performance appraisals: a multi-horizon perspective with endogenous benchmarking. Omega, 27(2), 241-258.
39. Ogryczak, W. (2000). Multiple criteria linear programming model for portfolio selection. Annals of Operations Research, 97(1-4), 143-162. 40. Poklepović, T., & Babić, Z. (2014). Stock selection using a hybrid
MCDM approach. Croatian Operational Research Review, 5(2), 273-290.
41. Qu, S., Li, H., & Guo, X. (2011). Application Of Interval-Promethee Method For Decision Making In Investing. ORSC & APORC, 314-321.
42. Rajan, R. G., & Zingales, L. (1995). What do we know about capital structure? Some evidence from international data. The journal of Finance, 50(5), 1421-1460.
43. Rubinstein, M. (2002). Markowitz's “Portfolio Selection”: A Fifty‐Year Retrospective. The Journal of finance, 57(3), 1041-1045. 44. Samuelson, P. A. (1975). The fundamental approximation theorem of
portfolio analysis in terms of means, variances and higher moments. In Stochastic Optimization Models in Finance(pp. 215-220). Academic Press.
45. Shannon, C. E. (1948). A mathematical theory of communication. Bell system technical journal, 27(3), 379-423.
46. Shen, K. Y., Yan, M. R., & Tzeng, G. H. (2014). Combining VIKOR-DANP model for glamor stock selection and stock performance improvement. Knowledge-Based Systems, 58, 86-97.
47. Steinbach, M. C. (2001). Markowitz revisited: Mean-variance models in financial portfolio analysis. SIAM review, 43(1), 31-85.
48. Stone, B. K. (1973). A linear programming formulation of the general portfolio selection problem. Journal of Financial and Quantitative Analysis, 8(4), 621-636.
49. Tiryaki, F., & Ahlatcioglu, B. (2009). Fuzzy portfolio selection using fuzzy analytic hierarchy process. Information Sciences, 179(1-2), 53-69.
50. Tsao, C. T. (2003). Evaluating investment values of stocks using a fuzzy TOPSIS approach. Journal of Information and Optimization Sciences, 24(2), 373-396.
51. Ustinovichius, L., Zavadkas, E. K., & Podvezko, V. (2007). Application of a quantitative multiple criteria decision making (MCDM-1) approach to the analysis of investments in construction. Control and cybernetics, 36(1), 251.
52. Vilutienė, T., & Zavadskas, E. K. (2003). The application of multi-criteria analysis to decision support for the facility management of a residential district. Journal of Civil Engineering and Management, 9(4), 241-252.
53. Viteikiene, M., & Zavadskas, E. K. (2007). Evaluating the sustainability of Vilnius city residential areas. Journal of civil engineering and management, 13(2), 149-155.
54. Xidonas, P., Askounis, D., & Psarras, J. (2009). Common stock portfolio selection: a multiple criteria decision making methodology and an application to the Athens Stock Exchange. Operational Research, 9(1), 55.
55. Zavadskas, E. K., Kaklauskas, A., & Sarka, V. (1994). The new method of multicriteria complex proportional assessment of projects. Technological and economic development of economy, 1(3), 131-139.
56. Zavadskas, E. K., Kaklauskas, A., Turskis, Z., & Tamošaitienė, J. (2009). Multi-attribute decision-making model by applying grey numbers. Informatica, 20(2), 305-320.
57. Zavadskas, E. K., Kaklauskas, A., & Kvederytė, N. (2001). Multivariant design and multiple criteria analysis of a building life cycle. Informatica, 12(1), 169-188.
58. Zavadskas, E. K., Kaklauskas, A., Banaitis, A., & Kvederyte, N. (2004). Housing credit access model: The case for Lithuania. European Journal of Operational Research, 155(2), 335-352.
59. Zavadskas, E. K., & Turskis, Z. (2008). A new logarithmic normalization method in games theory. Informatica, 19(2), 303-314. 60. Zavadskas, E. K., Kaklauskas, A., Turskis, Z., & Tamošaitiene, J.
(2008). Selection of the effective dwelling house walls by applying attributes values determined at intervals. Journal of civil engineering
and management, 14(2), 85-93. Zohdi, M., Marjani, A. B., Najafabadi, A. M., Alvani, J., & Dalv, M. R. (2012). Data envelopment analysis (DEA) based performance evaluation system for investment companies: Case study of Tehran Stock Exchange. African Journal of Business Management, 6(16), 5573-5577.
AUTHORS PROFILE
Sayan Gupta*, B Tech in
Computer Science from Dr. B.C.Roy Engineering College and M Tech in Operations Research from NIT Durgapur and presently
a research scholar of National Institute of Technology, Department of Management studies, Durgapur, India. He has published and presented research articles in national and international journals and conferences of repute both in India and abroad. He can be reached at sg.
Dr. Gautam Bandyopadhyay is
an Associate Professor of National Institute of Technology, Department of Management studies, Durgapur, India. He is also the President of Operation Research Society of India (ORSI) Durgapur chapter. He has successfully guided several Ph.D scholars.
He has published and presented many research articles in national and international journals, conferences and book chapter of repute both in India and abroad. He is a notable academician acclaimed in India and abroad. He has several publications to his credit. He can be reached at [email protected]: [email protected]
Malay Bhattacharjee, is
presently a research scholar of National Institute of Technology, Department of Management
studies, Durgapur, India. At the same time, he is an Assistant Professor of Marketing at Bengal Institute of Business Studies, Kolkata, India. He has published and presented research articles in national and international journals, book chapter and conferences of repute both in India and abroad. He can be reached at [email protected] ;
Sanjib Biswas is presently serving as an Assistant Professor (Area: Decision Sciences, Operations Management and Information Systems) at