International Journal of Innovative Technology and Exploring Engineering (IJITEE) ISSN: 2278-3075, Volume-9 Issue-1, November 2019
Abstract: The two primary objectives of image authentication are Discrimination and Robustness. The SHA-1 algorithm, invariant vector distance and ring division are implemented to authenticate the image by using hash value to enhance discriminative capability and rotation robustness. The statistical features like central moments of the picture which contains rings in homogenous CIE L*a*b* model are unwavering because the image rotation is not linked to the ring division. Specifically, the digital operations of an image are not changed with respect to Euclidean distance and feature vectors. This makes message digest discriminative and dense. Several tests conducted with more than 200 color images and reveals that for common image digital operations this algorithm for image authentication is strong to estimate the efficiency. Among all the existing hashing algorithms, the projected technique for image authentication is demonstrated as superior.
Keywords: CIE L*a*b* mode Image authentication ring partition.
I. INTRODUCTION
Authentication of message is a process to check that messages received have originated from the known source and had not modified. It as well verifies the timeliness and sequencing. One of the authentication techniques is the digital signature. It provides also the measures to overcome the source renunciation. There are two levels in any digital signature and message authentication mechanisms. At the first level, an authenticator is used to authenticate a message. The authenticator is produced by some function. In the second level, this authenticator is used as primal to authenticate the message, by the receiver. The authenticator can be created by three types of functions. They are, Hash Function, Message Encryption and MAC (Message Authentication Code). A Hash Function takes an arbitrary size message and gives a fixed size message. The hash digest is nothing but the value returned by a hash function. Such hash value, shall serve as the authenticator. A hash function input is any size message ‘S’ and the output is a fixed size output, which is known as hash code/value ‘H(S)’. The hash function shall not use any key to produce the hash digest, unlike MAC. A hash function produces a big avalanche effect because if you change a bit in the input then it will produce a different hash value.
Revised Manuscript Received on November 05, 2019.
* Correspondence Author
A.A.NARASIMHAM, Assistant Professor, Department of CSE, Raghu Engineering College, Visakhapatnam, India.
Email: [email protected]
[image:1.595.309.531.165.255.2]Prof. P.S. Avadhani, Department of CS&SE, Andhra University, Visakhapatnam,India. Email: [email protected]
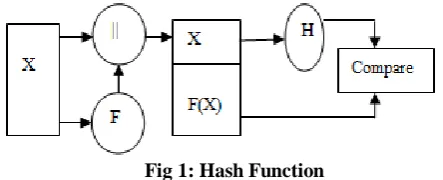
Fig 1: Hash Function
Diagram of Authentication processes: HASH (X-Plaintext, F- Hash Function, F(X)-Hash Value, ||-Concatenation) The‘d’ represents message digest which calculated by F(X), here X is message which can have any length and F(X) is the constant size message digest. At the source the hash value is concatenated to the message. The message digest was calculated by using the same hash function and the received message digest by the receiver at the destination(F). If the received and calculated hash values are same then the message was authenticated else not.
However, some image processing operations can tolerate any compression, geometrical transformations in selective authentication [1,2]. Techniques such as image content signatures or semi-fragile watermarking cater robustness to some extent against desired and specific manipulations. Strict image authentication treats an image as lacking credibility, when only an image pixel or single piece of information is altered. Such a service is necessary in certain applications. Be that as it may, this isn't the ideal validation technique for most cases [3]. Image hashing needs the following fundamental properties to be fulfilled: perceptual toughness and discriminative potential (anti-collision capacity) [4], [5]. Perceptual toughness implies that visually similar images had equivalent (fundamentally the same as) hash regardless of what their advanced portrayals are. At the end of the day, image hashing must be powerful beside generally utilized digital operations to images. Discriminative ability represents those distinctive images which have diverse image hashes. This shows hash distance between various images ought to be sufficiently vast. Absolutely, image hashing could have different properties for handling explicit applications. For instance, it ought to be key reliant and sensitive to visual content alterations when it is connected to image authentication.[6], [7]. The existing image hashing algorithms still have a few obstructions in them. For instance, numerous calculations are fragile to rotation, for example, [4] and [8]– [10]. A few algorithms are strong to turn, yet their discriminations are not acceptable, for example,[11]– [14]. Producing a image hashing at a decent dimension of both discrimination and rotation power is practically possible. In similar manner, we structure a image hashing dependent on invariant vector distance and ring partition which is with great rotation robustness and attractive discriminative
capacity.
Authentication of an Image with Sha-1 and
Invariant Vector Distances
The main contributions are as follows:
(1) Perceptual statistical capabilities are gathered from image rings in CIE L*a*b*coloration space. Since picture elements of images of every ring are nearly the similar later the rotation [15], the ring primarily depend on statistical functions. (2) Feature vectors are taken as points in a excessive dimensional space, and the distance of Euclidean among function vectors is subjugated to symbolize the original features. This approach is based on the reason that, the vector distance is invariant to commonly-used digital operations to image. This guarantees that our image features are efficiently zipped to make a dense and discriminative hash. Numerous experiments were conducted with many images to approve effectiveness of this calculation. This illustrate that this authentication technique is strong against
commonly-used advanced operations with great
discriminative ability. ROC (Receiver operating characteristics) curve comparisons outline that this authentication strategy shows prevalent perceptual strength and discriminative ability over a few present well known calculations.
The remaining of this paper is structured as: Segment 2 briefs the correlated effort. Segment 3 explains the proposed image authentication with SHA-1. Segment 4 presents investigational outcomes and comparisons of performance. Finally the work is fulfilled in Segment 5.
II. CORRELATEDEFFORT
Fridrich and Goljan [8] located that DCT coefficients can specify image substance material and proposed a strong hashing technique based in this observation for utility in virtual watermarking. Venkatesan et al. [4] used records of wavelet coefficients to construct image hash. This method is flexible to JPEG density, median filtering and rotation within 2°, but brittle to gamma correction and assessment alteration. Lin and Chang [9] designed an image authentication gadget with strong hashing, based on invariant members of the family among DCT coefficients at the identical role in detach blocks. RT (Radon Transform) [15], [12], [16],[17],[18] is obtained numerous attentions because of geometric transforms. For instance, Lefebvre et al. [15] pioneered using RT to build strong hashes. Seo et al. [16] subjugated vehicle-correlation of every outcrop inside the RT area to devise image hashing. De Roover et al. [17] planned a system, known as RASH method. Ou and Rhee [12] carried out RT to enter image, arbitrarily determined on 40 projections to carry out 1-D DCT, and took the first coefficient of each projection to assemble hash. Wu et al. [18] subjugated RT combining with DWT and DFT to build up image hashing. DFT ( Discrete Fourier Transform) [19], function points [20], [21] and matrix factorization [7], [11], [22]are also used in image hashing. Swaminathan et al. [19] used the DFT coefficients to give image hashes. Monga and Evans [20] subjugated the quit-stopped wavelet rework to stumble on visually giant characteristic factors. To make a short hash, Monga et al. [21] planned a heuristic clustering algorithm with a polynomial time for characteristic factor density. Kozat et al. [11] viewed images and assaults as a series of linear operators, and anticipated to compute hashes the usage of SVDs (Singular Cost Decompositions). . Monga and Mihcak [22] were the primary of making use of nonnegative matrix factorization (NMF) to image hashing, and acquired an excessive performance algorithm.
III. PROPOSEDIMAGEAUTHENTICATIONWITH
SHA-1
Five Phases are required for hashing of an image. 1)To get stable features one has to generate a normalized image by preprocessing. 2) Different rings should be identified from the normalized image so that they didn’t altered by the rotation of the image. 3) Constant central movements are to be obtained by rings of the image. 4) The message digest of the image is calculated with the help of SHA-1 for each and every ring by calculating the invariant distances between them and feature vectors. 5). Calculating the Threshold value. These five phases are detailed as follows.
A. Digital Image Pre-processing
One can extract the features of an image from a normal image by using Gaussian Low Pass filtering, bi-linear interpolation and translation of color space. Firstly using bi-linear interpolation the input image has to be converted to N*N standard image to have same hash length for varied sizes of images and resistant to image resizing. Generating high resolution image from one or more low resolutions is known as interpolation. For image scaling the main technique is the interpolation. The method of the distance-weighted average of the four vicinity picture elements values to approximate a fresh picture element value is known as Bilinear Interpolation. In Bilinear Interpolation the color pixel values are interpolated by introducing a continuous transition into the output. To calculate the color pixel value between any two data points, Bilinear Interpolation utilizes 2X2 neighborhood data points.
After getting the resized images one has to apply Gaussian Low Pass Filter to reduce the noise, etc. To convert a normal image to blur image one has to use Gaussian Filter. Noise and detail are removed by Gaussian Filtering. Function of
Gaussian is 2
2 2 2
2
1
)
(
x
e
x
G
The two dimensional Gaussian function is used with images. The product of two One Dimensional functions is the two dimensional Gaussian function. It is given below:
2 2 2 2 2
2
1
)
,
(
y x
e
y
x
G
In above equation, the distribution’s standard deviation is denoted with σ. The distribution is assumed to have a mean of zero. Gaussian distribution is symmetric circulation. Subsequently, the unclear RGB color image is altered into the color space of CIE L*a*b*. No alteration is needed if the input image is a gray image. To describe color between programs or between people or between machines color spaces are useful. According to the Human Visual System (HVS), classifying a color is the mechanism defined by CIE(Commission International del’Eclairage, International Commission on Illumination) system. Any color can be specified using this system in terms of its CIE coordinates. The sensitivities of the three broad bands in the eye have been measured by the CIE has measured, by matching spectral colors to specific mixtures of
International Journal of Innovative Technology and Exploring Engineering (IJITEE) ISSN: 2278-3075, Volume-9 Issue-1, November 2019
color spaces. These are linear nearly with visual perception. These are independent of devices. A good correlation with perceived lightness is achieved with L parameter. CIE L*a*b* is directly derived from CIE XYZ. The color of the white point of the system is referred for the coloring information. Fig. 2 illustrates block diagram of color space conversion.
Fig. 2 : Color space translation
In exercise, Primarily, the RGB color space is translated into CIE XYZ color space by using bellow method:
B
G
R
z
y
x
9502
.
0
1192
.
0
0193
.
0
0722
.
0
7152
.
0
2127
.
0
1804
.
0
0.3576
0.4125
Where R,G,B are the red , green and blue components of a pixel, and X,Y and Z are CIE XYZ tristimulus values respectively. Then the CIE XYZ color space is converted into CIE L*a*b* color space by the below equations:
L* = 116*
f
(
Y/Yw
) − 16
a* = 500*[
f (X/X
w) − f (Y/Y
w)]
b* = 200*[
f
(
Y/Yw
) −
f
(
Z/Zw
)]
in which L* is color lightness, a* and b* are chromaticity coordinates, Xw=0.950456; yw =1.0 and zw = 1.088754 are the CIE XYZ tristimulus values of the reference white point and f(t) is calculated as
otherwise
t
t
if
t
t
f
116
/
16
787
.
7
008856
.
0
)
(
31
Here, for hash generation the L* component is considered. To generate hash value one has to consider L* component in CIE L*a*b* color space. The individual observation of lightness matches closely with L* component and it is perceptually uniform in the color space. The L* component features are more constant compared with Y component (luminance) and I component of YCbCr and HSI color spaces respectively.
B. Partition Of Image Into Rings
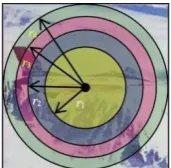
[image:3.595.384.470.49.133.2]In order to execute rotation tasks on any image, one has to take the center of the image as origin, i.e., the regions formed on a circle of an image does not change even after rotating the image. By using above property, image authentication be planned with respect to the revolution by extracting the stable statistical features from the image rings.
Fig. 3: Schematic partition with four rings
Figure 3 describes the partitions of an image with 4 rings. The image pixels (contents) of different rings do not change even after rotation. This can be proved by calculating the statistical features of rings by using the equations [15-18]. The normalized image can split into dissimilar rings and every image region likely to have same number of pixels. The partition of rings is carried out as follows: Let the pixel value of the Yrh row, and Xth column of the normalized image be where
1
x
N
,
1
y
N
. be the set of pixel values of the kth ring ( ), here n specifies the rings number in total.Let be the radius of k-th ring. The radius values are represented from lower value to higher value as shown in the figure. By calculating Euclidean distances from center of the image with different radii, the pixel values of each ring are classified into different sets.
The are as follows
Here, is the distance of Euclidean from to the
image center ( ). It is stated as,
Where, and if n is even
Otherwise, and
For radii
r
n
N
/
2
where
.
gives roundingdownward, where
r
1
is computed as.
Where is the mean area of every ring which is given as
A
n
A
0
/
in this, the area of the inscribed ring isA
.It is computed as
A
r
n2. Asr
1 andA
0are available. The radiir
k (k
2
,
3
,
4
...
n
1
) is computed as2 0 k 1
k
A r
r
C. Statistical Central Moment Features
During rotation the pixels of any image ring don’t alter. The statistical aspects which are calculated from each image ring ( ) are constant during rotation. The visual content of each image ring are computed by choosing four statistical features such as skewness, kurtosis, variance, and mean. These are defined as follows:
RGB Color space
CIE XYZ Color space
1
1
( )
k N k k i kC i
N
2 11
(
( )
)
1
k Nk k k
i k
C i
N
3 1 3 2 1 1 ( ( ) ) 1 ( ( ) ) k k N k k i k k N k k i k C i N C i N
3 1 2 2 1 1 ( ( ) ) 1 ( ( ) ) k k N k k i k k N k k i k C i N C i N
Where
N
k denotes pixels number ofC
k andC
k(
i
)
is the ith element ofC
k (1
i
N
k ). The reasons to choose the above four statistics as features of the image are given below:The mean
k values gives the average of individual pixel gray intensity values of a kth ring in an image and also represents average energy of the kth ring.The fluctuation of a pixel with its neighboring pixels of the ring is identified by the variance
k. It is used to classify the pixels into different image regions.The asymmetric pixels of each ring around the mean were measured by skewness k. The pixels of each ring are distributed more to the left of the mean value of ring Ck is known as negative skewness. If the pixels of each ring are distributed more to the right of the mean value of the ring
k
C is known as positive skewness.
The shape of the distributed pixels of each ring k
C
is represented by the Kurtosis
k
. The positive values of kurtosis represent a sharp peak around the mean and negative values of the kurtosis represents flat surface. These statistical features are represented as feature vector
v
k of each kth ring.
, , ,
Tk k k k k
v
These ring vectors are arranged in 4Xn size to form a feature matrix V, i.e.,
D. Applying SHA-1 By Using Invariant Distances
In a four dimensional space, a point is nothing but a ring vector. The observations revealed the fact that small disturbance of point and minimum effect on vector distances by regularly used digital operations. Thus, it implies that distance vector is stable to normally-used image operations. Such a perception helps us to design a scheme for efficient method by considering distance vector. To calculate distance vector, first normalization of data should be conducted. Let,
P
i
p
i(1),
p
i(2),
p
i(3),... ( )
p n
i
be the ith rowof
V
(1
i
4)
. It is converted tos
iass j
i( )
=p j
i( )
– mi / i
wherep j
i( )
, ands j
i( )
are j thelements of
p
iands
i.
iand mi are the standard deviation and mean of
p
i respectively. The normalization matrix Q is available by performing the above operation.A reference vector represented by
ref , where(1),
(2),
(3),
(4)
ref ref ref ref ref
, and it isengender for distance calculation, where
ref( )
j
(1
j
4)
, and it is represented as1
1
( )
n ref i ij
n
Where is the jth element of the ith column of
(1
4)
Q
j
The Euclidean distance is calculated between and , it is represented as and given as
4 2
1
( ) i( ) ref( )
j
l i j j
By converting each decimal value into an integer, the memory size of each of them can be reduced by using below equation
z i
( )
l i
( ) *100
0.5
where [.] is a function used to convert the floating value into integer value. Then, the z(i) values are re-arranged randomly to achieve key-dependent hash. For this, n pseudo-random numbers are generated by using a secret key as the seed. The z(i) values are sorted and the positions of the sorted numbers are stored in the array G. Then the every rearranged element is retrieved as
md i
( )
z G i
( ( ))
, here
G i
[ ]
represents ith array value ofG(1 j4).Now each md(i) values are applied to SHA-1 algorithm, i.e., for each and every ring the value of md is applied to SHA-1 algorithm. Then the result is n (the number of rings) message digest values. The output of SHA-1 is 160 bit message digest. Therefore there are total 20 hexadecimal values are available for the 160 bits output. For the n rings all these corresponding hexadecimal values are added so that one can get final message digest of 160bits or 20 hexadecimal hash value. The message authentication value is represented as S:
(1),
(2),
(3),...
( )
MD
md
md
md
md n
E. Calculation of Threshold
Lnorm is used as a metric to assess the distance of two hash values. Let and represents the massage digest of two images.. The Lnorm calculated by
2 1 2 1 ( ) ( ) n norm i
L md i md i
here
md
1(i ) andmd
2(i ) represents ith values ofMD
1 &2
MD
. If the Lnorm is greater than the value of the assumed threshold then the images are treated as different, otherwise they are treated as same.IV. INVESTIGATIONALOUTCOMES
To authenticate the productivity of this Image Hashing several experiments are conducted. The constraints are a) 512 * 512 is the normalized size of the image, b) number of partition are 40, c) 3*3 convolution mask. The Section 4.1 presents the validation of the robustness of Berkeley images. The Section 4.2 presents the analysis of the discriminative ability of the images. Section 4.3 summarizes the importance of the dependence of the key and sensitivity of the visual content changes. Finally the section 4.4 describes the efficiency of hash which depends on the number of partition rings.
International Journal of Innovative Technology and Exploring Engineering (IJITEE) ISSN: 2278-3075, Volume-9 Issue-1, November 2019
First, six images are selected as test images. The sizes of the images are 512*512. The images are Rose Flower, Ship, White Pelican, House, Cup, Shop as shown in below figure.
(a1) (a2) (a3)
(a4) (a5) (a6)
Fig.4: (a1). Rose Flower, (a2). Ship , (a3). White Pelican, (a4). House, (a5). Cup, (a6). Shop
[image:5.595.50.287.96.275.2]The popular tools, i.e., MATLAB and Imageshop are used to produce visually similar images after the various attacks. The above mentioned digital operations are performed on the above images. After the rotation, the size of the attacked image is increased by adding pixels with zero values. So for hash calculation only the center parts of the images are considered. Total 74 different attacks were conducted for each operation by considering various parameters. The various parameters information tabulated in table 1. The image which is taken for testing has 74 comparable images which includes 16 rotated attacked images and 58 are other attacked images. Here we have taken 6 different test images, and each image has 74 comparable images and total comparable images are 6*74=444.
Table 1: Attacks with Different Parameter
Attack Values No
Adjustment in
Brightness -30,-20,-10,+10,+20,+30 6 Adjustment in
Contrast -30,-20,-10,+10,+20,+30 6 Correction in
Gamma
.75, .9, 1.1, 1.25, 1.5, 1.75, 2.0,
2.25 8
3*3 Gaussian
Low-Pass .2, .3, .4, .5, .6, .7, .8, .9, 1.0, 1.1 10
Noise of Salt and Pepper
10-3,2* 10-3,3* 10-3,4* 10-3,5* 10-3,6* 10-3, 7*10-3,8* 10-3,9* 10-3, 10-2
10
Multiplicative Noise
10-3,2* 10-3,3* 10-3,4* 10-3,5* 10-3,6* 10-3, 7*10-3,8* 10-3,9* 10-3, 10-2
10
Scaling
0.5. 0.75, 0.9, 1.1, 1.5, 2.0, 2.25,
2.5 8
Rotation
-90,-45,-30,-15,-10,-5,-2, -1,
+1,+2,+5,+10,+15,+30,+45,+90 16
Total number of images are 74 and the softwares used are imageshop and matlab. Here low pass filters describes the standard deviation, salt and pepper describes the density, multiplicative noise describes the variance, scaling describes the ratio, rotation relates the angle of rotation
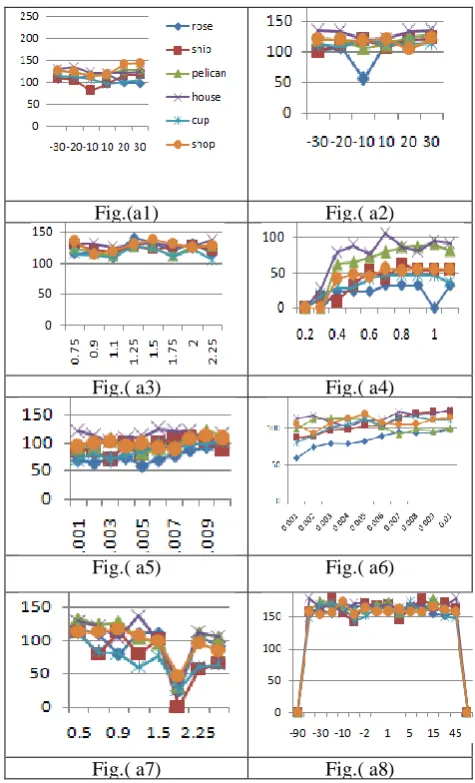
The original and the attacked image’s hashes of are recalculated after which Lnorm is used to estimate the distance. The readings are shown in the figure. 5. Here, the parametric values taken on the x-axis and Lnorm values on y-axis. From
below figures. 5 (a1)~(a7), it identified that the Lnorm values less than or equal to 140, apart from three readings i.e.,142.12 , 143.56 in Fig. 5 (a1), and 141.785 in Fig. 5 (a3). It concludes that for various attacks on images except rotation the threshold value T=140 is suitable.
With this threshold, (58×6−3)/(58×6)×100%= 99.14% pairs are exactly identified. The Lnorm of rotated image is depicted in figure. 5 (a8). Here, the Lnorm values are above the threshold value 140. While rotating the images, some of the pixels are moving out of the square block and these pixels are padded with zeros. This results in interpolation errors creep up in rotation operation. While rotating the image the number of pixels are increased, which results in the higher threshold values. In view of this, we are considering the 361x361 center part of the image for calculating the threshold value. However, average threshold value of the rotated images is 160.352. For some images Lnorm values are near to 170. So, Threshold value T=170 is considered for rotated images. Here one image threshold value is out of range.
Fig.(a1) Fig.( a2)
Fig.( a3) Fig.( a4)
Fig.( a5) Fig.( a6)
Fig.( a7) Fig.( a8)
Fig. 5. The performances of images under various attacks . (a1) Adjustment in Brightness. (a2) Adjustment
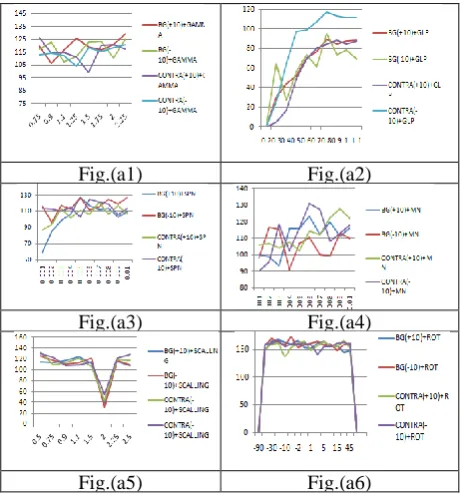
[image:5.595.307.545.277.669.2] [image:5.595.53.279.455.667.2]The performance of the images are calculated under combination of different attacks such as brightness + gamma correction, brightness + 3×3 Gaussian low-pass , brightness + noise of salt and pepper, multiplicative noise + brightness, brightness + scaling, and brightness + rotation. Similarly, contrast + gamma correction, contrast + 3×3 Gaussian low-pass, contrast + noise of salt and pepper, contrast + multiplicative noise, scaling +contrast, and rotation + contrast. These tests confirmed that this authentication technique is vigorous of the combination of different attacks. Fig. 6 (a1) represents input image, Fig. 6 (a2) same image with brightness increased by 10,Fig. 6(a3) same image with brightness decreased by 10, Fig. 6(a4) same image with contrast increased by 10 and Fig. 6(a5) same image with contrast decreased by 10.
Fig.(a1) Fig.(a2) Fig.(a3)
Fig.(a4) Fig.(a5)
Fig.6: a1).Input Image, a2).Brightness increased by 10, a3).Brightness decreased by 10, a4).Contrast increased
by 10, a5).Contrast decreased by 10
Results depicted in figure 7, here manipulation of the parametric value taken on the x-axis and the Lnorm taken on y-axis. The Lnorm values are less than 140 for normal attacks and for rotation attacks below 150, This value is very less compared with threshold value T=170. This means that this authentication technique is strong against the combination of different attacks.
Fig.(a1) Fig.(a2)
Fig.(a3) Fig.(a4)
Fig.(a5) Fig.(a6)
Fig 7. The performance of an image with various operations. (a1) Gamma Correction. (a2) Gaussian
low-pass (a3) Noise of Salt and pepper (a4) Multiplicative noise. (a5) Scaling. (a6) Rotation. B. Discriminative Capability
Hundred images with different sizes were taken from Berkeley Image dataset to check the discriminative ability of this authentication technique. This technique extracted hashes for these images and then the Lnorm values of each pair of hashes was computed. Finally 100×(100−1)/2=4,950 results were collected. The least and highest Lnorm s are 254.34and 789.43 are noted from these results. Obviously, these values are much greater than our assumed threshold value T=140 or T=170. It demonstrates that this authentication technique exhibits excellent intolerance.
C. Sensitivity to Visual Content Changes
The meaning of tampered image is distinct from the original image, that is, the tampered and the original images are dissimilar. The good hashing algorithms detects the tampered images [24], [7],[9], [19], [26], [33], which are generated by changing the contents of the images. The malicious tampered images are easily identified by image authentication techniques. The changes in the original images are done by the Imageshop, which alters the visual objects by adding and removing the group of pixels. The image hashing values are calculated for both original and tempered images. It is noticed that the tampered images are recognized properly by our authentication technique. Six examples are illustrated. In Figure 7, (a1), (a2), (a3), (a4), (a5), and (a6) are original images, and (a1t), (a2t), (a3t), (a4t), (a5t), and (a6t) are their tampered versions, respectively.
This hashing technique was applied on above pictures and noticed that the hash values are greater than 250. (The results are shown below Table 2). Efficiency of Hash based on Number of Rings
(a1) (a2) (a3)
(a4) (a5) (a6)
(a1t) (a2t) (a3t)
(a4t) (a5t) (a6t)
[image:6.595.54.284.232.405.2] [image:6.595.308.549.449.831.2] [image:6.595.51.285.517.764.2]International Journal of Innovative Technology and Exploring Engineering (IJITEE) ISSN: 2278-3075, Volume-9 Issue-1, November 2019 Table 2: Lnorm of Original and Tampered Images
Sl.N o
Image Hash
Value Difference
1 Image One (Rose Flower) 267.8983
2 Image Two (Ship) 282.0114
3 Image Three (White Pelican) 256.5082
4 Image Four (House) 267.6393
5 Image Five (Cup) 261.1441
6 Image Six (SHOP) 267.4308
D. Efficiency of Hash based on Number of Rings
The ROC (Receiver Operating Characteristics) [34] graph is used to check the performance of this authentication technique by considering the various ring numbers. The TPR (True Positive Rate) and FPR (False Positive Rate) were computed as:
TPR = TP/(TP + FN) FPR = FP/(TN + FP)
The amount of interpretations of correctly identified as positives from all positive readings is the TPR, and the amount of interpretations of wrongly indentified as positives from all negative readings is the FPR. The performance of guessing the positives from the actual positives is described by TPR. The TPR is also referred to as sensitivity. Identifying a positive class from the actual negatives is known as FPR. The specificity is calculated as
Specificity = True Negatives number / (False Negatives + True Negatives)
Therefore, The FPR = 1 – Specificity.
So, the toughness and bias are indicated by TPR and FPR.
In ROC graph, FPR is taken on X-axis and TPR is on Y-axis, by using the (FPR, TPR) points the ROC is curve is developed. In the experiments, all images were normalized to 512×512, and the convolution mask was 3×3. Here, five ring numbers were used, i.e., n=30, n=40, n=50, n=60 and
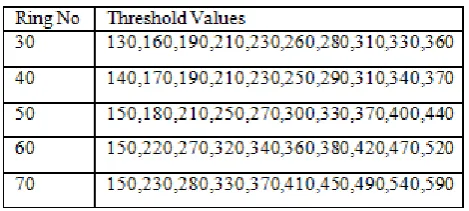
[image:7.595.310.545.132.308.2]n=70. The test images are taken from Berkeley Image Dataset and they are, i.e.,(6+44)×74=3700 pairs of like images for toughness justification and 100×(100−1)/2=4950 pairs of dissimilar images for bias test. For every ring number, we subjugated this authenticated technique to dig out hashes, computed the hash distances, used various thresholds to determine their TPRs and FPRs, and then obtained the ROC curves. The following Table 3 lists the thresholds of various ring numbers.
Table 3: Threshold Values of Various Ring Numbers
The figure 8 shows the comparisons of the ROC curve with various ring numbers. All ROC curves are nearer to the left-top corner. This indicates that our authentication technique has acceptable categorization performance for toughness and bias. It identified as the ROC curve of n=40 is
nearer to the left-top bend than those of other n values, that is, a small n value will harm bias and a large n value recover bias, but perceptual toughness somewhat reduce because of influences of content-preserving operations. So for images of 512×512 sizes, a reasonable ring number, e.g., n=40,is a fine option to keep a attractive tradeoff between toughness and bias.
Fig: 8 . ROC curves for different ring numbers
V. CONCLUSION
We have projected a vigorous image authentication method with ring division invariant vector distances and SHA-1. It achieves pretty discrimination with great rotation robustness. Since ring division is insignificant to image rotation, our ring-based statistical central moment features are constant and invariant. This stimulates that our authentication mechanisim can oppose image rotation with any angle. An essential commitment of our work is the perception that vector distances with statistical central moments is invariant to image transformations (rotation, scaling, etc.), which gives a good hash distinctions. This technique is used in many applications like recovery of duplicate images, an ordering of images, and identifying tampered images. Numerous investigations have been led for approving the effectiveness of our hashing. The outcomes have demonstrated that our hashing can oppose normally utilized advanced activities on images, including rotation with any angle, achieve attractive discriminative capacity and be touchy to image substance transforms. We authenticated an image by using invariant vectors, ring partition and applying SHA-1 algorithm for every ring partition to calculate the hash values and threshold value. With ROC curves we demonstrated the performance of this technique with different ring numbers.
REFERENCES
1. Mintzer F, Braudaway G, Yeung M (1998) Effective and ineffective digital watermarks. In:Proceedings of the ICIP’97, Santa Barbara, CA, USA
2. Yeung MM (1998) Digital watermarking introduction. Commun ACM 41(7):31–33.
3. Memon N, Poorvi V, Boon-Lock Y, Yeung M (2000) Distortion bounded authentication techniques In: Proceedings of the SPIE international conference on security and watermarking of multimedia contents II, vol 3971, pp 164–174
[image:7.595.50.285.616.721.2]5. Z. Tang, X. Zhang, and S. Zhang, “Robust perceptual image hashing based on ring partition and NMF,” IEEE Trans. Knowl. Data Eng., vol. 26, no. 3, pp. 711–724, Mar. 2014.
6. F. Ahmed, M. Y. Siyal, and V. U. Abbas, “A secure and robust hash based scheme for image authentication,” Signal Process., vol. 90, no. 5, pp. 1456–1470, 2010.
7. Z. Tang, S. Wang, X. Zhang, W. Wei, and S. Su, “Robust image hashing for tamper detection using non-negative matrix factorization,”
J. Ubiquitous Converg. Technol., vol. 2, no. 1, pp. 18–26, 2008. 8. J. Fridrich and M. Goljan, “Robust hash functions for digital
watermarking,” in Proc. IEEE Int. Conf. Inf. Technol., Coding Comput., Mar. 2000, pp. 178–183.
9. C.-Y. Lin and S.-F. Chang, “A robust image authentication method distinguishing JPEG compression from malicious manipulation,” IEEE Trans. Circuits Syst. Video Technol., vol. 11, no. 2, pp. 153–168, Feb. 2001.
10. Z. Tang, S. Wang, X. Zhang, W. Wei, and Y. Zhao, “Lexicographical framework for image hashing with implementation based on DCT and NMF,” Multimedia Tools Appl., vol. 52, nos. 2–3, pp. 325– 345, 2011.
11. S. S. Kozat, R. Venkatesan, and M. K. Mihcak, “Robust perceptual image hashing via matrix invariants,” in Proc. IEEE Int. Conf. Image Process., Oct. 2004, pp. 3443–3446.
12. F. Lefebvre,B. Macq, and J.-D. Legat, “RASH: Radon soft hash algorithm,” in Proc. 11th Eur. Signal Process. Conf., Sep. 2002, pp. 299–302.Y. Ou and K. H. Rhee, “A key-dependent secure image hashing scheme by using Radon transform,” in Proc. IEEE Int. Symp. Intell. Signal Process. Commun. Syst., jan. 2009, pp. 595–598. 13. Y. Li, Z. Lu, C. Zhu, and X. Niu, “Robust image hashing based on
random Gabor filtering and dithered lattice vector quantization,” IEEE Trans. Image Process., vol. 21, no. 4, pp. 1963–1980, Apr. 2012.
14. Z. Tang, X. Zhang, L. Huang, and Y. Dai, “Robust image hashing using ring-based entropies,” Signal Process., vol. 93, no. 7, pp. 2061–2069, 2013.
15. F.Lefebvre, B. Macq, and J.-D. Legat, “RASH: Radon soft hash algorithm,” in Proc. 11th Eur. Signal Process. Conf., Sep. 2002, pp. 299–302.
16. J. S. Seo, J. Haitsma, T. Kalker, and C. D. Yoo, “A robust image fingerprinting system using the Radon transform,” Signal Process.,Image Commun., vol. 19, no. 4, pp. 325–339, 2004. 17. C. De Roover, C. De Vleeschouwer, F. Lefebvre, and B. Macq,
“Robust video hashing based on radial projections of key frames,”
IEEE Trans.Signal Process., vol. 53, no. 10, pp. 4020–4037, Oct. 2005. 18. D. Wu, X. Zhou, and X. Niu, “A novel image hash algorithm resistant to print–scan,” Signal Process., vol. 89, no. 12, pp. 2415–2424, 2009. 19. Swaminathan, Y. Mao, and M. Wu, “Robust and secure image
hashing,” IEEE Trans. Inf. Forensics Security, vol. 1, no. 2, pp. 215–230, Jun. 2006.
20. V. Monga and B. L. Evans, “Perceptual image hashing via feature points: Performance evaluation and tradeoffs,” IEEE Trans. Image Process., vol. 15, no. 11, pp. 3452–3465, Nov. 2006.
21. V. Monga, A. Banerjee, and B. L. Evans, “A clustering based approach to perceptual image hashing,” IEEE Trans. Inf. Forensics Security, vol. 1, no. 1, pp. 68–79, Mar. 2006.
22. V. Monga and M. K. Mihçak, “Robust and secure image hashing via non-negative matrix factorizations,” IEEE Trans. Inf. Forensics Security, vol. 2, no. 3, pp. 376–390, Sep. 2007.
AUTHORSPROFILE
A.A.NARASIMHAM, M.Sc (Physics), MCA, M.Tech (CST). He is Working as ,Assistant Professor in the department of CSE, Raghu Engineering College, Visakhapatnam. He attended several international conferences. He is a life member in CSI and IEI.
Prof .P.S.Avadhani,,working in department of CS & SE, Andhra University. He awarded Ph.D from IIT Kanpur. He worked as Head of the department, Vice Principal, and Principal of college of engineering, Andhra University. He guided 16 Ph.D students and published several papers in international reputed journals.