The efficiency of a supply chain with the use of
maritime transport on the example of the
apparel industry
Dariusz Milewski1,*, Beata Milewska2
1University in Szczecin, Faculty of Management and Economics of Services, Cukrowa 8, 71-004 Szczecin
2WSB University in Poznań, Faculty of Finance and Banking
Abstract. The paper presents the problem of the impact of the competitiveness of maritime transport on the efficiency of global supply chains on the example of the apparel industry. With the use of a model developed by the authors, simulations of the profitability of the sourcing in low-costs countries (Bangladesh, China) have been conducted. The model takes into account the specificity of the apparel industry, parameters of cargo, value of goods, and demand characteristics. If freight rates for maritime transport services were to increase significantly, the profitability of production in the Far East compared to local or regional production would be lower particularly for cheaper products. The level of these freight rates is not the main factor of the efficiency of this strategy. Simulations revealed, that changes of costs of production has greater impact on this profitability. In the garment market the possibility of quick response to demand is often more important than costs. The calculations were made on the basis of data obtained from Polish companies, which order production in countries with low production costs and transport garment in containers by sea and from transport and logistics operators.
Introduction
Global supply chains are characterized by geographic dispersal of individual chain links, because producers, their suppliers, sub-suppliers, distributors, and agents are located in various countries and in different parts of the world. There may be various reasons for that, for example, the lack of specific goods in a given country or the higher quality of goods bought abroad. Often, however, the main reason is lower production costs in the so-called low-cost country sourcing (LCCS), e.g. in South-East Asia or South America.
However, when making decisions concerning production or buying in low-cost countries, the trade-off mechanism should be taken into account. On the one hand, thanks to the supply and production in the LCCS countries, production or purchase costs are reduced. On the other hand, the logistics costs can be increased. These costs are: transport costs, the cost of maintaining stocks, costs associated with lower quality of goods, eg with
*Corresponding author: [email protected]
deterioration of quality during transport, costs of duties, costs associated with monitoring suppliers and maintaining representative offices, lost sales resulting from the lack of quick response to a demand. Apart from this also other factors should be taken into consideration as the risk of the change of conditions of making business e.g.: increase of labor costs in the LCCS countries and freigth rates in maritime transport (Milewska, 2016, Milewska, Milewski, 2017). Strategy of outsourcing of production to low‐cost countries is based on the assumption of low costs production and transport. This strategy is linked with increased lead‐times not only because of longer distances but also because of the use of the maritime transport.
The goal of the paper is to present the economic efficiency of global supply chains using maritime transport on the example on the apparel industry. This efficiency has been assessed with the use of a model developed by the authors. The model allows for conducting simulations of the impact of changes of the costs of maritime transport on the profitability of the sourcing in low-costs countries (Bangladesh, China). It allows also to show the impact of the increase of production costs in the LCCS countries on the use of maritime transport. The model takes into account the specificity of the apparel industry, parameters of cargo, value of goods, and demand characteristics. Data for simulations have been collected from the transport and apparel market – among others from the biggest Polish apparel companies.
Literature review
Maritime transport has the biggest share in the global supply chains despite relatively longer time of delivery and bigger risks connected with use of it (unpredictable weather conditions, piracy attacks, terrorist hijacking, and cargo damages, bankruptcies, breakdowns, macroeconomic and political changes (Min, 2012, Manuj, Mentzer, 2008). Although the punctuality of the ocean transport has improved significantly in recent years, the use of maritime transport is linked with higher risks and longer time of reaction to changes of market demand in comparison to other modes of transport.
Containerisation is concidered a key factor of globalisation (Mangan, 2017). The maritime transport competes with other modes of transport with very low freight rates. According to Munim and Schramm (2017) global financial crisis in 2009 have affected the container shipping freight market towards heavily fluctuating freight rate movements. According to Drewry’s a maritime research and consulting firm, global freight rates were in the beginning of 2017 37% higher than in 2016 and were forecasted to rise by about 8% (Drewry, 2017).
China have been for many years the main source of supply in the global supply chains. Yet in recent years production in China is becoming less and less profitable because of Chinese currency appreciation, rising labour costs, higher oil prices and reduced value ‐added tax rebates (Huang, Zhang, Liu, 2013). In the clothing industry the result was the allocation of some part of the production from China to Bangladesh – in this country the biggest brands are present, also the biggest Polish clothing companies like LLP S.A. and Redan.
The sourcing strategies of companies and their supply chains are however diversified and depends largely on the specific of an industry. The study performed by PwC revealed that leaders of supply chains keep the focus on chains that are both fast and efficient (PwC, 2013).
Postle, 2006, Vedel, Ellegaard, 2013). According to Kumar and Samad (2007) outsourcing in this industry is not viable for meeting short term market demands but rather for large seasonal orders.
According to Christopher et. al commercial success or failure in fashion markets is largely determined by the organisation’s flexibility and responsiveness (Christopher, Lowson, Peck, 2004). Such views could have been found for years in the scientific literature but business practices seemed to deny it, because more important than flexibility were costs. It seems however, that presently the concept of quick response and agile supply chains begins to be realized.
The specificity of the clothing industry in Poland
Poles' spending on clothes is slowly but steadily growing, and therefore the turnover in the clothing industry is increasing. Data from the Central Statistical Office shows that only in the first ten months of the 2017 the sales of textiles, clothing and footwear increased by 17.5% year-on-year (GUS, 2018).
The industry is characterized by relatively high volatility and low predictability, especially when it comes to „must-have” products, that is, products of the latest fashion trends. Poles make purchases of clothing both in exclusive salons and in discount stores, and more and more often - via the Internet.
The largest Polish clothing companies, such as LPP S.A. (owner of brands: Reserved, Cropp, House, Mohito, Sinsay brands) and Redan Capital Group (brands: Top Secret, Troll and Drywash brands), as well as their foreign competitors operating in Poland (eg H & M or Grupa Inditex), do not have their own production plants. These companies deal with the design, distribution and sale of clothing through their own Logistics Centers and own stores. They outsource production mainly to countries with low production costs (Far East), from where products are transported mainly in containers by sea. These companies order most of their production in Southeast Asia. The production of less complicated products takes place in Bangladesh, where the costs are lower than in China, while the production of more complex products - in China, because for example Chinese sewing factories with which LPP S.A. cooperates, have a modern machine park.
Production of goods in the Far East is much cheaper than in Poland and even after considering the costs of transporting goods, customs duties, but also costs related to monitoring suppliers and maintaining a representative offices. Especially LPP S.A. bear large expenditure on the improvement of working conditions in Bangladesh after tragedy, which took place in Rana Plaza in 2013. Another factor that should also be taken into account are changes in exchange rates, because the costs of clothing production in Asia are settled in dollars, while revenues - in EUR and in Polish currency.
Model of economic efficiency of global and local supply chains
in the clothing industry
In order to study the possible impact of changes of freight rates in maritime transport and production costs in the Far East on the efficiency of global supply chains - a computer model has been developed by the authors. With the use of this model simulations have been conducted for global and local supply chains in the clothing industry.
General data used in the model are based on financial statements of Polish companies from the garment industry listed on the Warsaw Stock Exchange (table 1). Net operational margins are different – from very low (0,8%) to high, but half of these companies has margin up to 4%. In the case of these companies changes of costs can have significant impact on profits.
Usually costs of production or purchasing in these companies stand for 40 – 50% of sales. The distribution of goods – marketing, sales, physical distribution and logistics costs, which are also on the level of 40 – 50% of sales.
The interesting information can be found in the financial statements of the biggest player on the Polish market – LPP S.A. Since 2013 sales have been growing by 15% - 17% each year. Despite this the net operational margins were falling: from 15% in 2013 to 3,8% in 2016 (in 2017 rose but still was lower than in 2015). What’s more the share of the costs distribution and overall costs didn’t change much, but the share of costs of purchasing of goods increased from 41,5% in 2013 to 51,3% in 2016. That means that costs of production and purchasing of goods from the suppliers are growing.
[image:4.482.82.411.394.625.2]Presently the company sells 140 mln items a year. The clothes produced at the request of LPP in low-cost countries are transported by sea in 40' containers to the port of Gdansk.
Table 1 Financial results of listed companies in the clothing industry in 2016 [thous. PLN]
The company's name Sales revenues Own cost of
sale Own cost of sale/ Sales revenues
Net margin
PRÓCHNIK S.A. 56 269 24 842 44,1% 0,8%
ESOTIQ &
HENDERSON S.A. 124 224 49 869 40,1% 4,0%
Primamoda 35 838 26 343 73,5% 24,9%
Redan 628 487 0,0% 2,0%
Bytom S.A. 152 911 74 453 48,7% 8,3%
Gino Rossi 284 748 149 334 52,4% 4,5%
TXM SA 377 695 219 661 58,2% 4,3%
Silvano Group AS 57 892 0,0% 28,6%
CDRL S.A. 203 675 197 0,1% 9,2%
Monnari Trade SA 231 773 105 450 45,5% 9,3%
Vistula 598 602 286 660 47,9% 8,5%
LPP 6 019 046 3 085 236 51,3% 3,8%
The rest of data are collected from the transport and logistics market or estimated on the base of available data. For example, in the Asia-Northern Europe connections, the overall Shanghai Containerized Freight Index reached 714 USD / TEU at the end of September 2017 and freight rates on similar level has been assumed as a starting point in the simulations. Part of the data are in the table 2.
Table 2 Parameters of purchased goods
Retail price [PLN/pcs.] 50 100 400 Purchase price (global source)
[PLN/pcs.] 17,0 44,9 225,0 Purchase price (local source)
[PLN/pcs.] 32,3 75,4 348,5 Difference of purchase prices 90% 68% 55% No of products in a container
[pcs./container] 19 800 15 000 8 000 Source: own study based on market data
The calculations have been conducted for three hypothetical groups of clothes – of low, middle and high value (retail price). It was assumed, that margin of net operational profits in case of global deliveries is on the level of 8% (similar to the operational margin of LPP S.A. In 2017) and in the case of local production – 4%. Basing on this assumptions prices for product sourced globally and in Poland have been determined. It is interesting, that the differences between these prices decrease when the value of the commodity increases – for the cheapest goods (50 PLN/item), the purchase price in Poland resulting from simulation was 90% higher than in the low cost country. For the price of 100 PLN/item the difference was lower – 68%, and for the most expensive (400 PLN/item) – 55%. That could mean, that for more expensive garments the cost advantage of global suppliers is relatively lower and thus probably greater opportunity for domestic producers to compete with global suppliers is in case of more expensive products, more complex and of higher quality.
Next important assumption is that a local supplier can be more flexible than a global one. So in the model it was also taken into consideration, that in case when the demand is higher than it was forecasted, a global supply chain won’t be able to react quickly and the costs of the lost sales will rise. In case of lower demand inventories will be higher.
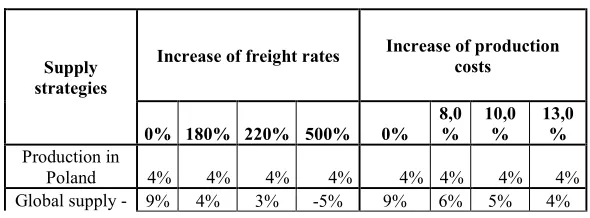
Simulations of the impact of changes of transport costs and changes production costs for three levels of prices of products have been conducted. The results are shown in table 3 and on graphs 1 and 2.
Table 3 Impact of changes of maritime freight rates and production costs on profitability of supply strategies
Supply strategies
Increase of freight rates Increase of production costs
0% 180% 220% 500% 0% 8,0% 10,0% 13,0% Production in
Poland 4% 4% 4% 4% 4% 4% 4% 4%
[image:5.482.127.422.552.661.2]50 PLN/item Global supply -
100 PLN/item 9% 5% 5% -1% 9% 5% 4% 3%
Global supply -
400 PLN/item 9% 7% 7% 4% 9% 4% 3% 1%
[image:6.482.91.389.186.366.2]Source: own study based on market data
[image:6.482.91.388.407.587.2]Figure 1 Impact of changes of maritime freight rates on profitability of supply strategies
Figure 2 Impact of changes of production costs on profitability of supply strategies
costs in the value of goods (graph 1). This rise would have to be very big if it were to be a threat for profitability of global supply chains – even in the case of the cheapest goods this rise would have to be more than 180%, what doesn’t seem possible in the nearest future. Such small impact of the growth of the freight rates on this profitability is the result of the small share of transport costs in the ocean transport in the value of goods. These results are similar to the OECD data concerning this problem (OECD, 2005)
Second simulation concerned changes of production costs in the low-costs countries. Here – quite contrary than in the first simulation – profitability of the most expensive products have been mostly affected (graph 2). The increase of only 8% of production costs of global suppliers will make production in Poland so profitable as in the low costs countries. For the cheapest goods this is - 13%. In all three cases however these increases of prices are still very much lower when compared with the increases of the freight rates. Although then it is very unlikely that changes of prices in the transportation market could affect this market, it very possible, that rising costs of production will have impact on the profitability of global supply chains and indirectly on the volume of goods carried out by sea.
Conclusions
The conducted research confirm, that the phenomena in the global supply chains in the clothing industry described in the scientific and professional literature indeed take place. Simulations based on the obtained data can be helpful in explaning the nature of these phenomena, that means reasons for changes taking place in the global supply chains. These changes can relate localization of production but also changes in global transport market. Even not very big increases of costs production of garment in Far East could decrease economic efficiency of the global outsourcing, what could have impact on the market of maritime transport.
However, it should be emphasized, that simulations have been conducted taking into account greater flexibility of local sources and higher costs of the lost sales in the global supply chains. Without this assumption the profitability of the local sourcing would much lower, what proves, that flexibility in the supply chains is of very great importance. The model and simulations conducted with the use of this model confirm the rightness of opinions expressed by the practicioners and researchers (e.g. M. Christopher) concerning the importance both of costs of production and possibility of quick response in the supply chains. While it is difficult to find justification for the views on the large role of changes in freight rates on the location of production in these chains.
References
1. Bruce, M., Daly, L., Towers, N., (2004) "Lean or agile: A solution for supply chain management in the textiles and clothing industry?", International Journal of Operations & Production Management, Vol. 24 Issue: 2, pp.151-170
2. Christopher, M., Lowson, R. H., Peck, (2004) Creating agile supply chains in the fashion industry. International Journal of Retail and Distribution Management, Vol. 32, Issue 8, pp. 367 – 376.
3. Global Container Terminal Operators Annual Review and Forecast 2017, Drewry
Technology Management, Vol. 24 Issue: 5, pp.669-687, Kumar, S., Samad Arbi, A., (2007) "Outsourcing strategies for apparel manufacture: a case study", Journal of Manufacturing Technology Management, Vol. 19 Issue: 1, pp.73-91
5. Lam, J. K.C., Postle, R., (2006) "Textile and apparel supply chain management in Hong Kong", International Journal of Clothing Science and Technology, Vol. 18 Issue: 4, pp.265-277
6. Mangan D. J. (2017), Foresight – Future of the Sea Evidence Review Foresight, Government Office for Science
7. Manuj, Ila, Mentzer, John T., (2008) "Global supply chain risk management strategies",International Journal of Physical Distribution & Logistics Management, Vol. 38 Issue: 3, pp.192-223,
8. Milewska B. (2016), Wyzwania w zarządzaniu międzynarodowymi łańcuchami dostaw z uwzględnieniem uwarunkowań kulturowych, Studia Zarządzania i Finansów, Wydawnictwo WSB 11/2016
9. Milewska, B. Milewski, D. Efektywność strategii zakupów, Eurologistics 3/2017, s. 18-21.
10. Min, H., (2012), Maritime Logistics and Supply Chain Security, in Dong-Wook Song , Photis M. Panayides (ed.) Maritime Logistics, pp.91 – 116
11. Munim, ZH, Schramm, HJ (2017). Forecasting container shipping freight rates for the Far East - Northern Europe trade lane. Maritime Economics & Logistics 19 (1), p 106-125
12. OECD (2005) DSTI/DOT/MTC(2005)5/REV1
(https://people.hofstra.edu/geotrans/eng/ch3en/conc3en/table_containershippi ngcosts.html)
13. Production of major industrial products November 2017, GUS, 2018.
14. PwC. (2013) Global supply chain survey 2013: Next generation supply chains efficient, fast and taylored.