This is a repository copy of
A simplified model for seismic response prediction of
concentrically braced frames
.
White Rose Research Online URL for this paper:
http://eprints.whiterose.ac.uk/86382/
Version: Accepted Version
Article:
Hajirasouliha, I. and Doostan, A. (2010) A simplified model for seismic response prediction
of concentrically braced frames. Advances in Engineering Software, 41 (3). 497 - 505.
ISSN 0965-9978
https://doi.org/10.1016/j.advengsoft.2009.10.008
[email protected] https://eprints.whiterose.ac.uk/ Reuse
Unless indicated otherwise, fulltext items are protected by copyright with all rights reserved. The copyright exception in section 29 of the Copyright, Designs and Patents Act 1988 allows the making of a single copy solely for the purpose of non-commercial research or private study within the limits of fair dealing. The publisher or other rights-holder may allow further reproduction and re-use of this version - refer to the White Rose Research Online record for this item. Where records identify the publisher as the copyright holder, users can verify any specific terms of use on the publisher’s website.
Takedown
If you consider content in White Rose Research Online to be in breach of UK law, please notify us by
Hajirasouliha I & Doostan A (2010) A simplified model for seismic response prediction of concentrically braced frames. Advances in Engineering Software, 41(3), 497-505.
A simplified model for seismic response prediction of
concentrically braced frames
Iman Hajirasoulihaa, Alireza Doostanb
a
Civil Engineering Department, The University of Science & Culture, Tehran, Iran
b
Department of Mechanical Engineering, Stanford University, Stanford, CA, USA
Abstract
This paper proposes a simplified analytical model for seismic response prediction of concentrically braced frames. In the proposed approach, a multistory frame model is reduced to an equivalent shear-building one by performing a static pushover analysis. The conventional shear-building model has been improved by introducing supplementary springs to account for flexural displacements in addition to shear displacements. The adequacy of the modified model has been verified by conducting nonlinear dynamic analysis on 5, 10 and 15 story concentrically braced frames subjected to 15 synthetic earthquake records representing a design spectrum. It is shown that the proposed improved shear-building models provide a better estimate of the nonlinear dynamic response of the original framed structures, as compared to the conventional models. While simplifying the analysis of concentrically braced frames to a large extend, and thus reducing the computational efforts significantly, the proposed method is accurate enough for practical applications in performance assessment and earthquake-resistant design.
Keywords: concentrically braced frames; shear buildings; non-linear dynamic analysis; seismic
1- Introduction
Both structural and nonstructural damages observed during earthquake ground motions are primarily produced by lateral displacements. Thus, the estimation of lateral displacement demands is of significant importance in performance-based design methods; specially, when damage control is the main quantity of interest. Most structures experience inelastic deformations when subjected to severe earthquake ground motions. Therefore, nonlinear behaviour of structures should be taken into account to have accurate estimation of deformation demands. Nonlinear time history analysis of a detailed analytical model is perhaps the best option for the estimation of deformation demands. However, due to many uncertainties associated with the site-specific excitation as well as uncertainties in the parameters of analytical models, in many cases, the effort associated with detailed modeling and analysis may not be justified and feasible. Therefore, it is prudent to have a reduced model, as a simpler analysis tool, to assess the seismic performance of a frame structure. Construction of such reduced model is the main goal of the present study.
For the purpose of preliminary design and analysis of structures, many studies have been carried out to construct reduced nonlinear models that feature both accuracy and low computational cost. Miranda [5, 6] and Miranda et al. [7] have incorporated a simplified model of a building based on an equivalent continuum structure consisting of a series of flexural and shear cantilever beams to estimate deformation demands in multistory buildings subjected to earthquakes. Although in that method the effect of nonlinear behavior is considered by using some amplification factors, the flexural and shear cantilever beams can only behave in elastic range of vibration. Some researchers [2, 8, 9] have attempted to develop analytical models to predict the inelastic seismic response of reinforced concrete shear-wall buildings, including both the flexural and shear failure modes. Lai et al. [10] developed a multi-rigid-body theory to analyze the earthquake response of shear-type structures. In that work, material non-linearity can be incorporated into the multi-rigid-body discrete model; however, it is not possible to calculate the nodal displacements caused by flexural deformations, which in most cases has a considerable contribution to the seismic response of frame-type structures.
analysis on 5, 10 and 15 story concentrically steel braced frames subjected to 15 different synthetic earthquake records representing a design spectrum. It is shown that the proposed modified shear-building models more accurately estimate the nonlinear dynamic response of the corresponding concentrically braced frames compare to the conventional shear-building models.
2- Modeling and assumptions
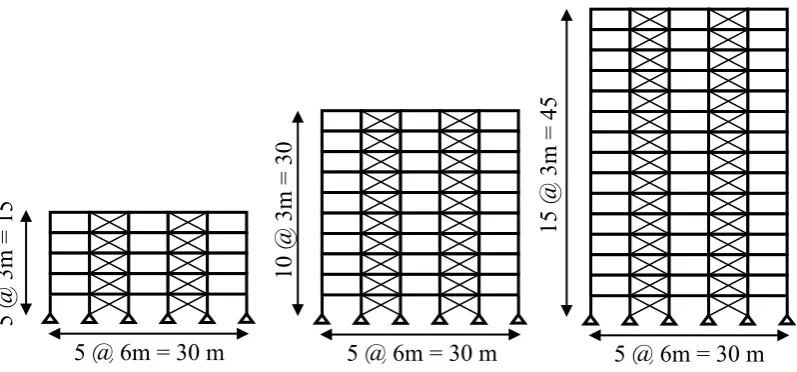
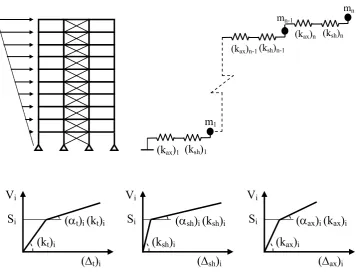
In the present study, three steel concentric braced frames with 5, 10 and 15 stories have been selected (Fig. 1). The buildings are assumed to be located on a soil type SD and a
seismically active area, zone 4 of the UBC 1997 [15] category, with PGA of 0.44 g. Simple beam to column connections are considered to prevent the transmission of any moment from beams to the supporting columns. The frame members are sized to support gravity and lateral loads determined in accordance with the minimum requirements of UBC 1997 [15]. In all models, the top story is 25% lighter than the others. IPB, IPE and UNP sections, according to DIN standard, are chosen for columns, beams and bracings, respectively. All joint nodes at the same floor were constrained together in the horizontal direction of the input ground motion. Once the structural members are seized, the entire design is checked for the code drift limitations and if necessary refined to meet the requirements.
For the static and nonlinear dynamic analysis, the computer program Drain-2DX [16] is used. The Rayleigh damping is adopted with a constant damping ratio 0.05 for the first few effective modes. The columns were modelled using a fibre-type element with distributed plasticity (element 15) in which the location of non-linearity within the elements is computed during the analysis. The brace members are assumed to have elastic-plastic behaviour in tension and compression. The yield capacity in tension is set equal to the nominal tensile resistance, while the yield capacity in compression is set equal to 0.28 times the nominal compressive resistance as suggested by Jain et al. [17].
UBC 1997 [15] with a PGA of 0.44g. Therefore, these synthetic earthquake records are expected to be representative of the design spectra. The comparisons between artificially generated spectra and the UBC 1997 [15] design spectra are shown in Fig. 2.
3- Conventional shear building model
The conventional shear building model is an assembly of structural members connected along horizontal interfaces, which coincide with the floor levels and, therefore, with the levels where the building mass is assumed to be concentrated. These members can only undergo shear deformations when subjected to lateral forces as shown in Fig. 3.
The conventional shear building model has n degrees of freedom where n is the number of stories. The lateral stiffness (kt)i , yield strength Si and over-strength factor (αt)i of the structural
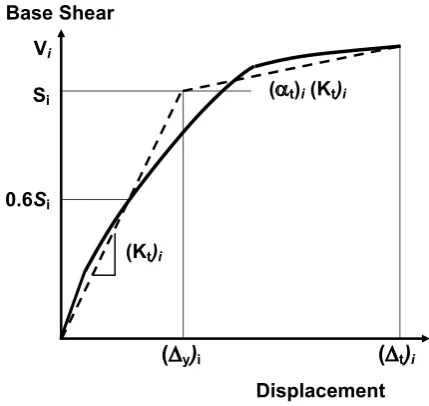
element representing the mechanical properties of the ith floor, are computed on the basis of adequate assumptions regarding the deformed shape of the original frame. To accomplish this, a pushover analysis is conducted on the full-model framed structure and the relationship between the story shear force (Vi) and the total inter-story drift (∆t)i is extracted. The nonlinear
force-displacement relationship has been replaced with an idealized relationship to calculate the nominal story stiffness (kt)i and effective yield strength (Si) of each story as shown in Fig. 4. Line
segments on the idealized force-displacement curve have been located using an iterative procedure that approximately balances the area above and below the curve. The nominal story stiffness (kt)i is then taken as the secant stiffness calculated at a story shear force equal to 60%
of the effective yield strength of the story [19, 20].
characteristics of the structure. This problem can be mitigated to some extend by applying more than one lateral load pattern which includes those that excite elastic higher mode effects.
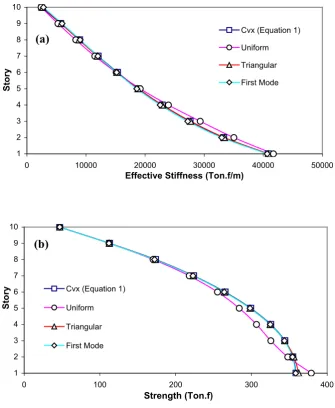
In this study, pushover analyses are performed under different lateral load patterns to investigate the effects of pre-assumed load pattern on computed mechanical properties of each story. For all pushover analyses four different vertical distribution of lateral load are considered; a vertical distribution proportional to the shape of the fundamental mode of vibration; a triangular distribution according to UBC 97 [15]; a uniform distribution proportional to the total mass at each level; and finally a vertical distribution proportional to the values of Cvx given by
following equation [19, 20]:
∑
=
=
ni k i i
k x x vx
h
w
h
w
C
1
, (1)
where Cvxis the vertical distribution factor, wi and hi are the weight and height of the i
th
floor above the base, respectively. Also, n is the number of stories and k is an exponent increases from 1 to 2 as period varies from 0.5 to 2.5 second.
The lateral stiffness and yield strength distributions corresponding to each case are compared in Fig. 5 for a 10-story concentrically braced frame. As shown in this figure, mechanical properties of the stories are rather insensitive to the predetermined lateral load pattern used for pushover analyses. It is particularly true if a rational lateral load distribution is used.
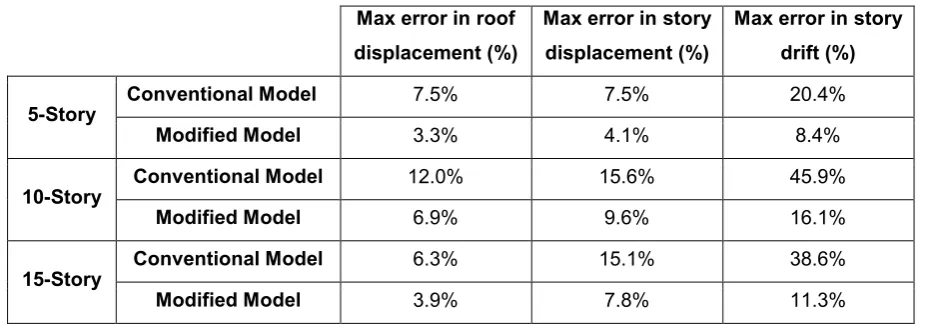
synthetic earthquakes has been calculated. Table 1 summarizes the maximum errors corresponding to 5, 10 and 15 story concentrically braced frames. As indicated in this table, using modified shear building models, maximum errors in estimation of roof and story displacements are small (less than 16 percent). However, maximum roof and story displacements are not good indicators of seismic performance of a structure as compared with story drifts. The results presented in Table 1 show that the errors in estimation of story drifts are much larger (2.5 times higher) compared to story displacements. Therefore, conventional shear-building models are not reliable enough to estimate the maximum story drifts of concentrically braced frames for the case of large non-linear deformations which is observed in sever earthquakes.
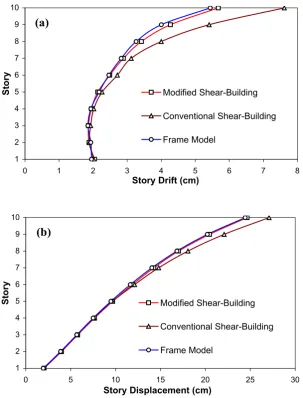
In Fig. 6, the maximum story displacement and maximum drift distribution of the 10-story frame obtained using conventional shear-building models are compared with the average of actual values for 15 synthetic earthquakes. This figure shows that, on average, conventional shear building models provide reasonable estimates of maximum roof and story displacements; however, estimated story drifts are not accurate enough. The errors are especially large for the case of the maximum drift estimated at the level of top stories where the estimated drift is 40% higher than the actual value. Although seismic forces in top stories may not control the overall design of the structure, inter-story drifts at the top floors could govern the seismic design of multi-story frames, especially for high-rise buildings where the higher mode effects are considerable.
As described very briefly, in the present study, the conventional shear-building model has been modified in order to achieve a better estimation of nonlinear dynamic response of real framed structures. More details of such extension are presented next.
4- Shear and flexural deformations
inter-story drift is considered as a reliable indicator of damage to nonstructural elements, and is widely used as a failure criterion because of the simplicity and the convenience associated with its estimation.
Considering the 2-D frame shown in Fig. 7-a, the axial deformation of columns results in increase of lateral story and inter-story drifts. In each story, the total inter-story drift (∆t) is a
combination of the shear deformation (∆sh), due to shear flexibility of the story, and the flexural
deformation (∆ax), due to axial flexibility of the lower columns. Hence, inter-story drift can be
expressed as:
ax sh
t
=
∆
+
∆
∆
. (2)Flexural deformation does not contribute in the damage imposed to the story, though it may impair the stability due to the P-∆ effects. Neglecting the axial deformation of beams, the shear deformation for a single panel, as shown in Fig. 7-b, is determined by [24],
∆
sh= ∆
t+
H
2
L
(
U
3+
U
6−
U
2−
U
5)
. (3)where, U5, U6, U2 and U3 are vertical displacements, as shown in Fig. 7-b. H and L are the
height of the story and the span length, respectively. The derivation of Equation (3) is described in detail in Moghaddam et al. [25]. For multi-span models, the maximum value of the shear drift in different panels is considered as the shear story drift.
5- Modified shear building model
flexural displacements in addition to shear displacements. According to the number of stories, the structure is modeled with n lumped masses, representing the stories. Only one degree of freedom of translation in the horizontal direction is taken into consideration and each adjacent mass is connected by two supplementary springs as shown in Fig. 8. As shown in this figure, the modified shear-building model of a frame condenses all the elements in a story into two supplementary springs, thereby significantly reduces the number of degrees of freedom. The stiffnesses of supplementary springs are equal to the shear and bending stiffnesses of each story, respectively. These stiffnesses are determined by enforcing the model to undergo the same displacements as those obtained from a pushover analysis on the original frame model. As shown in Fig. 8, the material nonlinearities may be incorporated into stiffness and strength of supplementary springs. In Fig. 8, mi represents the mass of ith floor; and Vi and Si are,
respectively, the total shear force and yield strength of the ith story obtained from the pushover analysis. (kt)i is the nominal story stiffness corresponding to the relative total drift at i
th
floor (∆t in
Fig. 7). (ksh)i denotes the shear story stiffness corresponding to the relative shear drift at i
th
floor (∆sh in Fig. 7). (kax)i represents the bending story stiffness corresponding to the flexural
deformation at ith floor (∆ax in Fig. 7), and (αt)i, (αsh)i and (αax)i are over-strength factors for
nominal story stiffness, shear story stiffness and bending story stiffness at ith floor, respectively. (kt)i and (αt)i are determined from a pushover analysis taking into account the axial deformation
of columns. In this study, the nonlinear force-displacement relationship between the story shear force (Vi) and the total inter-story drift (∆t)i has been replaced with an idealized bilinear
relationship to calculate the nominal story stiffness (kt)i and effective yield strength (Si) of each
story as shown in Fig. 8. Line segments on the idealized force-displacement curve have been located using an iterative procedure that approximately balanced the area above and below the curve. The nominal story stiffness (kt)i is then taken as the secant stiffness calculated at a story
shear force equal to 60% of the effective yield strength of the story [19, 20].
Using Equation (3), shear story drift corresponding to each step of pushover analysis can be calculated and consequently (ksh)i and (αsh)i are determined. As the transmitted force is equal in
For Vi
≤
Si , i ax i i sh i i t ik
V
k
V
k
V
)
(
)
(
)
(
=
+
. (4)Hence, i ax i sh i
t
k
k
k
(
)
1
)
(
1
)
(
1
+
=
. (5)For Vi > Si we have
i ax i ax i i i ax i i sh i sh i i i sh i i t i t i i i t i
k
S
V
k
S
k
S
V
k
S
k
S
V
k
S
)
(
)
(
)
(
)
(
)
(
)
(
)
(
)
(
)
(
α
α
α
−
+
+
−
+
=
−
+
. (6)Substituting Equation (5) in (6), (kax)i and (αax)i are obtained as follows:
i t i sh i t i sh i ax
k
k
k
k
k
)
(
)
(
)
(
)
(
)
(
−
=
. (7)[
]
i t i t i sh i sh i t i sh i t i sh i axk
k
k
k
)
(
)
(
)
(
)
(
)
(
)
(
)
(
)
(
)
(
α
α
α
α
α
−
−
=
. (8)Calculations show that (αax)i is almost equal to 1 when columns are designed to prevent
buckling against earthquake loads, thus implying that the spring which represents the axial deformation always remains in the elastic deformation range. As will be described in the sequel, for each frame model, all the required parameters of the modified shear-building can be determined by performing only one pushover analysis. By considering P-∆ effects in this
pushover analysis, the modified model will be capable to account for P-∆ effects as well.
well as the effects of material non-linearity; therefore, it represents the behavior of frame models more realistically as compared to the conventional shear-building model.
To investigate the reliability of the proposed modified model in estimating the seismic response parameters of concentrically braced frames, non-linear time history analyses have been performed for 5, 10 and 15 story frames and their corresponding modified shear-building models subjected to 15 synthetic earthquakes. It is shown in Fig.6 that the modified model is capable to estimate the nonlinear seismic response of the 10 story concentrically braced frame more accurately compare to the conventional shear-building model.
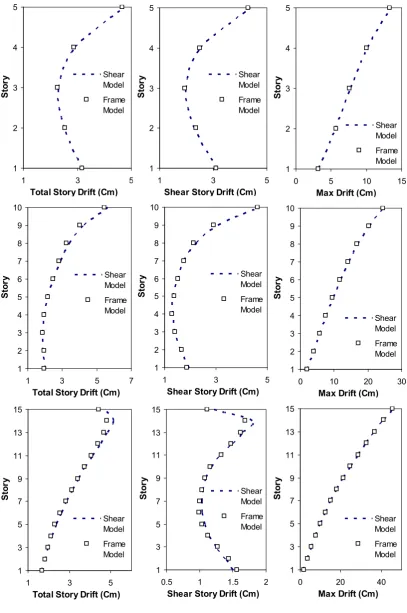
Average of the displacement demands for 5, 10 and 15 story frame models and their corresponding modified shear building models are compared in Fig. 9. This Figure indicates that on average, modified shear-building models are capable to predict story displacement, total inter-story drift and shear inter-story drift of concentrically braced frames very accurately.
For each synthetic excitation, the errors in prediction of displacement demands between the modified shear-building model analysis and the original frame are determined. Consequently, the average of these errors is calculated for every story. Maximum errors corresponding to 5, 10 and 15 story frames are summarized in Table 1. It is shown that maximum errors associated with the modified shear building model are significantly less than the corresponding values for the conventional shear-building model, particularly for story drifts where the errors are almost one third of those estimated by conventional models. The errors are slightly larger for prediction of drift than for estimation of displacement. However, for modified shear building models, the maximum errors in all response quantities are only a few percent (less than 16%).
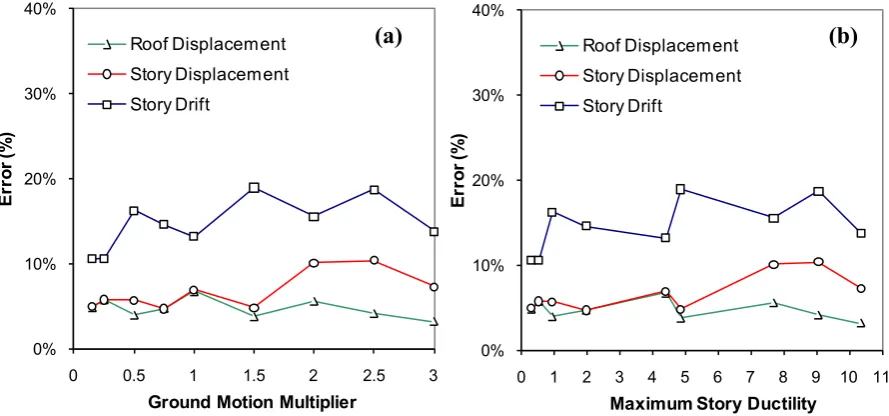
model and its corresponding modified shear-building model are obtained for ground motions of different intensity. These excitations are scaled El Centro 1940 ground motions with scaling coefficients 0.15, 0.25, 0.5, 0.75, 1.0, 1.5, 2.0, 2.5, and 3.0. For each excitation, the errors in response quantities obtained by the modified shear-building model compared to the corresponding original frame response quantities are determined. Fig. 10 summarizes the maximum errors in displacement demands estimated by modified shear-building models as a function of ground motion intensity, indicated by the ground motion scale coefficient, and maximum story ductility. One can observe from this figure that these errors are larger in story drifts compared to story displacements; however, maximum errors are less than 20% even for very intense ground motions. This is further illustrated in Fig. 10 that the errors are almost independent to the ground motion intensity and maximum story ductility. Therefore, it can be concluded that the modified shear-building model estimates the seismic response of buildings experienced high inelastic deformations (i.e. story ductility more than 10) with the same degree of accuracy as it predicts the response of elastic systems. The same observations have been made with other models and under different ground motions.
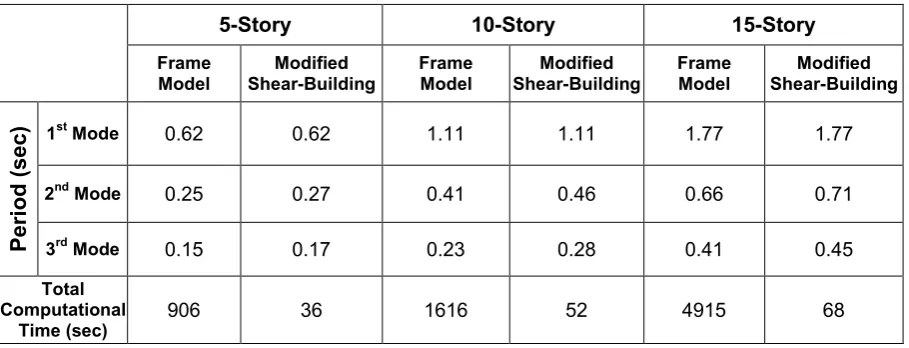
As mentioned before, the behavior of modified shear building model is idealized by a bilinear force-displacement curve. For the concentrically braced frames, the nominal story stiffness in the equivalent modified shear building model is very close to the initial tangent stiffness of the typical full-frame model. Therefore, modified shear building model has a good capability to estimate the natural periods of the corresponding full-frame model. The close prediction of the natural periods in full frame models and their corresponding modified shear building models for 5, 10 and 15 story braced frames are illustrated in Table 2. It is shown that using modified shear-building model, the period of the first three vibration modes agree very well with the natural periods of the full-frame model. This is particularly true for the fundamental period (1st mode) where the predicted values are almost identical with the actual values.
results in significant computational savings, while maintaining the accuracy, as compared to the corresponding frame model. According to the results, total computational time for modified shear-building models are less than 4% of those based on typical frame models.
6- Cumulative damage
The peak shear story drift may not always be the best performance criterion for performance base design as it occasionally fails in predicting the state of structural damage in earthquakes. To investigate the extent of cumulative damage, the damage criterion proposed by Baik et al. [26] based on the classical low-cycle fatigue approach has been adopted. The story inelastic shear deformation is chosen as the basic damage quantity, and the cumulative damage index after N excursions of plastic deformation is calculated as:
⋅
∆
=
∑
=
c N
j yi
pj i
D
1
δ
δ
(9)
Where Di is the cumulative damage index at i
th
story, ranging from 0 for undamaged to 1 for severely damaged stories, ∆δpj is the plastic deformation of i
th
story in jth excursion, δyi is the
nominal yield deformation, and c is a parameter that accounts for the effect of magnitude of plastic deformation taken to be 1.5 [27]. To assess the damage experienced by the whole structure, the global damage index is obtained as a weighted average of the damage indices at the story levels, with the energy dissipated being the weighting function given by:
D
g=
D
iW
pii=1
n
∑
W
pii=1
n
∑
,
(10)where Dg is the global damage index, Wpi is the energy dissipated at i
th
story, Di is the damage
Using this equation, the global damage index has been calculated for 5, 10 and 15 story concentrically braced frames and their corresponding modified shear-building models subjected to 15 synthetic earthquakes. As an example, the global damage index of 10-story frame obtained by modified shear-building model is compared with those obtained by full-frame model in Fig. 11. The results suggest that, from low level (less than 20%) to thigh level (more than 70%) of damage intensity, the global damage experienced by the concentrically braced frames can be estimated utilizing modified shear-building models up to an acceptable accuracy for practical applications.
Estimation of peak inelastic deformation demands is a key component of any performance-based procedure for earthquake-resistant design of new structures or for seismic performance evaluation of existing structures. The modified shear building models proved to be capable to account for contribution of several modes of vibration, P-∆ effects and characteristics of the ground motions. Therefore, evaluating the deformation demands and cumulative damages using modified shear-building models is demonstrated to be reasonably close to those of the full-frame models. This makes it an appropriate model to be utilized in seismic performance-based design softwares. In practical applications, due to significantly low computational efforts associated with the proposed modified shear-building model, one can possibly consider more design alternatives and earthquake ground motions as opposed to designs based on the full-frame model. Therefore, the modified shear-building model can be efficiently used for optimum seismic design of structures where many nonlinear dynamic analyses would be required to get to the optimum solution [25].
7- Conclusions
15%, they are particularly large for the maximum drift at top stories where the estimated drift could be more than 40% higher than the actual value.
2. The conventional shear-building model has been modified by introducing supplementary springs to account for flexural displacements in addition to shear drifts. It is shown that the accuracy of modified shear building models to predict story displacements and peak inter-story drifts is significantly higher than conventional models.
3. It is shown that the modified shear-building model is not sensitive to the ground motion intensity and maximum story ductility; and therefore, could be utilized to estimates the seismic response of concentrically braced frames from elastic to highly inelastic range of behaviour. The results indicate that the proposed model is also capable to estimate the global damage experienced by the concentrically braced frames from low (less than 20%) to high (more than 70%) level of damage intensity.
References
[1] Qi X, Moelhe JP. Displacement design approach for reinforced concrete structures subjected to earthquakes. Report No. UBC/EERC-91/02. University of California, Earthquake Engineering Research Center, Berkeley, CA; 1991.
[2] Fajfar P, Gaspersic P. The N2 method for the seismic damage analysis of RC buildings, Earthquake Engineering and Structural Dynamics 1996; 25: 31-46.
[3] Seneviratna GDPK, Krawinkler H. Evaluation of inelastic MDOF effects for seismic design. John A. Blume Earthquake Engineering Center Report No. 120, Department of Civil Engineering, Stanford University; 1997.
[5] Miranda E. Estimation of maximum inter-story drift demands in displacement-based design. In: Fajfar P, Krawinkler H, Proc. Workshop on Seismic Design Methodologies for the Next Generation of Codes. Balkema; Rotterdam; 1997. p. 253-264.
[6] Miranda E. Approximate seismic lateral deformation demands in multistory buildings. Journal of Structural Engineering 1999; 125(4): 417–425.
[7] Miranda E, Reyes CJ. Approximate lateral drift demands in multistory buildings with non-uniform stiffness’, Journal of Structural Engineering 2002; 128(7): 840–849.
[8] Saiidi M, Sozen MA. Simple Nonlinear Seismic Analysis of RC Structures, Journal of Structural Division, ASCE 1981; 107(5): 937-952.
[9] Hidalgo PA, Jordan RM, Martinez MP. An analytical model to predict the inelastic seismic behavior of shear-wall, reinforced concrete structures. Engineering Structures 2002; 24(1): 85-98.
[10] Lai M, Li Y, Zhang Ch. Analysis method of multi-rigid-body model for earthquake responses of shear-type structure. In: WCEE 10th Conference; 1992, p. 4013-4018.
[11] Penzien J. Elasto-plastic response of idealized multy-story structures subjected to a strong motion earthquake. In: WCEE 2nd Conference; 1960.
[12] Hisada T, Nakagawa K, Izumi M. Earthquake response of idealized twenty story buildings having various elasto-plastic properties. In: WCEE 3rd Conference; 1965.
[13] Veletsos AS, Vann WP. Response of ground-excited elasto-plastic systems, ASCE 1971; 97(4): 1257-1281.
[15] UBC. Structural engineering design provisions. In: Uniform Building Code. International Conference of Building Officials, vol. 2; 1997.
[16] Prakash V, Powell GH, Filippou, FC. DRAIN-2DX: Base program user guide. Report No. UCB/SEMM-92/29; 1992.
[17] Jain AK, Goel SC, Hanson RD. Hysteretic cycles of axially loaded steel members. Journal of Structural Division, ASCE 1980; 106(8): 1777-1795.
[18] Vanmarke EH. SIMQKE: A Program for Artificial Motion Generation. Civil Engineering Department, Massachusetts Institute of Technology; 1976.
[19] FEMA 273. NEHRP guidelines for the seismic rehabilitation of buildings. Federal Emergency Management Agency; 1997.
[20] FEMA 356, Prestandard and commentary for the seismic rehabilitation of buildings. Washington, DC: Federal Emergency Management Agency; 2000.
[21] Krawinkler H, Seneviratna GDPK. Pros and cons of a pushover analysis of seismic performance evaluation. Engineering Structures 1998; 20(4–6): 452– 464.
[22] Guptas A, Krawinkler H. Estimation of seismic drift demands for frames structures, Earthquake Engineering and Structural Dynamics 2000; 29 (99): 1287-1305.
[23] SEAOC. Vision 2000, performance based seismic engineering for buildings. Sacramento, CA: Structural Engineers Association of California; 1995.
[25] Moghaddam H, Hajirasouliha I, Doostan A. Optimum seismic design of concentrically braced steel frames: concepts and design procedures. Journal of Constructional Steel Research 2005; 61(2): 151-166.
[26] Baik SW, Lee DG, Krawinkler H. A simplified model for seismic response prediction of steel frame structures. In: The 9th word Conference on Earthquake Engineering, Japan, Vol. V.; 1988.
List of symbols
The following symbols are used in this paper:
(αax)i = Over-strength factors for bending story stiffness at i
th
floor
(αsh)i = Over-strength factors for shear story stiffness at i
th
floor
(αt)i = Over-strength factors for nominal story stiffness at i
th
floor
∆δpj = Plastic deformation of i th
story in jth excursion
δyi = Nominal yield deformation of i
th
story
∆t = Total inter-story drift
∆sh = Shear inter-story drift
∆ax = Flexural inter-story drift
Cvx= Vertical distribution factor for lateral loads
c = Parameter that accounts for the effect of magnitude of plastic deformation
Dg = Global damage index
Di = Cumulative damage index at i
th
story
H = Height of the story
hi = Height of ith story
k = Positive number as a power
(kax)i = Bending story stiffness of i
th
story
(ksh)i = Shear story stiffness of i
th
story
L = Span length
N= Number of plastic excursions
n = Number of stories
Si = Shear yield strength of i
th
story
Vi = Total shear force of i
th
story
U1 =Horizontal displacement at the bottom line of the panel
U2, U3 =Vertical displacements at the bottom line of the panel
U4 =Horizontal displacement at the top line of the panel
U5, U6 =Vertical displacements at the top line of the panel
wi = Weight of i
th
story
Wpi = Energy dissipated at i
th
Fig. 1. Typical geometry of concentric braced frames
0 0.2 0.4 0.6 0.8 1 1.2 1.4
0 0.5 1 1.5 2 2.5
Period (Sec)
P
s
e
u
d
o
A
c
c
e
le
ra
ti
o
n
(
g
)
UBC 97
Ave. of 15 Sim. Eq.
Fig. 2. UBC design spectrum and average response spectra of 15 synthetic earthquakes (5%
damping)
5 @ 6m = 30 m
10 @
3m
=
30
5 @ 6m = 30 m
5 @
3m
=
15
5 @ 6m = 30 m
15 @
3m
=
[image:22.595.110.491.412.633.2]Fig. 3. Conventional shear-building model
Fig. 4. Idealized force-displacement curves
F M
Si
0.6Si
(Kt)i
(
∆
y)
i(
∆
t)
iDisplacement Vi
(
α
t)i (Kt)i [image:23.595.193.408.410.613.2]1 2 3 4 5 6 7 8 9 10
0 10000 20000 30000 40000 50000
Effective Stiffness (Ton.f/m)
Sto
ry
Cvx (Equation 1)
Uniform
Triangular
First Mode
1 2 3 4 5 6 7 8 9 10
0 100 200 300 400
Strength (Ton.f)
Sto
ry Cvx (Equation 1)
Uniform
Triangular
[image:24.595.131.467.117.526.2]First Mode
Fig. 5. The effect of vertical distribution of lateral loads on computed mechanical properties; (a) Story
stiffness, (b) Story strength
(a)
1 2 3 4 5 6 7 8 9 10
0 1 2 3 4 5 6 7 8
Story Drift (cm)
S
to
ry
Modified Shear-Building
Conventional Shear-Building
Frame Model
1 2 3 4 5 6 7 8 9 10
0 5 10 15 20 25 30
Story Displacement (cm)
S
to
ry
Modified Shear-Building
Conventional Shear-Building
Frame Model
Fig. 6. Comparison of frame model, conventional shear-building model and modified shear-building
model for 10-story braced frame, Average of 15 synthetic earthquakes; (a) Story drift, (b) Story displacement
(a)
[image:25.595.148.452.75.474.2]Fig. 7.(a) Definitions of total inter-story drift (∆t), shear inter-story drift (∆sh) and the effect of axial
flexibility of columns (∆ax), (b) Displacement components of a single panel.
Fig. 8. Using push over analysis to define equivalent modified shear-building model
V
i(
∆
sh)
iS
i(k
sh)
i(
α
sh)
i(k
sh)
iV
i(
∆
t)
iS
i(k
t)
i(
α
t)
i(k
t)
iV
i(
∆
ax)
iS
i(k
ax)
i(
α
ax)
i(k
ax)
im1
(ksh)1
(kax)1
mn-1
mn
(ksh)n-1
(kax)n-1
(ksh)n
(kax)n
∆
ax∆
sh∆
t=
∆
ax+
∆
sh(a)
(b)
U
1U
2U
4U
5U
1U
3U
4U
6 [image:26.595.102.461.399.672.2][image:27.595.84.492.84.698.2]
Fig. 9. Comparison of the full-frame model and the corresponding modified shear-building model for 5,
10 and 15-story braced frames, Average of 15 synthetic earthquakes
1 2 3 4 5
1 3 5
Total Story Drift (Cm)
Sto
ry ShearModel
Frame Model 1 2 3 4 5
1 3 5
Shear Story Drift (Cm)
Sto
ry ShearModel
Frame Model 1 2 3 4 5
0 5 10 15
Max Drift (Cm)
Sto ry Shear Model Frame Model 1 2 3 4 5 6 7 8 9 10
1 3 5
Shear Story Drift (Cm)
Sto
ry ShearModel
Frame Model 1 2 3 4 5 6 7 8 9 10
0 10 20 30
Max Drift (Cm)
Sto ry Shear Model Frame Model 1 2 3 4 5 6 7 8 9 10
1 3 5 7
Total Story Drift (Cm)
Sto
ry ShearModel
Frame Model 1 3 5 7 9 11 13 15
0.5 1 1.5 2
Shear Story Drift (Cm)
Sto ry Shear Model Frame Model 1 3 5 7 9 11 13 15
0 20 40
Max Drift (Cm)
Sto ry Shear Model Frame Model 1 3 5 7 9 11 13 15
1 3 5
Total Story Drift (Cm)
Fig. 10. Errors in displacement demands obtained by modified shear-building models as a function of (a) ground motion intensity; (b) maximum story ductility, 10-story model subjected to El Centro 1940
Fig. 11. Comparison of the global damage index of 10-story frame obtained by modified
shear-building model and full-frame model subjected to 15 synthetic earthquakes
0% 10% 20% 30% 40%
0 0.5 1 1.5 2 2.5 3
E
rr
o
r
(%
)
Ground Motion Multiplier
Roof Displacement Story Displacement Story Drift
0% 10% 20% 30% 40%
0 1 2 3 4 5 6 7 8 9 10 11
E
rr
o
r
(%
)
Maximum Story Ductility
Roof Displacement Story Displacement Story Drift
[image:28.595.116.485.358.556.2]Table 1. Maximum errors in estimated displacement demands using conventional and modified shear-building models, Average of 15 synthetic earthquakes
Max error in roof
displacement (%)
Max error in story
displacement (%)
Max error in story
drift (%)
5-Story
Conventional Model 7.5% 7.5% 20.4%
Modified Model 3.3% 4.1% 8.4%
10-Story
Conventional Model 12.0% 15.6% 45.9%
Modified Model 6.9% 9.6% 16.1%
15-Story
Conventional Model 6.3% 15.1% 38.6%
Table 2. Natural periods and total computational time for full-frame model and the corresponding modified shear-building model
5-Story 10-Story 15-Story
Frame Model
Modified Shear-Building
Frame Model
Modified Shear-Building
Frame Model
Modified Shear-Building
P
e
ri
o
d
(
s
e
c
)
1stMode 0.62 0.62 1.11 1.11 1.77 1.77
2nd Mode 0.25 0.27 0.41 0.46 0.66 0.71
3rd Mode 0.15 0.17 0.23 0.28 0.41 0.45
Total Computational
Time (sec)