A STUDY TO ASSESS THE EFFECTIVENESS OF SENSORY
STIMULATION TECHNIQUE ON SENSORY PERCEPTUAL
ABILITY AND EMOTIONAL WELL-BEING ON MENTALLY
CHALLENGED CHILDREN ATTENDING A SELECTED SPECIAL
SCHOOL, AT DINDIGUL DISTRICT.
REGISTER NUMBER: 301432853
A DISSERTATION SUBMITTED TO THE TAMILNADU Dr. M.G.R.
MEDICAL UNIVERSITY, CHENNAI, IN PARTIAL FULFILLMENT
FOR THE DEGREE OF MASTER OF SCIENCE IN NURSING.
A STUDY TO ASSESS THE EFFECTIVENESS OF SENSORY
STIMULATION TECHNIQUE ON SENSORY PERCEPTUAL
ABILITY AND EMOTIONAL WELL-BEING ON MENTALLY
CHALLENGED CHILDREN ATTENDING A SELECTED SPECIAL
SCHOOL, AT DINDIGUL DISTRICT
REGISTER NUMBER: 301432853
INTERNAL EXAMINER
EXTERNAL EXAMINER
A DISSERTATION SUBMITTED TO THE TAMILNADU
Dr. M.G.R. MEDICAL UNIVERSITY, CHENNAI, IN PARTIAL
FULFILLMENT FOR THE DEGREE OF
MASTER OF SCIENCE IN NURSING.
CERTIFICATE
This is the bonafide work of
Mr.V.Kathiresan M.Sc Nursing II year
student from Jainee College of Nursing, Dindigul, submitted in partial
fulfillment for the Degree of Master of science in nursing, under The
Tamilnadu Dr.M.G.R.Medical University, Chennai.
Prof.Mrs.K.Thilagavathi, M.Sc.,(Nursing) Ph.D.
Principal,
HOD Department of Psychiatric nursing,
Jainee college of Nursing,
Dindigul.
‘‘EFFECTIVENESS OF SENSORY STIMULATION
TECHNIQUE ON SENSORY PERCEPTUAL ABILITY AND
EMOTIONAL WELL-BEING ON MENTALLY CHALLENGED
CHILDREN ATTENDING A SELECTED SPECIAL SCHOOL".
PROFESSOR IN NURSING
RESEARCH
:………
Prof. Mrs. K. Thilagavathi, M.Sc., (Nursing) Ph.D.
Principal,
Department of Psychiatric Nursing,
Jainee College of Nursing, Dindigul.
CLINICAL SPECIALITY
EXPERT
:………
Prof. Mrs. K. Thilagavathi, M.Sc., (Nursing) Ph.D.
Principal,
HOD Department of Psychiatric Nursing,
Jainee College of Nursing, Dindigul.
CO-GUIDE
: ……….
Mrs.R.Siva Priya, M.Sc., (Nursing).
Asst Professor Department of Psychiatric Nursing
Jainee College of Nursing, Dindigul.
MEDICAL EXPERT :……….
Dr.Deen Westley, MBBS., MD,
Consultant Psychiatrist,
Govt. Head Quarters Hospital, Dindigul.
A DISSERTATION SUBMITTED TO THE TAMILNADU
Dr. M.G.R. MEDICAL UNIVERSITY, CHENNAI, IN PARTIAL
FULFILLMENT FOR THE DEGREE OF
MASTER OF SCIENCE IN NURSING.
ACKNOWLEDGEMENT
I thank and praise the lord all mighty for giving me all the wisdom,
knowledge strength and guidance to complete this study successfully.
“Things do not turn up in this world until somebody turn them up”. I
extent
my
thanks
to
our
most
honoured
Personality
Prof.Mrs.K.Thilagavathi. M.Sc., (Nursing), Ph.D., Principal, Jainee
College of Nursing for her acceptance and approval of the study.
I extend my sincere thanks to our
Mrs.R.Meera., M.Sc, (Nursing)
Vice Principal and a department of OBG Nursing, for valuable guidance and
support to carry out the dissertation work successfully. “The impossible
becomes, to endowed with resource fullness”.
I extend my sincere thanks to our
Mrs.Jeya Sundari., M.Sc,
(Nursing) HOD and a department of Peadiatric Nursing, for valuable
guidance and support to carry out the dissertation work successfully. “The
impossible becomes, to endowed with resource fullness”.
I extend my sincere thanks to our
Mrs.Sivapriya. R., M.Sc,
(Nursing) assistance Professor and a department of Psychiatric Nursing, for
valuable guidance and support to carry out the dissertation work
successfully. “The impossible becomes, to endowed with resource fullness”.
It’s my privilege to express my sincere gratitude and heartfelt thanks
to
Mrs.Kavitha, M.Sc (Nursing), Reader Department Obstetrical and
Gynecological Nursing for valuable support.
It is my pleasure and heartful thanks to
Mr.N.John Kingsly,
M.Sc(Nursing), Lecturer, Jainee College of Nursing for the suggestion to
carry out the study successfully.
It is my pleasure and heartful thanks to
Mrs.Dhanalakshmi,
B.Sc(Nursing), Nursing Tutor, Jainee College of Nursing for the timely help
with suggestions.
It is my pleasure and heartful thanks to
Mrs.P.Angela Mary,
B.Sc(Nursing), Nursing Tutor, Jainee College of Nursing who motivates in
all the occasions during the course.
It is my pleasure and heartful thanks to express our deep sense of
gratitude
Dr.Dean Westly, MBBS, M.D, Consultant psychiatrist, Mesmer
Hospital, Dindigul. For giving me the permission to conduct the study
among the laughter therapy.
It extends my sincere thanks to
Dr.Mrs.Sajeetha Racheal, Principal,
Department of Education, Jainee College of Education, for a valuable
guidance and support to carry out the dissertation work successfully. “The
impossible becomes, to endowed with resource fullness”.
It extend my sincere thanks to
Mr.C.Siva Gurunadhan,M.Sc
(Statistician),The Popular Research Centre, Gandhigram University,
Dindigul.
My sincere gratitude to
Mr.Manimozhi Selvan, M.A(Eng), M.Ed,
Ph.D, Professor, Jainee College of Nursing, for editing the tool in English
and content for manuscript.
My special thanks to all the
subject experts whose spent their
valuable time for validating my tool and intervention.
I extend my heartful thanks to
My Parents friends and
My
Classmates for providing guidance.
TABLE OF CONTENTS
CHAPTER
NO
TITLES
PAGE NO
I
INTRODUCTION
1-5
Back ground of the study
1
Need for the study
2
Statement of the problem
3
Objectives
3
Hypothesis
4
Operational definitions
4
Assumption
5
Delimitations
5
II
REVIEW OF LITERATURE
6-14
Conceptual framework
12
III
METHODOLOGY
15-22
Research approach
15
Research Design
15
Settings
17
Population
17
Sample size
17
Sampling techniques
18
Criteria for sample selection
18
Description of tool
18
Scoring procedure
19
Validity and reliability
19
Pilot study
20
Plan for data analysis
22
Production of Humanrights
22
IV
DATA ANALYSIS AND
INTERPRETATION
23-57
V
DISCUSSION
58-61
VI
SUMMARY, FINDINGS,
IMPLICATIONS,
RECOMMENDATIONS, CONCLUSION
62-67
VII
BIBLIOGRAPHY
68-70
LIST OF TABLES
S. No Particulars Page No
1. Frequency and Percentage distribution of Demographic Variable 24 2. Assess the pre-test and post-test level of sensory perceptual
ability among mentally challenged children’s in experimental and control group.
36
3. Assess the pre-test and post-test level of emotional well-being among mentally challenged children’s in experimental and control group.
39
4. Mean pre-test and post-test level of sensory perceptual ability
among mentally challenged children in experimental group. 42 5. Mean pre-test and post-test level of sensory perceptual ability
among mentally challenged children in control group. 44 6. Mean pre-test and post-test level of emotional well-being among
mentally challenged children in experimental group. 46 7. Mean pre-test and post-test level of emotional well-being among
mentally challenged children in control group. 48 8. Comparison of mean post-test sensory perceptual ability among
mentally challenged children between experimental group and control group.
50
9. Comparison of mean post-test emotional well-being among mentally challenged children between experimental group and control group.
52
10. Association between post-test level of sensory stimulation techniques on sensory perceptual abilities among mentally challenged children and selected demographic variables of samples of experimental group.
54
11 Association between post-test level of sensory stimulation techniques on emotional well-being among mentally challenged children and selected demographic variables of samples of experimental group.
LIST OF FIGURES
S. No Particulars Page No
1. Theoretical Framework Based On Wiedenbach’s Helping Art
Model For Clinical Practice 14
2. Schematic representation of research methodology 16 3. Frequency and Percentage Distribution of Age among mentally
challengedchildren’s 27
4. Frequency and Percentage Distribution of Gender among
mentally challenged children 28
5. Frequency and Percentage Distribution of birth order among
mentally challenged children. 29
6. Frequency and Percentage Distribution of education among
mentally challenged children 30
7. Frequency and Percentage Distribution of type of stay among
mentally challenged children 31
8. Frequency and Percentage Distribution of educational level of
care giver among mentally challenged children. 32 9. Frequency and Percentage Distribution of duration of stay among
mentally challenged children 33
10. Frequency and Percentage Distribution of mode of delivery
among mentally challenged children 34
11 Frequency and Percentage Distribution of religion among
mentally challenged children 35
12 Pre test score level on sensory perception of experimental and
control group. 37
13 Post test score level on sensory perception of experimental and
control group 38
14 Pre test score of emotional wellbeing both experimental and
15 Post test score level on sensory perception of experimental and
control group 41
16 Mean pre-test and post-test level of sensory perceptual ability
among mentally challenged children in experimental group. 43 17 Mean pre-test and post-test level of sensory perceptual ability
among mentally challenged children in control group. 45 18 Mean pre-test and post-test level of emotional well-being among
mentally challenged children in experimental group. 47 19 Mean pre-test and post-test level of emotional well-being among
mentally challenged children in control group. 49 20 Comparison of mean post-test sensory perceptual ability among
mentally challenged children between experimental group and control group
51
21 Comparison of mean post-test emotional well-being among mentally challenged children between experimental group and control group.
LIST OF APPENDIX
No
Title
A
Letter seeking experts opinion for content validation of tool
B
Certificate of English Editing
C
Letter Seeking Permission For Conduct The Study
D
Demographic Variables in English
E
Short Sensory Profile
F
Emotional Well-Being Scale
G
Procedure For Sensory Stimulation Technique For Mentally
Challenged Children.
H
Consent Form
ABSTRACT
1
CHAPTER I
INTRODUCTION
“Children can color the illustrations and read how children living with disabilities are like ordinary children but require a little special attention.”
-GARRISON KEILLOR
BACK GROUND OF THE STUDY
Watching a young child grow is a wonderful and unique experience. Learning to sit up, walk and talk are some of the major milestones a child will achieve. Normal children learn the skills of daily living such as feeding, dressing, toilet training, and social skills such as playing, and interacting with others easily, Mental retardation is defined as significantly sub-average general intellectual functioning, existing concurrently with deficits in adaptive sensory perception and manifested during the developmental period that adversely affects a child’s educational performance. The terms Mental Retardation, Intellectual disability and mental challenge are used interchangeably. Intellect comprises perception, memory, recognition, conceptualization, convergent and divergent reasoning (creativity and classification), verbal facility and motor competence. There is noticeable deficiency in motor, cognitive, social, and language functions. Mentally challenged child is complicated by physical and emotional problems. The child may also have difficulty with hearing, sight or speech, which can lower the child's quality of life. Mentally challenged children at homes are lifelong pressure for parents. Though a life-long condition, however, in most individuals, those parts of the brain that are not damaged continue to develop. Therefore, they continue to acquire skills and abilities as they grow older. Proper handling, training and treatment can make them to live self-sufficiently. Although attention to their disabilities is important, paramount is their need to early stimulation interventions, health care and education. (Lalitha, 2009)
2
to arouse the child's interest, guiding the hands to manipulate things and so on. Sensory stimulation during childhood enhances the intellectual functioning and learning skills in children. Children with developmental delay need it all the more, because they are prone to under stimulation. (Cooper, 2010)
NEED FOR THE STUDY
The World report on disability, 2014 reveals that of the more than one billion people in the world who are disabled, 110-190 million encounter significant difficulties in their daily lives. It is a shocking and alarming fact that approximately 2.5 to 3% of the total population are mentally challenged which in most cases is a lifelong condition. In surveys of the general population in India among people of all ages, it has been found that around 2% are mentally challenged. In other words, in a village of 1000 people, 20 people are mentally challenged. Only in children, (under 18 years of age) there will be about 3% of cases with mental retardation. Mild mentally challenged are much more common than severe mentally challenged, accounting for 65 to 75% of all cases, who are considered the educable and trainable. (WHO, 2013)
A community-based cross-sectional study carried out in 2013, in selected villages in the state of Tamilnadu in India, showed that the overall prevalence of mental disability was 2.3%. It is estimated that by 2020, 15% of the disability-adjusted life-years (DALYs) lost would be due to mental and behavioral disorders. The life time prevalence of developing one or more mental and behavioral disorders is estimated to be 25%.Limitations in both understanding hazards and coping with environmental challenges causes increased injury risk in this population. The incidence of unintentional injuries among mentally challenged children has been shown to be twice that of normal children. Avoidance of exposure to injury hazards entails a superior cognitive function to that of recognition alone. Mentally challenged have limited capacity for these functions, therefore their higher injury risk is not unexpected. It is important to train the mentally challenged child in all the possible ways and teach him how to survive and progress in the world. (Daisy, 2013)
3
injuries, in these children. Specific stimulation of the primary senses in an environment that excludes all extraneous stimulation makes perception and interpretation of sensations easier for children. (Mary.C.Townsend)
The reported benefits of sensory stimulation therapy includes positive changes in sensory perception, improved task concentration, an increase in a variety of skills such as awareness of self, social interaction sensory perceptions, communication, exploration and manipulation of stimuli, relaxation, a reduction in stereotypic self-stimulatory sensory perceptions and an increase in adaptive sensory perceptions such as exploratory sensory perception or initiating contact with others. The experience of doing something positive and spending ‘quality time’ with a patient serves to raise staff morale and reduce staff burn-out. It provides an opportunity for carers to focus on the preferences of patients and legitimises spending time with them. Thus sensory interventions can play a role in nursing care and treatment. (Symington, 2013)
Since the existing research is promising with positive effects on the clients in mental health care, caregivers and staffs; the student researcher felt the need for the respective title of study.
STATEMENT OF THE PROBLEM
Effectiveness of sensory stimulation technique on sensory perceptual ability and emotional well-being on mentally challenged children attending a selected special School, Dindigul.
OBJECTIVES OF THE STUDY
1. To assess the level of sensory perception and emotional wellbeing among mentally challenged children before and after administering sensory stimulation technique among experimental and control group.
2. To determine the effectiveness of sensory stimulation technique on sensory perception and emotional wellbeing among experimental group.
3. To compare the level of sensory perceptual ability and emotional wellbeing among both experimental and control group.
4
HYPOTHESIS
H1: There will be significant difference between the post-test score of sensory
perception in experimental and control group among mentally challenged children.
H2: There will be significant difference between the post-test score of emotional
well-being in experimental and control group among mentally challenged children.
H3: There will be a significant association between the level of sensory perception and
their selected demographic variables in experimental group and control group among mentally challenged children.
H4: There will be a significant association between the level of emotional well-being
and their selected demographic variables in experimental group and control group among mentally challenged children.
OPERATIONAL DEFINITION
Effectiveness: refers to the improvement in the level of motor activity among moderate mentally challenged children after providing the sensory stimulation technique
Mentally Challenged Children: Children with IQ range which is found to be moderate mentally challenged (IQ level in between 35-50) or below and deficit in functional sensory perception were considered as mentally challenged children.
Sensory: The passive process of bringing information from the outside world into the body and to the brain.
Perception: It is the active process of selecting, organizing, and interpreting the information brought to the brain by the senses
Sensory stimulation: The process of stimulating the senses of the child, through auditory (playing music recordings), visual (balls of multi colours), tactile (different textured clothes), olfactory (aromas) and gustatory methods (sweet candy) for 15 minutes twice a day for 5 times in a week, for 4 weeks.
5
Well being: A good or satisfactory condition of existence; a state characterized by health, happiness, and prosperity; welfare
ASSUMPTIONS
The study assumes that:
1. Mentally challenged children may have low sensory perception.
2. The sensory stimulation may improve the sensory perception on mentally challenged children.
DELIMITATIONS OF STUDY
The study is delimited to,
Mentally challenged children with the age group of 5-14 years
Living in hostel at selected special school.
Willing to participate in the study
6 | P a g e
CHAPTER II
REVIEW OF LITRATURE
PART-A
The task of reviewing literature involves the identification of selection of critical analysis and reporting on the particular problem that has been chosen for the study.
The review of literature is presented under the following subdivisions
Literature related to:
1. Literature related to sensory stimulation techniques.
2. Literature related to sensory stimulation techniques and mentally challenged children.
3. Literature related to mentally challenged children and emotional well-being.
Literature related to sensory stimulation techniques
Binu john (2012) He conducted a study in the stages special school at Mangalore. The group consisted 40 mentally challenged children with sensory and emotional problems of age 5-15 years. Among these 40 children’s were selected with simple random sampling by lottery method without replacement. The sensory stimulation technique was given this group for 30 days on 31stday the post test was done. The result show that the
paired `t` value is 11.7 for sensory perceptual ability and 9.3 is for emotional well-being
7 | P a g e Baranek and Berkson (2010), there are varying views about the processes of tactile defensiveness that include an imbalance in inhibitory responses, differing neurological thresholds or limbic system involvement. They also found a possible explanation for behavioural responses in children who met the criteria for tactile defensiveness in that they may have lower thresholds explaining the child’s responses to tactile stimuli. This would mean that gentle touch for a child with tactile defensiveness may influence his/her response to include negativity, withdrawal or avoidance to stimulation.
Holling H. et., (2010) conducted a study to assess the sensory perceptional problems among mentally challenged children and adolescents in united kingdom. The study group was 14478 children and adolescents aged 3-17. They found that the most prevalent problematic among mentally challenged children’s are sensory perceptional problems (g=11.9%,b=17.9%) emotional problem (g=4.8%, b=10.8%).
Atten disord J. et (2010), revealed that, measuring the teacher attitude and expectations toward mentally challenged children’s and development of the test of knowledge about sensory problems. The attitudes, expectations, and behaviors of teacher toward mentally challenged children’s may have a lasting impact on the academic self-efficacy. This psychometric approach was utilized to reduce pattern of response disortions that produce systematic errors in direct attitudinal assessment.
Garcia- castellar. R. et al (2009) conducted a study to find out the interactions of mentally challenged children with sensory problems at school: specifically the socio-metric status and the feature of rejected children. 23 children from primary school (2nd to 5th degree) of castell on were examined, using socio metric tasks and sensory perception
scales for mentally challenged children’s socio metric tasks shows that the children were preponderantly rejected by their school mates, and the reason were low in sensory perception level and behaviour.. Our finding established the severity of sensory problems in these children at school.
8 | P a g e
a range of affect from neutral to extreme fear. Postural responses were proposed as normal to stiff and rigid body movements upon presentation of the movement activity. May-Benson and Koomar’s work was related to gravitational insecurity (vestibular over-responsivity), however, based on clinical experience, these behaviours may be observed in other types of over-responsivity as well. It is anticipated that children with over-responsivity will have escape-based behaviours, and these will be observed through a child’s avoidance, emotional, and postural responses when presented with sensory intensive play that is part of sensory-based interventions incorporating movement and/or touch
Philaithis. A, et al (2010) conducted a prevalence study of mentally challenged children, Greece the study combined information from both parents and teacher for 1708 special school children attending the first grade in 101 classes of 55 special schools. Result show that both questionnaires were completed for 1285(75.2%) children. Among them, 84 children met the criteria for sensory perception problems. The estimated prevalence was 8.8% for boys and 4.2% for girls no significant differences were observed regarding urban, semi-urban or rural residents.
Miller et al. (2012) children with Sensory Over-Responsivity may present with particular behaviours more quickly and with greater intensity than those children who have typical responses to sensory intensive play. Observed problematic behaviours include negativity, impulsivity, aggression, avoidance, and withdrawal
Geraffinoos .y. et al (2008), examined the general practice of pedagogic management by teachers of special school children in the class room. Despite the importance of the schools do not have sufficient knowledge about the foundations and principles of treatment concerning sensory problems nor do they receive adequate training how to deal with sensory related problem in the class room. The result revealed that there is a significant lack of cooperation between schools, parents and the therapeutic institutions inhibiting a multimodal treatment.
2. LITERATURE RELATED TO SENSORY STIMULATION
TECHNIQUES AND MENTALLY CHALLENGED CHILDREN:
9 | P a g e
emotion. This single case study investigated the effectiveness of sensory stimulation techniques with a 5 year old male. Sensory stimulation techniques focused on pre activities using three media. The pre/post-test measurement tool was the formal elements sensory stimulation techniques scales (FEATS) (Gantt & Tabone, 1998). The setting is Michael’s school day, France. Result indicated an increase in sensory perceptions level after techniques given. A sensory stimulation technique was found to be a useful intervention.
Arnold (2009), stimulant medication (amphetamine and methylphenidate) with sensory stimulation techniques are the best-documented treatments for mentally challenged children, but their short pharmacokinetic and sensory perception half-lives have historically produced irksome time-course effects. This article summarizes clinical principles that physicians may find useful in managing this sensory stimulation treatment armamentarium.
Vargas and Camilli (2010) performed ameta-analysis of studies that compared sensory integration with no treatment; sensory integration with alternative treatments; and sensory integration, no treatment, and alternative treatments. After measuring and weighing effect sizes, these authors stated that sensory integration was not shown to be any more effective than alternative treatments with respect to identified outcomes (i.e., psycho educational, behaviour, language, motor, and sensory perceptual skills). However, in their critique, Vargas and Camille did not identify what was considered to be alternative treatments. While there is much research to be done in sensory integration, there is evidence that suggests sensory integration is effective. The conclusion is that sensory integration, at this time, is not proven nor disproven from an empirical perspective
Gold, (2010) he conducted the preliminary study compared the daily living skills of children with sensory stimulation techniques and without mentally challenged children’s, and the influence of a social skills training group on these skills. The result emphasizes the need for a focus upon occupation in assessment and treatment of children with sensory perception problem.
10 | P a g e
perception children. Three case reports emphasize the wide variation of clinical problems presented by this frequently occurring disorder of childhood. Epidemiology, differential diagnosis, associated features, neurobiological mechanism, treatment long-term outcome, sensory problems in children’s are addressed. Although medication is an important tool in the treatment of this condition, follow-up studies confirm the importance of art intervention approach.
Kimball (2011) A study was conducted in Korea to evaluate the effectiveness of a multisensory intervention on the physical growth and health of orphaned infants with experimental group (n=28) and control group (n=30). In addition to receiving the routine orphanage care, infants in the experimental group received 15 minutes of auditory (female voice), tactile (massage), and visual (eye-to-eye contact) stimulation, twice a day, 5 days a week, for 4 weeks. That resulted in significantly fewer illnesses as well as significant gains in weight, length and head circumference, after the 4-week intervention period and at 6 months of age
Smitheman-brown, v.,& church, R.P.(2007) facilitating creative growth in mentally ill children with sensory problems and it using a single-subject, multiple-baseline research design , this study investigates the creative growth and sensory perception changes precipated by the work done in sensory stimulation techniques through employment of the mandala as an active centring device with children(N=8:4 experimental and 4 control , ages 10-13) was rated according to the guidelines of the formal elements. Sensory stimulation techniques scales (FEATS) (Gantt & tabone, 2000). Preliminary findings indicate that the mandala exercise has the effect to increasing attentional abilities and decreasing impulsive sensory perceptions overtime, allowing for better decision making, completion of task, growth in developmental level, and an interest in personal aesthetics.
C. Literature related to mentally challenged children and emotional well
being
11 | P a g e
mental health. The elements like fostering of hope, creating a sense of meaning and purpose, developing new coping mechanism and rebuilding identifies.
Waller D (2010) started that aim of sensory stimulation techniques is to facilitate positive change through engagement with the therapist and the emotional wellbeing in a safe environment. This study explored how sensory stimulation techniques is used to help children with emotional, developmental and sensory perception problem and how change occur during the process of physical involvement with the materials through the making of a significant through sublimation of feelings into the images and through communication with the therapist .
David Soel, (2010) conducted a study to assess the emotional problems among mentally challenged children and adolescents in united kingdom. The study group was 1456 children and adolescents aged 3-17. They found that the most prevalent problematic among mentally challenged children’s are sensory perception problems (g=11.9%, b=17.9%) emotional problem (g=4.8%, b=10.8%).
12 | P a g e
PART-B
CONCEPTUAL FRAME WORK
Conceptual models are made up of concepts, which are words describing mental images of phenomena and propositions which are statements about concepts. It provides a schematic representation of some relationship among phenomena.
Ernestine Wiedenbach’s proposed a prescriptive theory for nursing which is described as conceiving of a desired situation & the ways to attain it.
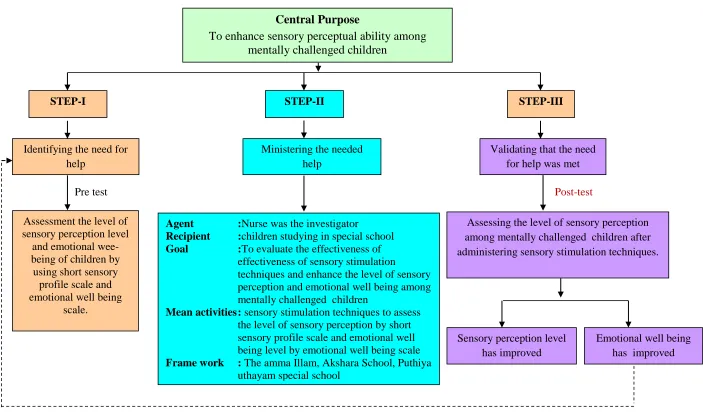
The investigator adopted the Wiedenbach’s Theory of helping art of clinical nursing 1964, for Conceptual Framework, According to this theory, nursing practice consists of 3-steps which include.
Step-I Identifying the need for help Step-II Ministering the needed help
Step-III Validating that the need for help was met.
This theory shows nursing as an art based on a goal (or) central purpose. It consists of 3 factors central purpose, prescription & realities.
Step–I: Identifying the need for help
This involves determining the need for help. The investigator identified the level of sensory perception and emotional well-being among mentally challenged children by using short sensory profile and emotional well-being scale.
Step–II: Ministering the needed help
The provision of required help for the identified need. It has 2 components (i) Central purposes
(ii) Prescription (iii) realities
i. Central purpose
13 | P a g e ii. Prescription
It involves the plan of care to achieve the purpose. In this study investigator administered sensory stimulation techniques for 10 minutes twice a day, at 9 am in morning and 7 pm in evening for 21 days.
iii. Realities
The five realities identified by Wiedenbach’s are agent, recipient, goal, mean activities and framework.
Agent : The investigator is the agent.
Recipient : mentally challenged children (60 samples)
Goal : To improve the sensory perceptual ability and emotional wellbeing.
Mean Activities : Administration of sensory stimulation techniques.
Framework : Amma illam, puthiya uthayam, akshara special school.
Step-III: Validating that the need for help was met
14 | P a g e
Figure – 1: Theoretical Framework Based on Wiedenbach’s Helping Art Model for Clinical Practice
Central Purpose
To enhance sensory perceptual ability among mentally challenged children
Ministering the needed help
Assessing the level of sensory perception among mentally challenged children after administering sensory stimulation techniques. Identifying the need for
help
Validating that the need for help was met
STEP-III
Sensory perception level has improved
Post-test
STEP-II
Assessment the level of sensory perception level
and emotional wee-being of children by
using short sensory profile scale and emotional well being
scale.
Agent :Nurse was the investigator
Recipient :children studying in special school
Goal :To evaluate the effectiveness of effectiveness of sensory stimulation
techniques and enhance the level of sensory perception and emotional well being among mentally challenged children
Mean activities : sensory stimulation techniques to assess the level of sensory perception by short sensory profile scale and emotional well being level by emotional well being scale
Frame work : The amma Illam, Akshara School, Puthiya uthayam special school
Emotional well being has improved
STEP-I
15 | P a g e
CHAPTER III
RESEARCH METHODOLOGY
The research methodology indicates the general pattern of organizing the procedure for gathering valid and reliable data for an investigation. This chapter provides a brief description of the method adopted by the investigator in this study. It includes the research approach, research design, setting of the study, population, sample, sample size, sampling technique, description of the tool, pilot study, data collection procedure and plan for data analysis
RESEARCH APPROACH
Quantitative evaluate approach was used in this study to assess the Effectiveness of sensory stimulation technique on sensory perceptual ability and emotional well-being on mentally challenged children attending a selected special school
RESEARCH DESIGN
A quasi experimental pre and post-test control group design is selected for the study to assess the effectiveness of sensory stimulation technique on sensory perceptual ability and emotional wellbeing among mentally challenged children at selected special school.
The study uses quasi experimental,
Group Pre-test Intervention Post-test
Experimental group O1 X O2
16 | P a g e
Research Approach
Quantitative evaluate Research Approach
Research Design
A quasi experimental pre and post-test control groupdesign
Population
Mentally challenged children at selected special school
Setting
Akshara school, Amma Illam, Puthiya Uthayam Special
School Sampling
Technique
Purposive Sampling Technique
Sample
Mentally challenged children who fulfills the inclusion criteria
Data Collection Procedure
Pre-test Pre-test
Intervention
Sensory stimulation techniques
Post test
Sample size
60
Experimental Group
30 Mentally challenged children
Post test
Control Group
30 Mentally challenged children
Tool
Short sensory profile Emotional well-being scale
Data Analysis and Interpretation
17 | P a g e Key:
O1 - Pre assessment of the level of sensory perception and emotional well-being among mentally challenged children
X - Sensory stimulation technique
O2 - Post assessment of the level of sensory perception and emotional well-being among mentally challenged children
VARIABLES
Dependant Variables In this study dependent variables sensory perception and emotional well-being, sensory stimulation techniques.
Independent Variables In this study independent variables age, gender, birth order, religion, duration of stay, education level of care givers, education.
SETTING
This study was conducted in selected special schools namely 1.Akshara school, 2.Amma Illam, 3.Puthiya uthayam. Dindigul, Dindigul Dist.
POPULATION
The study population consists of all the mentally challenged children and care givers in to the special school at Dindigul.
ACCESSIBLE POPULATION
It refers to the aggregate of cases which conform to the designed criteria and which is accessible to the researcher as the pool of subjects or objects. In this study accessible was , to assess the problem of children with mental retardation, among 5-14 years.
SAMPLE & SIZE
18 | P a g e
Akshara school, Puthiya Uthayam were the study sample. The total sample size was 60, 30 in the experimental group and 30 in the control group.
SAMPLING TECHNIQUE
Sampling is the important step in research process .it is the process to selecting representatives units of subset of a population of the study. Purposive sampling technique was used for this study.
CRITERIA FOR SELECTION OF SAMPLES
Inclusion Criteria:
Mentally challenged children aged between 5-14 years
Mentally challenged children of both gender
Mentally challenged children who were co-operative.
Mentally challenged children who are in different phase of training program
Exclusion Criteria:
Children with autism and visual disability.
Children who are aggressive.
Mental retardation associated with other mental disorder.
DESCRIPTION OF TOOLS
The research tool was developed by doing extensive literature reviews the primary and secondary source of literature were to develop and appropriate tool.
Tool consists of three sections:
Section I: DEMOGRAPHIC DATA
The demographic data consists of code no, age, sex, birth,, type of marriage of their parents and subject handling.
Section II: SHORT SENSORY PROFILE
19 | P a g e
sensitivity, 4 items are taste/smell sensitivity ,3 items are movement sensitivity ,7 items are under responsive/seeks sensation,6 items are auditory filtering, 6 items are low energy/weak, 5 items are visual/ auditory sensitivity. The rating scale was given to assess the sensory perception level of mentally challenged children.
VALIDITY:
Validity of the tool was obtained on the basis of nursing experts and medical experts in the field of psychiatric nursing. The tool was found to be validated and widely accepted as a standardized tool.
RELIABILITY:
Reliability of the tool to assess the effectiveness of sensory stimulation techniques was established using test – retest method. The rank correlation coefficient was used to calculate the reliability and this was found to be r= 0.83. It was considered reliable for preceding the study.
SCORE INTEPRETATION
The interpretation of scoring is graded as follows;
1 Indicate Always, 2 Indicate Frequently, 3 Indicates Occasionally, 4 Indicate Seldom, 5 Indicates Never.
Scoring Range
20 | P a g e
Section II: EMOTINAL WELL-BEING SCALE
It was a non- standardized tool. It is simple well laid out consists of 16 items .the rating scale is helpful to assess the emotional well-being level of mentally challenged children.
SCORE INTEPRETATION
The interpretation of scoring is graded as follows;
1 Indicate Always, 2 Indicate Frequently, 3 Indicates Occasionally 4 Indicate Seldom, 5 Indicates Never.
Scoring Range
For each item the scoring was given as follows 16-36 indicate mild emotional well-being. 37-61 indicate moderate emotional well-being. 62-80 indicate high emotional well-being.
PILOT SUDY
The pilot study is a small preliminary investigation of the same general character as the major study, which is designed to acquaint the researcher with problems that can be corrected in preparation for the large research projects or is done to provide the researcher with an opportunity to try the procedures for collecting data (daisy, 2012).
21 | P a g e
The data related to demographic variables were collected from the client. Pre-test level of sensory perceptual ability of mentally challenged children was assessed by using SHORT SENSORY PROFILE scale and emotional well-being was assessed by using EMOIONAL WELL BEING SCALE. From the experimental and control group. A sensory stimulation technique was given to 3 samples in the experimental group for 2 weeks . The control group was instructed to maintain their current level of activities. At the end, post-test level of sensory perceptual ability of mentally challenged children was assessed by using SHORT SENSORY PROFILE scale and emotional well-being was assessed by using emotional well-being scale. The results of the pilot study showed a favourable response. There were no practical difficulties met by the investigator and the tool was considered to be reliable and appropriate. Hence the same procedure was decided to be followed in the main study.
DATA COLLECTION PROCEDURE
Written permission was obtained from the Mr. Mathivanan District disability officer Dindigul, Akshara school, Amma illam,Puthiya uthayam special school. Self-introduction was given and details regarding the nature of the study were explained to the special school.
The selected samples were approached with study questionnaire and the level of sensory perceptual abilities and emotional well-being was identified. Sensory stimulation techniques was given and were encouraged to be continued for 25 consecutive days. At the end of 25 days of inducing the sensory stimulation techniques, the level of sensory perception and emotional well-being of the study subjects were reassessed, and the differences in score of test was considered as the effectiveness of sensory stimulation techniques.
SCHEDULES FOR DATA COLLECTION PROCEURE S.
No Time Name of the place
Number
of subject Pre test Intervention Post test
1 10am -11am
Akshara, Amma Illam, Puthiy Uthayam special
school
60 1-06-2016 2-6-2016 to
22 | P a g e Time spent to assess the sensory perception level and emotional well-being among
mentally challenged children was 12 minutes approximately.
Sensory stimulation techniques was given and was encouraged. The time spent was 20 minutes in the morning.
A period of 25 days continuously given for the subjects and to continuing the sensory stimulation techniques after the test the level sensory perception and emotional well-being was reassessed (post-test).
DATA ANALYSIS
Description statistics Frequency and percentage distribution of sample according to demographic variables of mentally challenged children’s.
Mean and SD of pre-test and post-test level of sensory perception score among mentally challenged children.
Mean and SD of pre-test and post-test level of emotional well- being score among mentally challenged children.
Inferential Statistics
Paired T test to compare pre-test and post-test level of sensory perception among mentally challenged children.
Chi- square test to find out the association of post-test level of sensory perception among mentally challenged children.
PROTECTION OF HUMANRIGHTS
23 | P a g e
CHAPTER IV
DATA ANALYSIS AND INTERPRETATION
This chapter deals with analysis and interpretation of data to study the effectiveness sensory stimulation techniques on sensory perceptual ability and emotional wellbeing among mentally challenged children.
ORGANIZATION OF DATA
Section A: DEMOGRAPHIC VARIABLES
a) Demographic variables with regard to the mentally challenged children’s.
Section B: Level of sensory perception and emotional well-being on mentally challenged children in pre-test and post test
Section C: Mean and SD of pre-test and post-test level of sensory perception and emotional well-being among mentally challenged children.
24 | P a g e
Table 1: Frequency and Percentage distribution of Demographic Variable
S.
No Demographic Characteristics
Experimental group
Control group
f % f %
1 Age a)5-7 years b)8-10 years c)11-14 years 6 13 11 20 43 37 8 11 11 27 37 36
2 Gender a)Male
b)Female 24 6 80 20 23 7 77 23 3 Birth Order a) First
b) Second
c) Third & above
22 7 1 73 24 3 13 12 5 43 40 17 4. Religion a) Hindu
b) Muslim c) Christian 21 4 5 70 13 17 19 3 10 63 10 27 5. Education Level of
Care giver a) Illiterate b) Primary c) Secondary d) Graduate 6 6 7 7 20 20 30 30 5 8 9 8 17 27 30 26 6. Type of Stay a)Hostel
b) Days Scholar
12 18 40 60 12 18 40 60 7 Education level a) Pre-primary
b) Primary c)Upper Primary
6 16 8 20 53 27 8 12 10 27 40 33 8 Duration Of stay a) Below 12 month
b) 12month and above
15 15 50 50 14 16 47 53 9 Mode of Delivery a) Normal
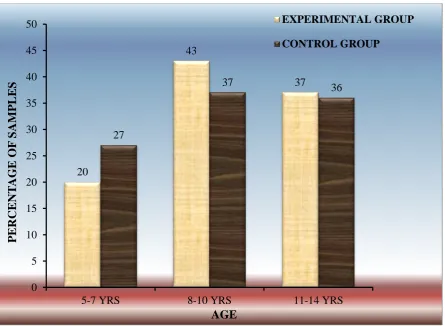
25 | P a g e Table 1: A study reveals that in experimental group 6(20%) of the samples were in the age group of 5-7 years, majority 13(43%) of samples belonged to the age group of 8-10 years, 11(37%) belonged to age group 11-14 years. In the control group 8(27%) of the samples were in the age group of 5-7 years majority 11(37%) of samples belonged to the age group of 8-10 years, 11(36%) belonged to age group 11-14 years.
Regarding the gender status 24(80%) of the samples were male and 6(20%) of the samples were female in the experimental group. In the control group 23(77%) of the samples were male and 7(23%) of the samples were female.
Regarding birth order 22(73.3%) of the samples were first, 7(24%) of the samples are second, 1(3%) of the samples were third and above in the experimental group. In the control group 13(43%) of the samples were first, 12(40%) of the samples are second, 5(17%) of the samples were third and above.
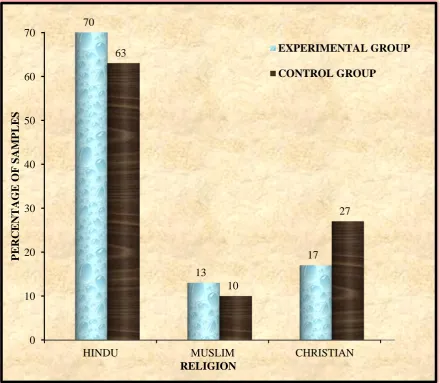
Regarding the religion 21(70%) of the samples were Hindu, 4(13%) of the samples are Muslim, 5(17%) of the samples were Christian in the experimental group. In the control group 19(63%) of the samples were Hindu, 3(10%) of the samples are Muslim, 10(27%) of the samples were Christian.
With educational level of care giver, 6(20%) of the samples were Illiterate, 6(20%) of the samples had primary education, 7(30%) of the samples had secondary education and 7(30%) of the samples were graduates in the experimental group. In the control group, 5(17%) of the samples were Illiterate, 8(26.7%) of the samples had primary, 9(30%) of the samples had secondary and 8(26%) of the samples were graduates.
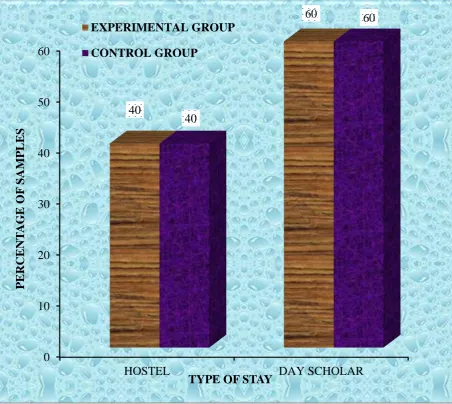
Regarding the type of stay 12(40%) of the samples were hostel and 18(60%) of the samples were days scholar in the experimental group. In the control group 12(40%) of the samples were hostel and 18(60%) of the samples were days scholar.
26 | P a g e
Regarding the duration of stay 15(50%) of the samples were below 12 month and 15(50%) of the samples were above 12 month in the experimental group. In the control group 14(47%) of the samples were below 12 month and 16(53%) of the samples were above 12 month.
27 | P a g e
SECTION-A
Frequency and percentage distribution of the sample according to their
demographic variables
Fig (3) Frequency and Percentage Distribution of Age among mentally
challenged children’s
20
43
37
27
37 36
0 5 10 15 20 25 30 35 40 45 50
5-7 YRS 8-10 YRS 11-14 YRS
P
E
RC
E
NT
AG
E
OF
S
AM
P
L
E
S
AGE
EXPERIMENTAL GROUP
[image:46.595.92.538.184.510.2]28 | P a g e
Fig (4.) Frequency and Percentage Distribution of Gender among
mentally challenged children
0 10 20 30 40 50 60 70 80
MALE FEMALE 80
20 77
23
P
E
RC
E
NT
AG
E
OF
S
AM
P
L
E
S
GENDER
[image:47.595.93.539.158.529.2]29 | P a g e
Fig (5.) Frequency and Percentage Distribution of birth order among
mentally challenged children.
0 10 20 30 40 50 60 70 80
FIRST SECOND THIRD AND ABOVE 73
24
3 43
40
17
P
E
RC
E
NT
AG
E
OF
S
AM
P
L
E
S
BIRTH ORDER
[image:48.595.93.545.156.570.2]30 | P a g e
Fig (6) Frequency and Percentage Distribution of education among
mentally challenged children’s
0 10 20 30 40 50 60
PRE-PRIMARY PRIMARY UPPER-PRIMARY 20
53
33 27
40
33
P
er
ce
n
tage
of
S
am
p
les
EDUCATIONAL LEVEL
[image:49.595.94.551.155.573.2]31 | P a g e
Fig(7) Frequency and Percentage Distribution of type of stay among
mentally challenged children’s.
0 10 20 30 40 50 60
HOSTEL DAY SCHOLAR 40
60
40
60
P
E
RC
E
NT
AG
E
OF
S
AM
P
L
E
S
TYPE OF STAY EXPERIMENTAL GROUP
[image:50.595.96.549.163.567.2]32 | P a g e
Fig (8) Frequency and Percentage Distribution of educational level of
care giver among mentally challenged children’s.
0 5 10 15 20 25 30
NON-ILLITERATE PRIMARY SECONDARY GRADUATE
20 20
30 30
17
27
30
26
P
ERC
ENT
A
G
E
OF
SAM
P
LE
S
EDUCATIONAL LEVEL OF CARE GIVER EXPERIMENTAL GROUP
[image:51.595.96.545.160.570.2]33 | P a g e
Fig (9.)Frequency and Percentage Distribution of duration of stay
among mentally challenged children’s.
44 45 46 47 48 49 50 51 52 53
BELOW 12 MONTH 12 MONTH AND ABOVE
50 50
47
53
P
E
R
C
E
N
T
A
G
E
O
F
SA
MP
L
E
S
DURATION OF STAY EXPERIMENTAL GROUP
[image:52.595.91.542.158.567.2]34 | P a g e
Fig 10) Frequency and Percentage Distribution of mode of delivery
among mentally challenged children’s.
0 10 20 30 40 50 60 70 80
NORMAL CESAERIAN VACUMM 73
17
10 63
27
10
P
E
R
C
E
N
T
A
G
E
O
F
SA
MP
L
E
S
MODE OF DELIVERY
EXPERIMENTAL GROUP
[image:53.595.89.541.157.550.2]35 | P a g e
Fig (11) Frequency and Percentage Distribution of religion among
mentally challenged children’s.
0 10 20 30 40 50 60 70
HINDU MUSLIM CHRISTIAN 70
13
17 63
10
27
P
E
R
C
E
N
T
A
G
E
O
F
SA
MP
L
E
S
RELIGION
EXPERIMENTAL GROUP
[image:54.595.99.540.165.548.2]36 | P a g e
SECTION B:
Table 2: Assess the pre test and post test level of sensory perceptual ability
among mentally challenged children’s in experimental and control group.
Score Interpretation
Experimental group n=30 Control group n=30 Pre test Post test Pre test Post test
f % f % f % f %
Typical Performance (190-155)
-- -- 4 13.3 -- -- -- -- Probable Difference
(154-142)
8 26.7 14 46.7 7 23.3 8 26.7 Definite Difference
(141-38)
22 73.3 12 40 23 76.7 22 73.3
[image:55.595.69.547.164.405.2]37 | P a g e
Fig (12) Pre Test Score Level on Sensory Perception of Both
Experimental and Control Group.
0 5 10 15 20 25
TYPICAL
PERFORMANCE PROBABLE
DIFFERENCE DEFINITE DIFFERENCE 0
26.7
73.3
0
23.3
76.7
P
ERC
ENT
A
G
E
OF
SAM
P
LE
S
[image:56.595.95.550.157.554.2]38 | P a g e
Fig(13) Post Test Score Level on Sensory Perception of Both
Experimental and Control Group
[image:57.595.91.546.156.538.2]39 | P a g e
Table 3: Assess the pre-test and post-test level of emotional well-being among
mentally challenged children’s in experimental and control group.
Score Interpretation
Experimental group n=30 Control group n=30 Pre test Post test Pre test Post test
f % f % f % f %
Mild Emotional Well-Being
(16-36)
5 16.7 16 53.3 7 23.3 7 23.3
Moderate Emotional Well-Being
(37-61)
25 83.3 14 46.7 23 76.6 23 76.6
High Emotional Well-Being
(62-80)
-- -- -- -- -- -- -- --
40 | P a g e
Fig(14) Pre Test Score of Emotional Well Being of Both Experimental
Group and Control Group
0 10 20 30 40 50 60 70 80 90
MILD EMOTIONAL WELL BEING
MODERATE EMOTIONAL WELL BEING
HIGH EMOTIONAL WELL BEING
[image:59.595.96.549.166.508.2]41 | P a g e
Fig(15) Post Test Score of Emotional Well Being of Both Experimental
Group and Control Group
[image:60.595.91.547.156.520.2]42 | P a g e
Table 4: Mean pre-test and post-test level of sensory perceptual ability
among mentally challenged children in experimental group.
Measurement Mean SD Mean
difference
SD difference
Paired ‘t ’value
Pre test 104.7 24.2
8.1 4.4
18.6*** S(p<0.001) Post test 96.8 20.6
.
Table: 4 Represents effectiveness of sensory stimulation techniques on sensory perceptual ability among mentally challenged children in experimental group before and after the intervention.
[image:61.595.83.534.131.252.2]43 | P a g e
Fig (16) Mean pre-test and post-test level of sensory perceptual ability
among mentally challenged children in experimental group.
0 5 10 15 20 25 30 35 40
MEAN SD
38.4
8.3 37.6
8.2
PE
R
C
E
N
T
A
G
E
O
F
SA
MPL
E
S
EXPERIMENTAL GROUP
[image:62.595.91.540.128.517.2]44 | P a g e
Table 5: Mean pre-test and post-test level of sensory perceptual ability
among mentally challenged children in control group.
Measurement Mean SD Mean
difference
SD difference
Paired ‘t ’value
Pre test
103.6
23.4
0.4
0.1
3.4***
S(p<0.001)
Post test
103.2
23.3
Table: 5 Represents effectiveness of sensory stimulation techniques on sensory perceptual ability among mentally challenged children in control group before and after the intervention.
[image:63.595.84.531.131.265.2]45 | P a g e
FIG (17) Mean pre-test and post-test level of sensory perceptual ability
among mentally challenged children in control group.
0 5 10 15 20 25 30 35 40
MEAN SD
38.4
8.3 37.6
8.2
PE
R
C
E
N
T
A
G
E
O
F
SA
MPL
E
S
EXPERIMENTAL GROUP
[image:64.595.91.548.157.526.2]46 | P a g e
Table 6: Mean pre-test and post-test level of emotional well-being
among mentally challenged children in experimental group.
Measurement Mean SD Mean
difference
SD difference
Paired ‘t ’value
Pre test
41.2
8.1
9.2
2.2
6.1***
S(p<0.001)
Post test
32.0
6.3
Table 6 represents effectiveness of sensory stimulation techniques on emotional well-being among mentally challenged children in experimental group before and after the intervention.
[image:65.595.83.532.162.309.2]47 | P a g e
Fig (18) Mean pre-test and post-test level of emotional well-being among
mentally challenged children in experimental group.
0 5 10 15 20 25 30 35 40
MEAN SD
38.4
8.3 37.6
8.2
PE
R
C
E
N
T
A
G
E
O
F
SA
MPL
E
S
EXPERIMENTAL GROUP
[image:66.595.91.539.157.495.2]48 | P a g e
Table.7 Mean pre-test and post-test level of emotional well-being among
mentally challenged children in control group.
Measurement Mean SD Mean
difference
SD difference
Paired ‘t ’value
Pre test
38.4
8.3
0.8
0.1
1.3***
S(p<0.001)
Post test
37.6
8.2
Table 7: represents effectiveness of sensory stimulation techniques on emotional well-being among mentally challenged children in control group before and after the intervention.
49 | P a g e
Fig (19) Mean pre-test and post-test level of emotional well-being among
mentally challenged children in control group.
0 5 10 15 20 25 30 35 40
MEAN SD
38.4
8.3 37.6
8.2
P
E
R
C
E
N
T
A
G
E
O
F
SA
MP
L
E
S
EXPERIMENTAL GROUP
PRE-TEST
[image:68.595.90.549.149.505.2]50 | P a g e
Table 8: Comparison of mean post-test sensory perceptual ability
among mentally challenged children between experimental group and
control group.
Measurement
Mean
SD
paired
‘t ’value
Experimental group
96.8
20.6
18.6
Significant
(P< 0.001)
[image:69.595.83.543.153.322.2]Control group
103.2
23.3
Table 8 Comparison of mean post-test sensory perceptual ability among mentally challenged children between experimental group and control group.
51 | P a g e
FIG (20) Comparison of mean post-test sensory perceptual ability
among mentally challenged children between experimental group and
control group.
0 5 10 15 20 25 30 35 40
MEAN SD
32
6.3 37.6
8.2
P
E
R
C
E
N
T
A
G
E
O
F
SA
MP
L
E
S
POST-TEST
EXPERIMENTAL GROUP
[image:70.595.91.544.173.536.2]52 | P a g e
Table 9: Comparison of mean post-test emotional well-being among
mentally challenged children between experimental group and control
group.
Measurement
Mean
SD
paired
‘t ’value
Experimental group
32.0
6.3
6.1
Significant
(P< 0.001)
Control group
37.6
8.2
Table 9 Comparison of mean post-test emotional well-being among mentally challenged children between experimental group and control group.
[image:71.595.84.544.154.373.2]53 | P a g e
FIG (21) Comparison of mean post-test emotional well-being among
mentally challenged children between experimental group and control
group.
0 5 10 15 20 25 30 35 40
MEAN SD
32
6.3 37.6
8.2
PE
R
C
E
N
T
A
G
E
O
F
SA
MPL
E
S
POST-TEST
[image:72.595.90.546.154.506.2]54 | P a g e
SECTION. C
Table 10 Association between post-test level of sensory stimulation techniques
on sensory perceptual abilities among mentally challenged children and selected demographic variables of samples of experimental group.
Demographic Variable Typical performance Probable difference Definite difference Chi- Square
df Table value Age a)5-7 years b)8-10 years c)11-14 years 1 1 2 2 7 5 3 4 5
1.4 4 ns 8.6 Marital status a)Male b)Female 3 1 12 2 9 3
0.5 2 ns 31.5 Religion a) Hindu b) Christian c) Muslim 2 1 1 10 2 2 9 2 1 1.1 4
ns 3.84
Duration of stay
a) Below 12 month b) 12 month and above
2 2 10 4 10 9
5.6 2 ns
31.5
Birth order
a)First b)Second
c)Third and above
1 2 1 11 3 - 10 2 - 0.5 2
ns 31.5
Education
a) Pre- primary b) Primary c) Upper-primary 2 1 1 4 5 5 10 2 - 8.9 4
55 | P a g e Education of care giver
a) Illiterate b) Primary c) Secondary d) Graduate 1 1 1 1 3 3 5 3 2 2 3 5 7.8 4
ns 8.6
Type of hostel
a)Hostel b)Days scholar 1 3 4 10 7 5
2.8 2 ns
3.15
Mode of Delivery
a)Nor