VALIDATED UV AND RP-HPLC METHODS FOR THE
SIMULTANEOUS ESTIMATION OF AMLODIPINE BESYLATE
AND INDAPAMIDE IN BULK AND TABLET DOSAGE FORM
Dissertation Submitted to
The Tamil Nadu Dr. M.G.R. Medical University
Chennai - 600 032.
In partial fulfillment for the award of Degree of
MASTER OF PHARMACY
(Pharmaceutical Analysis)
Submitted by
C.KUMAR
Register No: 26106125
Under the Guidance of
Prof. (Dr.) T. VETRICHELVAN, M. Pharm., Ph.D.
PRINCIPAL & HEAD
Department of Pharmaceutical Analysis
ADHIPARASAKTHI COLLEGE OF PHARMACY
(Accredited By “NAAC” with CGPA of 2.74 on a Four point Scale at “B” Grade)
2
CERTIFICATE
This is to certify that the research work entitled “VALIDATED UV AND
RP-HPLC METHODS FOR THE SIMULTANEOUS ESTIMATION OF
AMLODIPINE BESYLATE AND INDAPAMIDE IN BULK AND TABLET
DOSAGE FORM” submitted to The Tamil Nadu Dr. M.G.R Medical University in
partial fulfillment for the award of the Degree of the MASTER OF PHARMACY
(Pharmaceutical Analysis) was carried out by C. KUMAR (Register No. 26106125)
in the Department of Pharmaceutical Analysis under my direct guidance and
supervision during the academic year 2011-2012.
Place: Melmaruvathur Prof. (Dr.) T. VETRICHELVAN, M. Pharm., Ph.D., Date: Principal & Head,
Department of Pharmaceutical Analysis, Adhiparasakthi College of Pharmacy,
CERTIFICATE
This is to certify that the dissertation entitled “VALIDATED UV AND
RP-HPLC METHODS FOR THE SIMULTANEOUS ESTIMATION OF
AMLODIPINE BESYLATE AND INDAPAMIDE IN BULK AND TABLET
DOSAGE FORM”the bonafide research work carried out byC. KUMAR (Register No. 26106125)in the Department of Pharmaceutical Analysis,Adhiparasakthi College of Pharmacy, Melmaruvathur which is affiliated to The Tamil Nadu Dr. M.G.R.
Medical University under the guidance of Prof. (Dr.) T. VETRICHELVAN, M. Pharm., Ph.D.
Place: Melmaruvathur Prof. (Dr.) T. VETRICHELVAN, M. Pharm., Ph.D.,
Date: Principal & Head,
Department of Pharmaceutical Analysis,
Adhiparasakthi College of Pharmacy,
ACKNOWLEDGEMENT
I honestly acknowledge HIS HOLINESS ARULTHIRU AMMA and THIRUMATHI AMMA for their sacred blessings to perform and complete my project.
My heartful thanks to SAKTHI G.B. ANBALAGAN, Managing Trustee, Adhiparasakthi College of Pharmacy, Melmaruvathur for providing all the necessary
facilities to carry out this works.
I got inward bound and brainwave to endure experimental investigations in model analytical methods, to this extent, I concede my inmost special gratitude and thanks to Prof. (Dr.) T. VETRICHELVAN, M. Pharm., Ph.D., Principal and Head, Department of Pharmaceutical Analysis, Adhiparasakthi College of Pharmacy, for the active guidance, innovative ideas, creative works, infinite helps, indulgent and enthusiastic guidance, valuable suggestions, a source of inspiration where the real
treasure of my work.
I conceitedly take the dispensation to present my special wisdom of
thanks to Mrs. (Dr.) D. NAGAVALLI, M. Pharm., Ph.D., Professor, Mr. K. ANANDAKUMAR, M.Pharm., Associate Professor, Mrs. G. ABIRAMI,
M. Pharm., Assistant Professor and Miss. G. SANKARI, M. Pharm., Assistant Professor, Department of Pharmaceutical Analysis, for their persuasive support and timely lend a hand to complete this work.
I wish to thank lab technicians Mrs. S. KARPAGAVALLI, Mr. M. GOMATHI SANKAR and Mr. M. VIMALAN for their help throughout the
I am indeed thanks to the Librarian Mr. M. SURESH, M.L.I.S., for providing
all reference books, journals and to make this project a great success.
And my sincere thanks to Mr. G.K. SIVARAMAN M.Sc, M.B.A., Deputy General Manager of Apex Pharmaceuticals, Mr. K. SENTHILNATHAN B.PHARM., Scientist and Mr. H.NHENALD JOHN, M.Pharm., Research Associate 2, for encouragement and support for the successful completion of this work.
It’s the precise time for me to convey my profundity thanks to Mr. SARAVANAN, M.Pharm., Research associate for their support and suggestions
during my work.
A special word of thanks to my other lovable Friends and Juniors for their co-operation during the course of my work.
Finally yet importantly, I gratefully forward my affectionate thanks to my family members, especially my parents, brothers and sisters for their frequent prayers, which has sustained me a lot in the successful completion of my project work.
Above all I dedicate myself and my work to Almighty, who is the source of knowledge and for showering all his blessings and grace upon me.
Dedicated to
My Parents
&
CONTENTS
SECTION TITLE Page
No. 1. INTRODUCTION
1.1 Analytical Chemistry 1
1.2. Analytical Techniques 2
1.3. UV Spectroscopy 5
1.4. HPLC 19
1.5. ICH Guidelines For Analytical Method
Validation Parameters 30
1.6.System Suitability Tests Parameters 35
1.7.Basic Statistical Parameters 40
2. LITERATURE REVIEW
2.1. Drug profile 44
2.2. Reported methods 51
3. AIM AND PLAN OF WORK 61
4. MATERIALS AND METHODS
4.1. Materials 63
4.2. Methods 66
4.2.1. UV Spectrophotometric methods 66
4.2.2. Reverse Phase-HPLC method 72
5. RESULTS AND DISCUSSION
5.1. Derivative Spectrophotometric method 79
2 6. SUMMARY AND CONCLUSION
6.1. UV Spectroscopic methods 85
6.2 Reverse Phase-HPLC method 86
LIST OF FIGURES FIGURE
NO. SUBJECT
1. IR SPECTRUM OF AMLODIPINE BESYLATE
2. IR SPECTRUM OF INDAPAMIDE
3.
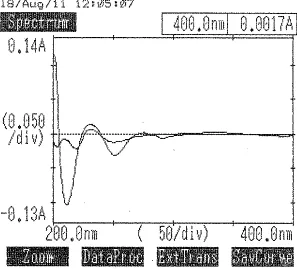
FIRST ORDER DERIVATIVE UV SPECTRUM OF AMLODIPINE BESYLATE IN METHANOL FOLLOWED BY BORATE BUFFER pH 8.0
4. FIRST ORDER DERIVATIVE UV SPECTRUM OF INDAPAMIDE IN METHANOL FOLLOWED BY BORATE BUFFER-pH 8.0
5.
OVERLAIN FIRST ORDER DERIVATIVE UV SPECTRA OF AMLODIPINE BESYLATE AND INDAPAMIDE IN METHANOL FOLLOWED BY BORATE BUFFER-pH 8.0
6.
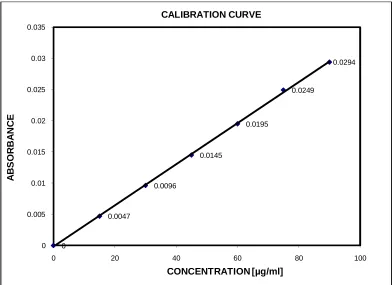
CALIBRATION CURVE OF AMLODIPINE BESYLATE IN METHANOL FOLLOWED BY BORATE BUFFER AT 339.0 nm (FIRST ORDER DERIVATIVE SPECTROPHOTOMETRIC METHOD)
7.
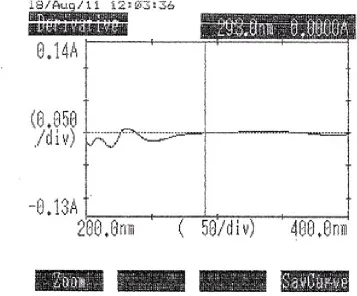
CALIBRATION CURVE OF INDAPAMIDE IN METHANOL FOLLOWED BY BORATE BUFFER AT 293.0 nm (FIRST ORDER DERIVATIVE SPECTROPHOTOMETRIC METHOD)
8. SPECTRAL CONFIRMATION OF AMLODIPINE BESYLATE IN METHANOL FOLLOWED BY MOBILE PHASE AT 240.0 nm
9. SPECTRAL CONFIRMATION OF INDAPAMIDE IN METHANOL FOLLOWED BY MOBILE PHASE AT 240.0 nm
10.
2
11. CHROMATOGRAM OF AMLODIPINE BESYLATE AND
INDAPAMIDE IN METHANOL AND ACETONITRILE (50:50 % v/v)
12.
CHROMATOGRAM OF AMLODIPINE BESYLATE AND
INDAPAMIDE IN ACETONITRILE, METHANOL AND PHOSPHATE BUFFER- pH 3.0 (30:40:30 % v/v/v)
13.
OPTIMIZED CHROMATOGRAM OF AMLODIPINE BESYALTE AND INDAPAMIDE IN ACETONITRILE, METHANOL AND PHOSPHATE BUFFER-pH 3.0 (25:30:45 % v/v/v)
14. LINEARITY CHROMATOGRAM OF AMLODIPINE BESYLATE AND INDAPAMIDE (80, 24 µg/ ml)
15. LINEARITY CHROMATOGRAM OF AMLODIPINE BESYLATE AND INDAPAMIDE (90, 27 µg/ ml)
16. LINEARITY CHROMATOGRAM OF AMLODIPINE BESYLATE AND INDAPAMIDE (100, 30 µg/ ml)
17. LINEARITY CHROMATOGRAM OF AMLODIPINE BESYLATE AND INDAPAMIDE (110, 33 µg/ ml)
18. LINEARITY CHROMATOGRAM OF AMLODIPINE BESYLATE AND INDAPAMIDE (120, 36 µg/ ml)
19. CALIBRATION CURVE OF AMLODIPINE BESYLATE
20. CALIBRATION CURVE OF INDAPAMIDE
21. CHROMATOGRAM FOR ANALYSIS OF FORMULATION (NATRILAM) REPEATABILITY – 1
22. CHROMATOGRAM FOR ANALYSIS OF FORMULATION (NATRILAM) REPEATABILITY – 2
23. CHROMATOGRAM FOR ANALYSIS OF FORMULATION (NATRILAM) REPEATABILITY – 3
3
25. CHROMATOGRAM FOR ANALYSIS OF FORMULATION (NATRILAM) REPEATABILITY – 5
26. CHROMATOGRAM FOR ANALYSIS OF FORMULATION (NATRILAM) REPEATABILITY – 6
27. CHROMATOGRAM FOR RECOVERY STUDIES (80%)
28. CHROMATOGRAM FOR RECOVERY STUDIES (100%)
LIST OF TABLES
TABLE
No. SUBJECT
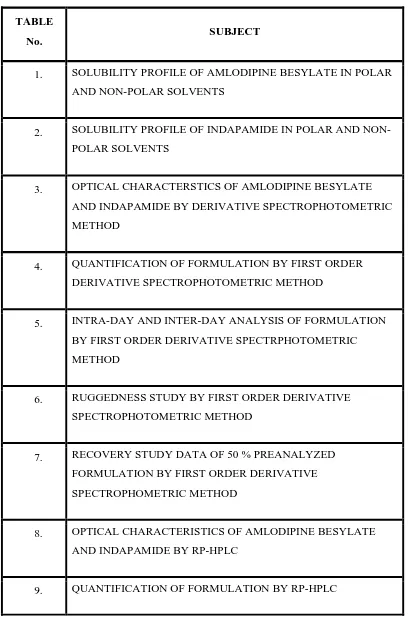
1. SOLUBILITY PROFILE OF AMLODIPINE BESYLATE IN POLAR AND NON-POLAR SOLVENTS
2. SOLUBILITY PROFILE OF INDAPAMIDE IN POLAR AND NON-POLAR SOLVENTS
3. OPTICAL CHARACTERSTICS OF AMLODIPINE BESYLATE AND INDAPAMIDE BY DERIVATIVE SPECTROPHOTOMETRIC METHOD
4. QUANTIFICATION OF FORMULATION BY FIRST ORDER DERIVATIVE SPECTROPHOTOMETRIC METHOD
5. INTRA-DAY AND INTER-DAY ANALYSIS OF FORMULATION BY FIRST ORDER DERIVATIVE SPECTRPHOTOMETRIC METHOD
6. RUGGEDNESS STUDY BY FIRST ORDER DERIVATIVE SPECTROPHOTOMETRIC METHOD
7. RECOVERY STUDY DATA OF 50 % PREANALYZED FORMULATION BY FIRST ORDER DERIVATIVE SPECTROPHOMETRIC METHOD
8. OPTICAL CHARACTERISTICS OF AMLODIPINE BESYLATE AND INDAPAMIDE BY RP-HPLC
[image:12.612.120.528.90.707.2]2 TABLE
No. SUBJECT
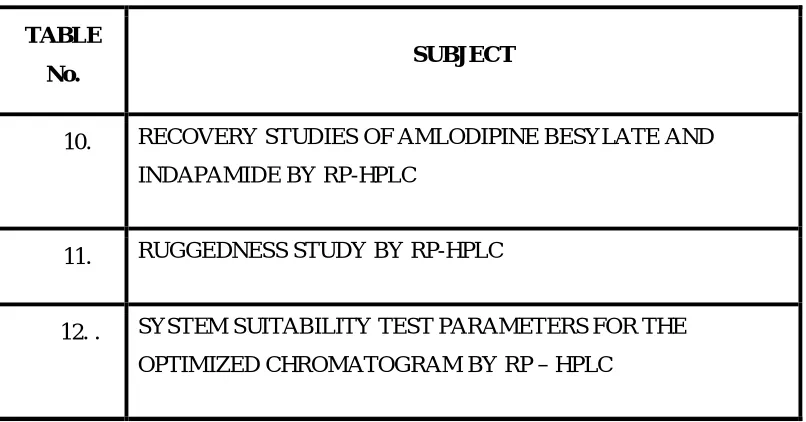
10. RECOVERY STUDIES OF AMLODIPINE BESYLATE AND INDAPAMIDE BY RP-HPLC
11. RUGGEDNESS STUDY BY RP-HPLC
[image:13.612.123.526.65.276.2]LIST OF ABBREVIATIONS % - Percentage
% R.S.D - Percentage Relative Standard Deviation
µ - Micron
µl - Microlitre
°
C - Degree Celsius
AML - Amlodipine Besylate
AU - Absorption Unit
Gms - Grams
HPLC - High Performance Liquid Chromatography
IND - Indapamide
ICH - International Conference on Harmonization
IR - Infra Red
LOD - Limit of Detection
LOQ - Limit of Quantification
mg/ tab - Milligram Per Tablet
min - Minute
ml - Milliliter
ml/ min - Milliliter/Minute
ng/ ml - Nanogram Per Milliliter
nm - Nanometer
pH - Negative Logarithm of Hydrogen Ion
rpm - Rotations Per Minute
Rt or tR - Retention Time
S.D. - Standard Deviation
S.E. - Standard Error
USP - United States Pharmacopoeia
UV-VIS - Ultraviolet – Visible
v/v/v - Volume / Volume/ Volume
λ - Lambda
1
1. INTRODUCTION 1.1 Analytical chemistry (Kamboj, et al., 2003)
Analytical chemistry deals with various analytical methods for determining and estimating different matters in various states. It is based on the various rings and functional groups present in a molecule. The Analytical chemistry has been split in to two main types
Quantitative Analysis Qualitative Analysis
Quantitative analysis gives the amount of the analyte in the component mixture. Qualitative analysis gives information about the various functional groups and rings in the analyte molecule.
The analytical methods are of two types Classical methods
Instrumental methods
In classical methods, for qualitative analysis, the analyte is extracted and treated with the reagent specific for a functional group to give a coloured reaction. In quantitative analysis, the amount of the analyte in determined by titrimetric method or by gravimetric method.
The instrumental methods are based on the physical properties of the analyte such as the light absorption or emission, conductivity, mass to charge ratio, fluorescence, adsorption and partition etc. The instrumental methods are basically categorized as follows
2 4. Thermal methods
5. Light Scattering methods
The instruments used for the instrumental methods basically consist of a source, system under study and the response. The source may be a light source, electrical source or heat source etc., as required by the instrument. The system under study is the analyte under study or any physical character of the analyte. The response is the unit in which the analytical signal from the analyte which is converted to an output signal for the interpretation.
1.2 Analytical Techniques
(Douglas A Skoog, et al., 2004; Willard, et al.,1986;Sethi, et al., 2001) I. Titrimetric methods:
A) Acid – Base Titrations 1. Direct Titrations
a) Titration of an acid by a base
i) Titration of liberated acid
ii) Sorenson – Formol Titration
iii) Non – Aqueous
b) Titration of base by an acid
i) Titration of metal salts
ii) Non – Aqueous
2. Residual Titrations
3 II. Gravimetric Methods
i) Weigh drug after extraction
ii) Weigh a derivative after separation
iii) Weighing residue after ignition
III. Spectrophotometric Methods i) Dye complex methods
ii) Colourimetric method
iii) Ultra violet method
iv) Flourimetric method
v) Flame photometry
vi) Atomic absorption spectroscopy
vii) Infrared spectrophotometry
viii) Raman spectroscopy
ix) X-ray spectroscopy
x) Mass Spectroscopy
IV. Electro analytical methods i) Potentiometry
ii) Voltametry
iii) Coulometry
iv) Electrogravimetry
v) Conductance techniques.
4 ii) Paper chromatography
iii) Column chromatography
iv) Gas chromatography
v) High Performance Liquid Chromatography
VI. Miscellaneous methods i) Thermal analysis
ii) Kinetic techniques
iii) Enzyme assay
VII. Hyphenated techniques
i) GC-MS (Gas chromatography – Mass spectrometry)
ii) LC-MS (Liquid chromatography – Mass spectrometry)
iii) GC-IR (Gas chromatography – Infrared spectroscopy)
iv) ICP-MS (Inductively coupled plasma – Mass spectrometry)
Factors Affecting the Choice of Analytical Methods (Mendham, et al., 2002) The type of analysis required
Problem arising from the nature of the material
Possible interference from components of the material other than those of interest
The concentration range which needs to be investigated The accuracy required
The facilities available
5
1.3 UV SPECTROSCOPY (Sharma, et al., 2007; Gurudeep R Chatwal, et al., 2009) The UV spectroscopy is one of the most widely used instrumental analytical
techniques for the analysis of pharmaceutical products. The UV region extends from 190 nm to 380 nm. The instrument used to measure the intensity of the UV radiation
absorbed or transmitted is known as the ultraviolet - Visible spectrophotometers. A molecule can absorb the UV radiation only when the energy of the radiation similarly to the energy is required to induce electronic transaction in the molecule.
1.3.1 Laws of absorption
When a beam of UV light is allowed to pass through a substance which absorbs the UV light, the intensity of the transmitted light is lesser than the incident light. The reduction of the intensity is may be due to
Reflections on the surface of the cell Scattering of light by macro molecules
Absorption
The two important laws which govern the UV spectroscopy are the Lambert’s law and Beer’s law. Lambert’s law states that the intensity of the light decreases exponentially with decrease in the thickness of the medium through which it passes. Beer’s law states that the intensity of the light decreases exponentially with increase in the concentration of the absorbing substance.
The two laws where combined to form the Beer-Lambert’s law, which is given by the equation
A = abc Where, A is the absorbance
6 c is the concentration.
The absorptivity is defined as, the absorbance of a substance at a specific wavelength of a 1 g/100 ml solution in a 1cm cell.
1.3.2 Deviation of Beer’s law
When the absorbance is plotted against concentration, a straight line passing through the origin should be obtained. But there is always a deviation from the linear relationship in the plot of absorbance versus concentration. The deviation in the Beer’s law may be due to anyone of the following reasons.
The presence of foreign substance affects the light absorption and alters the extinction coefficient.
Due to dissociation or association of the molecule.
Example, benzyl alcohol in chloroform exists as a polymer. The
monomer absorbs at lower wavelength and the polymer at higher wavelength.
Due to presence of foreign substance which absorbs at the same
wavelength as the analyte.
If monochromatic light is not used.
7 1.3.3 Transitions in Organic Molecules
(Sharma, et al., 2007; Gurdeep R Chatwal, et al., 2009) The absorption in the ultraviolet region results in the transition of the valence electron form the ground level to the excited level. The three types of electrons involved in the transition are
σ-electrons: These are involved in the formation of saturated bonds. The excitation
energy for UV radiations is more than electrons in the atom. Hence these electrons do not absorb near UV radiation.
π-electrons: These are involved in the formation of unsaturated bonds.
Example: Dienes, trienes and aromatic compounds. It absorbs radiation in near UV region.
n-electrons: These are the lone pair of electrons present in atoms such as oxygen,
nitrogen etc., in a molecule. They can be excited by both UV and Visible radiations.
The various types of transitions are
σ →σ*
n→σ* π → π *
n→π*
8
The energy required for the various types of transitions are
σ→σ* > n→σ* > π→π * > n→π *
1.3.3.1 σ→σ* transitions
These transitions occur in saturated hydrocarbons with single bonds and no lone pair of electrons. The energy required for this type of transition is very high because of the strong sigma bond formed by the valence electrons. Thus, the transitions occur at very short wavelength. The saturated hydrocarbons such as methane, ethane, propane etc. absorbs at 126 -135 nm region of the UV region. Hence these compounds are used as solvents in UV spectroscopy.
1.3.3.2 n → σ* transitions
Saturated compounds with lone pair of electrons show n→σ* transitions in addition to σ→σ* transitions. The energy required for the n→σ* transition is lesser
than the energy required for σ→σ* transitions. The energy required for n→σ*
transition, in alkyl halides, decreases with increase in the size of the halogen atom. Alcohols and amines forms hydrogen bonding with the solvent hence require higher energy for the transitions.
1.3.3.3 π→π * transitions
These transitions occur in unsaturated compounds containing double or triple bonds and also in aromatic compounds. Lower energy is required for these transitions and hence a longer wavelength causes the excitation of the molecule.
1.3.3.4 n→π* transitions
9
transitions occurring at longer wavelength and high energy n→ π* transitions occurring at lower wavelength. The shifts in the absorption of the carbonyl compounds are due to the polarity of the solvent.
1.3.4 Transition Probability (Gurudeep R. Chatwal, et al., 2009)
It is not essential that, when a compound is exposed to UV light, transition of the electron should take place. The probability that an electronic transition should take place depends on the value of extinction coefficient. The transitions are classified as
Allowed transition Forbidden transition
1.3.4.1 Allowed transitions
The transitions having εmax value greater than 104 are called allowed
transitions. They generally arise due to the π→ π * transitions. For example, 1, 3 – butadiene exhibits absorption maximum at 217 nm and has εmax value of 21000
represents allowed transitions. 1.3.4.2 Forbidden transitions
These transitions have εmax value less than 104. They occur due to n→ π*
transitions. Example, saturated carbonyl compound (R-C=O) shows absorption near 290 nm and εmax value less than 100 represent forbidden transitions.
1.3.5 Chromophore
These are groups or structure which is responsible to impart colour to the compound. The presence of chromophore is responsible for the absorption of UV radiation by any compound. The groups include nitro group, amine groups, double bonds, triple bonds, etc.
There are two types of chromophore
10 Example: ethylenes, acetylenes
Groups containing π electrons and n electrons. They undergo two types of transition
like π→π * transitions and n→π* transitions. Example: carbonyls, nitriles, azo compounds etc.
1.3.6 Auxochrome
Any groups which do not itself act as a chromophore but its presence brings a shift in the position of absorption maximum. Chromophores are unsaturated whereas the auxochromes are covalently saturated. The auxochromes are of two types
Co-ordinately unsaturated, example –NH2, -S- groups containing lone pair of
electrons.
Co-ordinately saturated, example –NH3+ groups.
1.3.7 Absorption and Intensity shifts 1.3.7.1 Bathochromic shift or Red shift
The shift in the absorption maximum of a compound, due to the presence of certain auxochromes, towards longer wavelength is called as the bathochromic shift.
1.3.7.2 Hypsochromic shift or Blue shift
The shift in the absorption maximum to shorter wavelength is called Hypsochromic shift. The shift is due to solvent effect or removal of conjugation in a molecule.
1.3.7.3 Hyperchromic effect
The increase in intensity of absorption by inclusion of an auxochrome to a system is hyperchromic shift.
1.3.7.4 Hypochromic shift
11 1.3.8 Solvent effect
The solvent used for the spectral analysis should not interfere in the absorbance of the analyte. It means that the solvent should not have any absorbance in the region under investigation. Based on the polarity of the solvent used the intensity
of the absorption changes for a particular analyte. The α, β – unsaturated carbonyl compounds shows two different types of transitions
n→π* transition
The increase in polarity moves the absorption maximum to a shorter wavelength. The ground state is more polar compared to the excited state.
π→π * transitions
The increase in polarity moves the absorption maximum to longer wavelength. Only lesser energy is required for this transition and hence shows red shift.
1.3.9 Choice of solvent
There are two important requirements a solvent must satisfy to be used as a solvent in UV spectroscopy.
There are
It should be transparent throughout the region of UV under investigation It should not interact with the solute molecules and should be less polar. 1.3.10 Instrumentation
The components of a UV-Visible spectrophotometer are Light source
12 Light source
The various source of light used in the spectrophotometer are tungsten lamp, hydrogen discharge lamp, deuterium lamp, xenon arc lamp and mercury arc lamp. The most commonly used lamp is the deuterium discharge lamp.
Monochromators
The monochromators are used to disperse the light for the required wavelength. The monochromators consists of three units entrance slit, dispersing element and exit slit. The dispersing unit may be filters, prisms or gratings. The fused silica prisms and quartz prisms are commonly used in UV spectrophotometers.
Sample cell
The cell must be transparent throughout the wavelength region of study. The cells are made of fused glass or fused silica or quartz. The glass cells are not used since they absorb in the UV region. Quartz cells are commonly used.
Detectors
The detectors employed are barrier layer cells, photo emissive tubes, photodiodes and photomultiplier tubes. Photodiodes are commonly used in the instrument.
1.3.11 Spectrophotometers
There are two designs of spectrophotometer. They are single beam spectrophotometer and double beam spectrophotometer.
Single beam system
Light given off from the source
Lens gathers the light and focuses on the monochromator
The light of specific wavelength comes out of the monochromator
13
Detector measures the intensity of the light reaching it.
UV-Visible Single beam spectrophotometer (chemistry.adelaide.edu.au)
Double beam system
Radiation from source falls on the monochromator
The radiation of the required wavelength pass out of the exit slit reaches the
rotating disc
Rotating disc splits the beam into two, one passes through the sample cell and
the other passes through the reference cell The light beam falls on the detector
Detector measures the intensity of the light.
14 1.3.12 Quantitative analysis of single component
(Beckett and Stenlake, et al., 2007)
The assay of an analyte is done by dissolving the analyte in a suitable solvent and measuring the absorbance of the solution at the required wavelength. The selected wavelength is the absorbance maximum of the analyte in that particular solvent. The concentration of the analyte can be determined by
Use of absorptivity value Use of calibration graph
Single or double point standardization
1.3.12.1 Absorptivity value method
This method is usually followed in official books such as Indian Pharmacopoeia, British Pharmacopoeia etc. The advantage of the method is, the preparation of standard solutions of reference substance is not required for the
calculation of the concentration of the analyte. 1.3.12.2 Calibration graph method
In this method, a series of linear concentration solutions of the reference solutions are prepared and the value of absorbance is plotted against the concentration of the reference solution. From the graph the absorbance of the sample solution is plotted and the concentration is found.
1.3.12.3 Single point or double point standardization
In single point standardization, the standard and the sample solutions are prepared under same identical condition. Also, the standard and the sample concentration are almost equal. Then after the measurement of absorbance the following formula is applied to find the unknown sample concentration
15
Double point standardization is used when there is a linear but non proportional relationship between concentration and absorbance. The concentration of one of the standard is higher and the concentration of other is lower than that of the standard.
=( − )( − ) + ( − )
−
1.3.13 Assay of substance in multi component samples
The multi component analysis is done when the sample contains more than one analyte to be quantified in the sample. In such methods one of the analyte may be taken as interferent and the absorbance of the interferent reduced to find the true absorbance of the analyte. Similarly the absorbance of the other analyte is found by taking the first analyte as the interferent.
The determination of the multi-component samples can be done by using the following methods:
Assay of a single-component sample
Assay using absorbance corrected for interference
Assay after solvent extraction of the sample Simultaneous equations method
Absorbance ratio method (Q-Analysis)
Geometric correction method
Orthogonal polynomial method
16
Derivative spectrophotometry
Area under curve method
Chemical derivatization
Method carried out Derivative spectroscopy Derivative Spectroscopy
Derivative spectrophotometry involves the conversion of a normal spectrum to its first, second or higher derivative spectrum. The transformations that occur in the derivative spectra are understood by reference to a Gaussian band which represents an ideal absorption band. In the context of derivative spectrophotometry, the normal absorption spectrum is referred to as the fundamental, zero order or D° spectrum.
The first derivative (D1) spectrum is a plot of the ratio of change of absorbance with wavelength against wavelength, i.e. a plot of the slope of the fundamental
spectrum against wavelength or a plot of dA/dλ Vs λ. At λ2 and λ4, the maximum
positive and maximum negative slope respectively in the D°. Spectrums correspond with maximum and a minimum respectively in the D1 spectrum. The λmax at λ3 is a
wavelength of zero slopes and gives dA/d λ 0, i.e. a cross-over point, in the D1 spectrum.
The second derivative (D2) spectrum is a plot of the curvature of the D° spectrum against wavelength or a plot of d2A/dλ2 Vs λ. The maximum negative curvature at λ3 in the D° spectrum gives a minimum in the D2spectrum, and at λ1 and
λ5 the maximum positive curvature in the D° spectrum gives two small maxima called
17
The zeroth (a), first (b) and second (c) derivative spectra of a Gaussian band.
Wavelengths of maximum slope and zero curvature in the D° spectrum correspond with cross-over points in the D2 spectrum.
In summary, the first derivative spectrum of an absorption band is
characterized by a maximum, a minimum, and a cross-over point at the λmax of the
absorption band. The-second derivative spectrum is characterized by two satellite maxima and an inverted band of which the minimum corresponds to the λmax of the
fundamental band.
18
maximum to a minimum, is inversely proportional to the fundamental spectral bandwidth (14’) raised to the power (n) of the derivative order. Thus,
D α ( 1/W )n
Consequently, substances of narrow spectral bandwidth display larger derivative amplitudes than those of broad bandwidth substance
(a) The individual spectra of two components X and Y in admixture and their combined spectrum. (b) The second derivative spectrum of the mixture showing improved resolution of the individual bands.
19
1.4 HIGH PERFORMANCE LIQUID CHROMATOGRAPHY
(Sharma, et al., 2000)
The high performance liquid chromatography is thus a method of separation in which the stationary phase is contained in a column one end which is attached to a source of pressurized liquid eluent (mobile phase ).
20
1.4.1. MODES OF SEPARATION (Lloyd, et al., 1997) i. Reversed-phase chromatography
Reversed-phase chromatography (RPC) is the first choice for most regular samples. RPC s typically more convenient and rugged than other forms of liquid chromatography and is more likely to result in a satisfactory final separation. High-performance RPC columns are efficient, stable, and reproducible. Detection often is easier in RPC because of the solvents used. Finally, most workers have more experience with RPC than with other HPLC methods.
Although many organic compounds have limited solubility in the mobile phase, this is not a practical limitation because only small amounts (nanograms or micrograms) of sample are usually injected. In those cases where sample solubility in RPC mobile phases is exceptionally poor, normal-phase chromatography is a preferred alternative. Similarly, samples that are unstable in aqueous media can also be separated by normal phase chromatography using non-aqueous solvents.
ii. Normal-phase chromatography
In normal-phase chromatography (NPC) the stationary phase is more polar than the mobile phase, the opposite of RPC. Usually, the mobile phase is a mixture of organic solvents without added water and the column packing is either an inorganic adsorbent (silica or occasionally alumina) or a polar bonded phase (cyano, diol, or amino) on a silica support. Regardless of the mobile or stationary phase used, sample retention in NPC increases as the polarity of the mobile phase decreases (the opposite of RPC).
21
the mobile phase, and the retention process is then somewhat complex. When ionic samples are separated by NPC, it is usually advisable to add triethylamine to the mobile phase for basic compounds and acetic or formic acid for acidic compounds. Neutral samples are often separated equally well by either RPC or NPC, the main difference being a reversal of elution order for the two HPLC methods. In NPC, less polar compounds elute first, while more polar compounds leave the column last: this behavior can be contrasted with the opposite RPC behavior.
iii. Ion-pair chromatography
Ion-pair and reversed-phase HPLC share several features. The column and mobile phase used for these separations are generally similar, differing mainly in the addition of an ion-pair reagent to the mobile phase for ion-pair chromatography (IPC). For most applications that involve ionic samples, RPC separation should be explored first, before considering IPC. IPC separations are more complicated to develop and are subject to additional experimental separation due to poor band spacing, IPC provides an important additional selectivity option. Thus IPC is a logical follow-up for RPC separations that need improvement.
iv. Ion-exchange chromatography
Ion exchange chromatography (IEC) was an important HPLC method. Its application for the separation of most sample types gradually diminished compared to other HPLC methods. Today it is used infrequently, except for certain “special” samples. These include mixtures of biological origin, inorganic salts, and some organometallics.
22
separation of typical small-molecule samples, IPC may have certain advantages like higher column efficiencies, easier control over selectivity and resolution, and more stable and reproducible columns.
1.4.2. Elution techniques (Sharma, et al., 2000)
Two types of elution techniques generally used. They are,
i) Isocratic elution
One particle solvent or mixture is pumped through the whole analysis. ii) Gradient elution
For some determinations the solvent composition may be altered gradually gradient elution system can be classified as low pressure and high pressure system. In low pressure gradient elution system the eluent components are miner proportion varying with time at low pressure and the mixture is pumped in order to be delivered at high pressure to the column. In high pressure gradient elution system components or mixtures of fixed composition are each pumped by separate pump and then mixed at high pressure in a ratio varying with time.
1.4.3. REVERSE-PHASE HIGH PERFORMANCE LIQUID CHROMATOGRAPHY (Mendham, et al., 2002)
High performance systems have meant that liquid chromatography has over
taken gas chromatography as HPLC now provide the following features,
1. High Resolving Power 2. Speedy separation
23
5. Repetitive and reproducible analysis using some columns
1.4.3.1. Mobile Phase
A successful chromatographic separation depends upon differences in the interaction of the solutes with the mobile phase and the stationary phase. In liquid chromatography, the choice and variation of the mobile phase is of critical importance in achieving optimum efficiency. HPLC grade solvents tend to be costly. To ensure consistent performance, the solvent should not contain any trace amounts of other materials, including water for organic solvents.
1.4.3.2. Pumping Systems (Douglas, et al., 2004; Willard, et al., 1986) The requirements for liquid chromatographic pumps include
Ability to generate pressures of up to 6000 psi (Ibs/in2) Pulse free output
Flow rate ranging from 0.1 to 10 ml/min Flow reproducibility of 0.5% relative or better Resistance of corrosion by a variety of solvents
Types of pumps
Reciprocating Piston Pumps Syringe Type Pump
Constant Pressure Pump
1.4.3.3. Columns for HPLC (Willard, et al., 1986)
24
small, rigid particles having a narrow particles size distribution. The types of column used in HPLC are
Standard columns
Radial compression columns Narrow Bore columns Short, fast columns
Guard columns and In-line filters
1.4.3.4. Temperature Control
Separation columns should be housed within a stable system with temperature variations of less than 0.1°C, the temperature changes must be avoided. Circulating air bath or electrically heated chambers are used to control the column temperature. The solvent is preheated separately before entering the separation column.
1.4.3.5. Detectors (Ashutoshkar, et al., 2005)
The main function of the detector in HPLC is to monitor the mobile phase coming out the column, which in turn emits electrical signals that are directly proportional to the characteristics either of the solute or the mobile phase.
Basic detector requirements
An ideal LC detector should have the following properties:
1. Low drift and noise level (particularly crucial in trace analysis). 2. High sensitivity
3. Fast response
25 Types of detectors
Detector Types of molecules General
Refractive Index Detector Carbohydrates, Polymers Molecules that do not have a UV chromophore, cannot UV/Vis, Pho diode array
detector
Organic molecules, bio molecules expect carbohydrates
Any molecule that absorbs, light between 170 and 700 nm, PDAs are typically used either when the molecules in the mixture absorb at different wavelengths or when the wavelength of maximum absorption is unknown. PDAs can be used for determining peak
Fluorescence Aromatic compounds (PAHs) AccQTag,
Generally used for applications that require extremely high sensitivity ELSD Evaporating light
scattering detector
26
Mass spectrometer Organic molecules, bio molecules
Can be used to detect and determine the mass on any molecule that can be ionized and is within the mass range of the specific MS
MS/MS Organic molecules, bio
molecules
Detect and determine the mass of any molecule that can be ionized and is within the mass range of the specific Ms and detailed structural studies to be performed
ECD Electrochemical detector
Carbohydrates, man other organic molecules whose redox potential is different than the mobile
Can provide extra sensitivity and selectivity for molecules that are not readily detected by device
Conductivity Cations and Anions Used almost exclusivel for ion chromatography
1.4.4. THEORY OF OPERATION
Column efficiency (Lloyd, et al., 1997; Willard, et al., 1986)
27
may or may not be affected by chromatographic anomalies, such as "tailing" or appearance of a "front". This is important because many chromatographic peaks do not appear in the preferred shape of normal Gaussian distribution. For this reason, efficiency can be an enigmatic value since manufacturers may use different methods in determining the efficiency of their columns.
Calculation of column efficiency value Inflection method
Half-peak height method Tangent method
Sigma Method Height/Area method Moment method
1.4.5. QUANTITATIVE ANALYSIS
Quantification involves the measurement of peak height or peak area. To determine the concentration of a compound, the peak area or height is plotted vs the concentration of the substance. For well resolved peaks, both peak height and area are proportional to the concentration. Four different calibration methods used in quantitative analysis are,
a. Normalized peak area
b. External standard addition method
c. Internal standard addition method
28 a. Normalized peak area
After completion of a run and the integration of all significant peaks in the chromatogram, the total peak area can be calculated. This technique is widely used to estimate the relative amount of small impurities or degradation compound in a purified material. The area present of any individual peak is referred to as the normalized peak area. The technique of normalized peak area is actually not a calibration method, since there is no comparison to a known amount for any peak in the chromatogram.
b. External standard calibration
The most general method for determining the concentration of an unknown sample is to construct a calibration plot using external standards. Standards are prepared at known concentrations. A fixed volume of each standard solution is Injected and analyzed, and the peak responses are plotted Vs concentration. The standard solutions are referred to as external standards, since they are prepared and analyzed in separate chromatograms from those of the unknown samples. Unknown samples are then prepared, injected and analyzed in exactly the same manner.
c. Internal standard calibration
29
The Internal standard comply the following requirements:
Well resolved from the compound of interest and other peaks.
Similar retention (k) to the analyte.
Should not be in the original sample
Should mimic the analyte in any sample preparation steps.
Does not have to be chemically similar to analyte.
Commercially available in high purity.
Stable and unreactive with sample or mobile phase.
Should have similar detector response to the analyte for the concentration used
It must be separated from all compounds of interest in the separation.
d. Method of standard addition
30
1.5. ICH Guidelines for Analytical Method Validation Parameters (Code Q2A; Q2B, ICH Guidelines 1994 and 1995)
The analytical methods are validated as per the ICH and USFDA guidelines. The objective of validation of analytical method is to prove that the method is suitable for the specific purpose. Analytical procedure refers to the way of doing an analysis. It describes completely all the steps involved in performing the analysis. The types of analytical procedure to be validated are
Identification tests
Quantitative test for impurities Limit test for impurities
Quantitative analysis of the active drug
The various validation parameters specified in the ICH and USFDA guidelines are Accuracy
Precision Specificity Limit of detection Limit of quantification Linearity
31 Accuracy
32 Precision
Precision expresses the degree of scatter between a series of measurement made in multiple sampling from the same homogenous sample. It may be considered under three levels
Repeatability
Intermediate precision Reproducibility
The precision is expressed as Variance, standard deviation and coefficient of variation for a series of measurements.
The repeatability is confirmed by a minimum of 6 estimations at 100% of test concentrations. The standard deviations should be less than 2.
The intermediate precision is confirmed by inter day and intraday analysis, different instruments and different analyst.
Specificity
Specificity refers to the ability of the method to assess the analyte in the presence of other components like impurities, matrix or degradants, etc. The implications of specificity are
Identification: to ensure identity
Purity tests: to determine the content of impurity Assay: content of the analyte in the sample Limit of Detection
It is the lowest amount of an analyte that can be detected by the analytical procedure but cannot be quantified exactly.
33 Based on signal to noise ratio
Based on the standard deviation and slope value.
The visual examination is done by analysing the sample with known quantity of standard and by establishing the minimum level at which the analyte can be detected.
A signal to noise ratio of 3 o 2.1 is considered as acceptable value for calculating the detection limit. Based on slope and standard deviation values, Detection limit can be calculated by using the formula,
3.3σ
LOD= ---
S
σ = the standard deviation of the response
S = the slope of the calibration curve (of the analyte) Limit of quantification
The lowest amount of the analyte which can be quantified by an analytical method with precision and accuracy is the limit of quantification.
Three approaches are made for determining the quantification limit. They are similar to that of determining the detection limit.
Based on visual examination Based on signal to noise ratio
Based on slope and standard deviation value
10σ
LOQ = --- S Where
σ = the standard deviation of the response.
34 Linearity
Linearity is the ability of an analytical method to obtain results which are directly proportional to the analyte concentration within a given range. The linearity is evaluated as a plot of signals as a function of analyte concentration. The statistical parameters such as the slope, intercept, regression equation and correlation coefficient are calculated. For establishing of linearity, a minimum of 5 concentrations is required.
Range
It is the interval between the lower and upper limit of concentration in a sample for which the analytical method has suitable precision, accuracy and linearity. The minimum range considered for the assay of drug or finished product is form 80 to 120 percent of the test concentration.
Robustness
It is the ability of an analytical method to remain unaltered by small but deliberate variations in various parameters of the method and indicate its reliability. The typical variation includes stability of analytical solutions and extraction time. In case of HPLC, the change in the ratio of mobile phase, flow rate, variation of pH of the solution are done for determining the robustness of the method.
Ruggedness
The united states of pharmacopoeia (USP) define ruggedness as the degree of reproducibility of test results obtained by the analysis of the same sample under a variety of normal test condition such as different labs, different analysis, different lots
35 Acceptance criteria of validation for HPLC
S.No. Characteristics Acceptance Criteria
1 Accuracy Recovery 98-102% with 80,100,120% spiked sample.
2 Precision RSD < 2%
2a Repeatability RSD < 2%
2b Intermediate precision RSD < 2%
3 Specificity/ selectivity No interference
4 Detection Limit S/N > 2 or 3
5 Quantitation Limit S/N > 10
6 Linearity r = 0.999
7 Range 80-120%
8 Stability >24 hr or > 2hr
1.6. SYSTEM SUITABILITY
36
System suitability parameters and recommendations
S.No. Parameters Recommendations
1 Theoritical plates (N) >2000
2 Tailing factor (T) ≤ 2
3 Assymetric factor ≤ 2
3 Resolution (Rs)
> 2 between peak of interest and the closest eluting potential interference
4 Repeatability RSD ≤ 1% for N ≥5 is desirable
5 Capacity factor (k1) > 2.0
6 Relative retention Not essential as long as the resolution is stated
1.6.1. SYSTEM SUITABILITY PARAMETERS
(Lloyd, et al., 1997; Beckett and Stenlake, et al., 2007)
System suitability testing is an integral part of many analytical procedures.
The tests are based on the concept that the equipment, electronics, analytical operations, and samples to be analyzed constitute an integral system that can be evaluated as such. System suitability test parameters to be established for a particular procedure depend on the type of procedure being validated.
The parameters that are affected by the changes in chromatographic conditions
are,
37 Resolution (Rs)
Selectivity ()
Column efficiency (N) Peak asymmetry factor (As)
Tailing factor (T)
1.6.1.1. Column capacity factor (KA)
The retention of a drug with a given packing material and eluent can be expressed as retention time or retention volume, but both of these are dependent on flow rate, column length and column diameter. The retention is best described as a column capacity ratio (K), which is independent of these factors. The column capacity ratio of a compound (A) is defined as
0 0 A 0 0 A A
t
t
t
V
V
V
K
Where,
VA = Elution volume of A
V0 = Elution volume of a non retained compound (void volume)
At constant flow rate, retention times (tA and to) can be used instead of
retention volumes. Retention data is sometimes expressed, relative to a known internal standard (B). The ratio of retention times (tA/tB) can be used, but the ratio of
adjusted retention times
o B o At
t
t
t
is better when data need to be transferred
38
The values of k’ of individual bands increase or decrease with changes in solvent strength. In reversed phase HPLC, solvent strength increases with the increase in the volume of organic phase in the water / organic mobile phase. Typically an increase in percentage of the organic phase by 10 % by volume will decrease k’ of the bands by a factor of 2-3.
1.6.1.2 Resolution (Rs)
The resolution, Rs of two neighboring peaks is defined by the ratio of the
distance between the two peak maxima. It is the difference between the retention times of two solutes divided by their average peak width. For baseline separation, the ideal value of Rs is 2.0. It is calculated by using the formula,
)
W
W
(
5
.
0
Rt
Rt
R
2 1 1 2 f
Where,Rt1 and Rt2 are the retention times of components 1 and 2
W1 and W2 are peak widths of components 1 and 2.
1.6.1.3. Selectivity ()
The selectivity (or separation factor), , is a measure of relative retention of
two components in a mixture. The ideal value of selectivity is 2. It can be calculated by using the formula,
0 1 0 2
V
V
V
V
Where, V0 is the void volume of the column and V2 and V1 are the retention
39 1.6.1.4. Column efficiency
Efficiency, N, of a column is measured by the number of theoretical plates per meter. It is a measure of band spreading of a peak. Smaller the band spread, higher is the number of theoretical plates, indicating good column and system performance. Columns with N ranging from 5,000 to 1,00,000 plates/meter are ideal for a good system. Efficiency is calculated by using the formula,
2 2
16
W
Rt
N
Where, Rt is the retention time and W is the peak width. 1.6.1.5. Peak asymmetry factor (As)
Peak asymmetry factor, As can be used as a criterion of column performance.
The peak half width b of a peak at 10 % of the peak height, divided by the corresponding front half width a gives the asymmetry factor.
a
b
A
S
1.6.1.6. Tailing factor (T)The tailing factor T, a measure of peak symmetry, is unity for perfectly symmetrical peaks and its value increases as tailing becomes more pronounced.
In some cases, values less than unity may be observed. As peak asymmetry increases, integration, and hence precision becomes less reliable.
T =W. 2f
40 W0.05 = width of peak at 5% height
f = Distance from the peak maximum to the leading edge of the peak, the distance being measured at a point 5% of the peak height from the baseline. Limit: ≤ 2 is preferable.
1.6.1.7. Height Equivalent to a Theoretical Plate (HETP)
A theoretical plate can be of any height, which decides the efficiency of separation. If HETP is less the column is more efficient. If HETP is more, the column is less efficient. The height equivalent to a theoretical plate (HETP) is given by
HETP = Length of the column
No. of the theoretical plates
1.7 BASIC STATISTICAL PARAMETERS (Takeru Higuchi, et al., 2001; Gupta,
et al., 1994)
In analytical chemistry, statistical methods are unavoidable .whether it is a calibration Curve or the result of single or multi analysis interpretation can only be
ascertained if the margin of error is known, when the measurement is repeated, a statistical analysis is compulsory. Total quality control on a statistical basis give promise of making pharmaceutical manufacturing more efficient.
1.7.1 Linear Regression
Once a linear relationship has been shown to have a high probability by the
41
y = mx + c
Where, y the dependent variable is plotted as result of changing x, the independent variable. To obtain the regression line ‘y on x’ the slope ‘m’ of the line and the intercept ‘c’ on the y axis are given by the following equation.
m =N Σxy – (Σx) (Σy) N Σx –Σ(x)
c =(Σy)(Σx ) – (Σx) (Σy) N Σx –Σ(x)
1.7.2. Correlation Coefficient
To establish whether there is a linear relationship between two variables x1 and y1, use Pearson’s correlation coefficient r.
r = nΣx y −Σx y
{[nΣx −(Σx ) ][nΣy −(Σy ) ]} /
Where, n is the number of data points.
The value of r must lie between +1 and -1, the nearer it is to +1, the greater the
probability that a definite linear relationship exists between the variables x and y, values close to +1 indicate positive correlation and values close to -1 indicate negative correlation values of ‘r’ that tend towards zero indicate that x and y are not linearly related (they made be related in a non-linear fashion).
1.7.3. Standard Deviation
42
deviation of values from their average and is expressed mathematically as
Where SD is Standard deviation
n = Large (50 or more) then of course it is immaterial whether the term in the denomination is n -1 or n
Σ= Summation
x = Mean or arithmetic average
x - ⃑ = Deviation of a value from the mean n = Number of observations
1.7.4. Percentage Relative Standard Deviation (%RSD)
It is also known as coefficient of variation. It is defined as the standard deviation (S.D) expressed as the percentage of mean.
C
100
x
S.D
RSD
%
or
V
Where, S D = Standard deviation
⃑ = Mean or arithmetic average
The variance is defined as S2 and is more important in statistics than S itself. However, the latter is much more commonly used with chemical data.
43 1.7.5. Standard Error of Mean (S.E.)
Standard error of mean can be defined as the value obtained by division of standard deviation by square root of number of observations. It is mathematically expressed as,
n
S.D.
S.E.
Where, S D = Standard deviation
44
2. LITERATURE REVIEW 2.1 DRUG PROFILE
(The Merck Index, 2006; Indian Pharmacopeia, 2007; The British Pharmacopeia, 2009)
2.1.1AMLODIPINE BESYLATE Molecular Structure
N H
O NH2
O
O CH3
O O C H3 C H3 Cl ,
SO3H
Chemical Name
3-ethyl 5-methyl2-[(2-aminoethoxy) methyl]-4-(2-chlorophenyl)-6-methyl-1, 4-dihydropyridine-3,5-dicarboxylate benzene sulphonate.
Molecular Formula
C26H31ClN2O8S Molecular Weight
567.1g/mol
Description
It is a white or almost white powder.
Solubility
Slightly soluble in water, freely soluble in methanol, sparingly soluble in ethanol, slightly soluble in 2-propanol.
Storage
45 pka Value
8.6
Storage
In an airtight container and protected from light.
Purity
98.0 to 102.0 IDENTIFICATION Melting Point.
*Average of six determinations
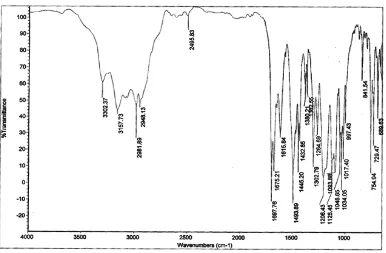
1) IR Spectrum
IR spectrum of Amlodipine besylate is compared with the standard Amlodipine besylate IR Spectrum and principal peaks at a wave numbers (KBr disc) were identified. It is shown in Figure 1.
PHARMACOLOGY AND TOXICOLOGY Category
Amlodipine besylate is a Antihypertensive Agent, Vasodilator Agent, Calcium Channel blockers and Antianginal.
Standard Value Observed Value*
46 Indications and dosage
Adultzz : Initially 5 mg once daily, increased over 7-14 days.
Elderly : Initially 2.5 mg/day, increased as required
Max Dose : Adult 10 mg/day
Mechanism of action
Amlodipine inhibits the movement of calcium ions (Ca2+) across the cell membrane into vascular smooth muscles and myoctes. Action is greater in the arterial resistant vessels causing peripheral vasodilatation and reduction in after load. Action on the myocardium is considerably less. Clinically, blood pressure is reduced without significant increase in heart rate. In angina patients reduction of after load reduces myocardial oxygen requirement. Severity and frequency of angina attacks are reduced while exercise tolerance is increased.
Pharmacokinetics (Martindale, 2005) Absorption
Rapidly and completely absorbed with systemic bio-availability of 60 to 65 % in oral dosage form.
Distribution
97.5 % bind to plasma protein albumin.
Metabolism
47 Elimination
95 % was eliminated through urine together with less than 10% of a dose of unchanged form.
Protein binding
71-79%
Half-Life
30 hours
Adverse Effect
48 2.1.2. INDAPAMIDE
Molecular Structure
N
CH
3NH
O
S
NH
2O
O
Cl
Chemical Name
4-chloro-N-[(2RS)-2-methyl-2, 3-dihydro-1H-indol-1-yl]-3-sulphamoylbenzamide.
Molecular Formula C16H16ClN3O3S
Molecular Weight 365.84 g/mol
Description
White or almost white powder. Solubility
Practically insoluble in water, soluble in alcohol and slightly soluble in ether. Storage
Store protected from light. pka Value
8.8
Purity
49 IDENTIFICATION
1) Melting point
*Average of six determinations
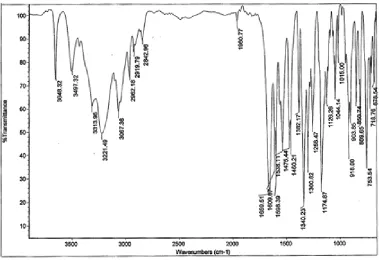
2) IR Spectrum
IR Spectrum of Indapamide is compared with the standard Indapamide IR Spectrum and Principal peak at a wave numbers (KBr disc) were identified. It is shown in Figure 2.
PHARMACOLOGY AND TOXICOLOGY
Category
Antihypertensive Agents and used as Diuretics.
Indications and dosage
Exerts antihypertensive effects at doses lower than those for diuretic action possible relaxation of vascular smooth muscle my inhibition of net Ca2+ inflow.
Adult : Initially 5 mg once daily, increased over 7-14 days.
Elderly : Initially 2.5 mg/day, increased as required
Max Dose : Adult 10 mg/day
Standard Value Observed Value*
50 Mechanism of Action
Indapamide blocks the slow component of delayed rectifier potassium current (IKs) without altering the rapid component (IKr) or the inward rectifier current. Specifically it blocks or antagonizes the action the proteins KCNQ1 and KCNE1. Indapamide is also thought to stimulate the synthesis of the vasodilator hypertensive prostaglandin PGE2.
Pharmacokinetics (Martindale, 2005) Absorption
Rapidly and completely absorbed from gastrointestinal tract.
Distribution
Strongly bound to red blood cells. Metabolism
Extensively metabolized by hepatic.
Elimination
About 60 to 70% of the dose has been reported to be excreted in the urine; only about 5 to 7% is excreted unchanged. About 16 to 23% of dose is excreted in the faeces.
Protein binding 71-79%
Half-Life
14 hours (bi phasic)
Adverse Effect
51 2.2 REPORTED METHODS
2.2.1 REPORTED METHODS FOR AMLODIPINE BESYLATE
1. Abdullah Al Masud et al. (2011)
“Validated RP-HPLC method for simultaneous estimation of Amlodipine Besylate and Atorvastatin Calcium”.
Stationary phase : C18 column (250×4.6 mm, 5 μ
Mobile Phase : 0.02 M phosphate buffer solution and acetonitrile as (50:50) v/v)
Flow rate : 1.0 mL /min
Detection : PDA detector
Wavelength : 238 nm.
Retention time : AML - 3.5 min ATR - 16.4 min
2. Vijayavichare et al. (2011)
“Spectrophotometric simultaneous determination of amlodipine besylate and hydrochlorothiazide in combined tablet dosage form by absorption ratio and first order derivative spectroscopy methods”.
Solvent : Methanol for Method A and method B Method A : Absorption Ratio
Wavelength : Amlodipine besylate -271, Hydrochlorothiazide-238.5 Method B : First order Derivative Spectroscopy
52 3. Devi Ramesh et al. (2010)
“New spectrophotometric methods for simultaneous determination of Amlodipine besylate and Atorvastatin calcium in tablet dosage forms”.
Method A : Simultaneous equation
Wavelength : Atorvastatin calcium at 331 nm and Indapamide 246 nm
Solvent : Methanol
Range : 0.5‐30 μg/mL
Method B : Q‐value analysis Isoabsorptive point : 238.8
Solvent : Methanol
Range : 0.5‐30 μg/mL
4. Nilesh Jain et al. (2010)
“RP- HPLC Method for Simultaneous Estimation of Losartan potassium and Amlodipine besylate in Tablet Formulation”.
Elution : Isocratic elution.
Stationary phase : Microsorb C18 Column (5 μm, 250mm x 4.60mm)
Mobile phase : methanol– phosphate buffer (pH 4.0) in the ratio of (70:30) % v/v)
Temp : isocratic at 25°C ± 0.5°C
Flow rate : 1.2ml/min
53 Wavelength : 248 nm
Retention time : AML- 5.59 + 0.5 min LOP- 4.26 + 0.5 min
5. Kardile et al. (2010)
“Simultaneous estimation of Amlodipine besylate and Olmesartan medoxomil drug formulations by HPLC and UV-spectrophotometric methods”.
Elution : Isocratic elution
Stationary phase : Microsorb C18 Column (5 μm, 250mm x 4.60mm)
Mobile phase : 0.05 M Pot.dihydrogen phosphate: ACN (50:50 v/v)
Temp : isocratic at 25°C ± 0.5°C
Flow rate : 1.2ml/min
Detector : PDA detector
Wavelength : 230-260 nm
Retention time : AML- 3.69 OLM -5.36
6. Chandan Kumar Giri et al. (2010)
“Simultaneous estimation of nebivolol hydrochloride and amlodipine besylate in combined tablet dosage form by q-analysis method”.
Method : Q-analysis method
Solvent : Methanol
54 7. Pournima S patil et al. (2011)
“RP-HPLC method for simultaneous estimation of Amlodipine besylate and olmesartanmedoxomil from tablet”.
Solvent : Methanol
Method : Absorption ratio method.
λmax : AML- 238 & 360 nm, NBL-281
Solvent : Methanol
Range : 2-10µg/ml of Indapamide
8. Chitlange et al. (2008)
“Stability Indicating RP- HPLC Method for Simultaneous Estimation of Valsartan and Amlodipine in Capsule Formulation”.
Elution : Isocratic elution.
Stationary phase : C-18 Column (Kromasil, 250 x 4.6 mm)
Mobile phase : Acetonitrile: (0.02M, pH 3.0) phosphate buffer (56:44v/v)
Flow rate : 1ml/min
Detector : UV detector
Wavelength : 234 nm
55 9. Priyanka R Patil et al. (2009)
“RP- HPLC Method for Simultaneous Estimation of Losartan potassium and Amlodipine besylate in Tablet Formulation.”
Elution : Isocratic elution.
Stationary phase : C-18 column
Mobile phase : 0.02%Triethylamine in water & acetonitrile (60:40)
Flow rate : 1ml/min
Detector : UV detector
Wavelength : 266 nm
Retention time : 10.10 min.
10.Prasad Rao et al. (2010)
“HPLC method for quantization of Amlodipine besylate and Metoprolol Succinate from bulk drug and pharmaceutical formulations”.
Elution : Isocratic
Stationary phase : Inertsil ODS-CV column
Mobile phase : 0.02 M phosphate buffer solution and acetonitrile as (80:20)
Flow rate : 1 ml/min.
Detector : PDA detector
56
2.2.2 REPORTED METHODS FOR INDAPAMIDE
1. Pawar et al. (2011)
“Quantitative Estimation of Indapamide by Ultraviolet Spectrophotome