WWJMRD 2018; 4(2): 244-251 www.wwjmrd.com
International Journal Peer Reviewed Journal Refereed Journal Indexed Journal UGC Approved Journal Impact Factor MJIF: 4.25 e-ISSN: 2454-6615
Abdel-Aziz A. A. Agricultural Engineering Department, Faculty of Agriculture, Ain Shams University Cairo, Egypt
Mona A. M. Soliman Water Relations and Field Irrigation Department, National Research Centre, Cairo, Egypt
El-Bagoury K. F. Agricultural Engineering Department, Faculty of Agriculture, Ain Shams University Cairo, Egypt
Sabreen Kh. Pibars Water Relations and Field Irrigation Department, National Research Centre, Cairo, Egypt
Eltohamy K. M.
Water Relations and Field Irrigation Department, National Research Centre, Cairo, Egypt
Correspondence: Eltohamy K. M. National Research Centre (NRC), Agricultural Division, Water Relations and Field Irrigation Dept.
33 El-Buhouth St., Dokki, Giza, Cairo, Egypt
Model for Irrigation Management by Implementing
the Two Crop Coefficient Approaches. 2. Model
Validating on Some Oil Crops under Surface and
Sub-surface Drip Irrigation
Abdel-Aziz A. A., Mona A. M. Soliman, El-Bagoury K. F., Sabreen Kh.
Pibars, Eltohamy K. M.
Abstract
This paper is the second of a two-part series, with the first part describing the IMC-Model, an interactive Irrigation Management model for growing Crops that follows the two Kc approaches (dual-Kc and Single-Kc) for computing the actual ETc and then irrigation management parameters. The IMC-Model was validated by carrying out field experiments under surface (SDI) and sub-surface drip irrigation (SSDI) for two growing summer seasons of 2015 and 2016, respectively, in sandy soil at the National Research Centre (NRC) farm, El-Nubaria, Beheira, Egypt. The validated experiment included the following treatments: a) three approaches for computing ETc (single-Kc, dual-Kc, and control), b) two irrigation systems (SDI and SSDI), and c) two oil-seed crops (peanut and sesame). Results of the investigation indicated that the IMC-Model is a proper solution for providing appropriate information for irrigation management. In addition, the results revealed that the seasonal cumulative ETc computed by dual-Kc approach overestimated that estimated by single-Kc under SDI by 13.20 % for peanut and 21.90 % for sesame. However under SSDI, the dual-Kc overestimated the single-Kc by 4.42 % for peanut and 17.64 % for sesame. Maximum yield for peanut (2.23 ton fed-1)
and sesame (0.66 ton fed-1) were obtained by the dual-kc under SSDI. Optimal water productivity for
peanut (0.66 Kg m-3) and sesame (0.23 Kg m-3) were obtained by dual-kc under SSDI. It can be
concluded that the IMC-Model is a proper solution for irrigation management. Additionally, the estimation of actual ETc using dual-Kc approach is more accurate compared with the single-Kc. It also could be maximize yield and improve water productivity by following the dual-kc approach under SSDI.
Keywords:Interactive model, crop evapotranspiration, dual crop coefficient, single crop coefficient, peanut, sesame, water productivity
1. Introduction
crop coefficient)3. The Kc is classified as single-Kc includes both evaporation from the soil surface and plant transpiration, while dual-Kc is expressed by the Ke and the basal crop coefficient (Kcb), separately11. The performance of the single-Kc or the dual-Kc depends on the precise selection of representative coefficient values for each of four crop growth stages (initial, crop development, mid-season, and late season), identification of the locally adjusted lengths of the growth stages, and precise estimation of ETo from weather parameters12. Peanut and sesame are very important cash crops for farmers in the world. This importance is due to the high nutritive value of their seeds which contain high amounts of edible oil, protein, and minerals13. According to Abou Kheira14, optimum seed yield of peanut requires adequate water during all growth stages, but there are some critical periods that are very sensitive to soil water content in root zone by compared with early vegetative and late maturity15. Improper water during these critical periods reduces yield noticeably and fails to maximize water productivity15. In the same trend, sesame is sensitive to water deficit at seedling (low root expanding), flowering, and seed filling stages and can lead to yield loss16. Hence, it is necessary to compute the actual ETc and then the irrigation interval13. The IMC-Model was developed to provide an accurate, quick, and easy information about irrigation management
for both experienced users and novice as farmers. Therefore, the objectives of this paper were: 1) validate The IMC-Model for computing daily actual ETc and then irrigation management parameters on some oil crops under surface and sub-surface drip irrigation; 2) Evaluate the precision of dual-Kc approach for estimating daily actual ETc and compare it with the single-Kc approach; and 3) Study the effect of the precise estimation of actual ETc on maximizing yield and improving water productivity.
2. Materials and methods 2.1. Site description
Two field experiments were conducted between May and October during 2014 and 2015, respectively, at the experimental farm of NRC, El-Nubaria, Beheira, Egypt (30.8667 N, 30.1667 E, and mean altitude 21-m above sea level) in order to validate the IMC-Model. Table 1 summarizes the average daily meteorological data for each month during the two growing seasons according to Central Laboratory for Agricultural Climate (CLAC). The soil texture is sandy and its samples were taken from 0 to 0.6 m during 2015 and 2016. The soil chemical and physical analysis are shown in Tables 2 and
3. Irrigation water was obtained from an irrigation channel, Nile water, going through the experimental site, with pH 7.3, and an electrical conductivity of 0.60 ds m-1
Table 1:Average meteorological data at the experimental site during the months of validation (CLAC, from 2015-2016):
Month Tmax Tmin RHmean u2 Ra P
(℃) (℃) (%) (m s-1) (MJ m-2d-1) (mm)
May 32.8 26.5 60.2 1.7 41.3 0.3 June 34.8 28.2 62.6 2.3 41.6 0.0 July 36.8 32.2 67.5 1.7 40.7 0.4 August 35.3 31.8 61.6 2.1 38.4 0.6 September 32.4 27.3 66.4 1.8 33.9 0.2
Tmaxand Tmin: maximum and minimum values of air temperature; RHmean:mean value of relative humidity;
u2: wind speed; Ra: extraterrestrial radiation; and P: precipitation.
Table 2:Some soil physical properties at the experimental site.
Depth Particle Size distribution, % Texture θS% on weight basis HC B.D. P
(cm) C. San F. Sand Silt Clay Class F.C. P.W.P A.W (cm h-3) (g cm-3) (%) 0-15 8.4 77.6 8.5 5.5 Sand 12.0 4.1 7.9 6.68 1.69 36.23 15-30 8.6 77.7 8.3 5.4 Sand 12.0 4.1 7.9 6.84 1.69 36.23 30-45 8.5 77.5 8.8 5.2 Sand 12.0 4.1 7.9 6.91 1.69 36.23 45-60 8.8 76.7 8.6 5.9 Sand 12.0 4.1 7.9 6.17 1.67 36.98
F.C.: Field capacity; P.W.P.: Permanent wilting point (FC and PWP) were determined as a percentage (w/w); AW: Available water; HC: Hydraulic conductivity; B.D.: Bulk density and P: Porosity.
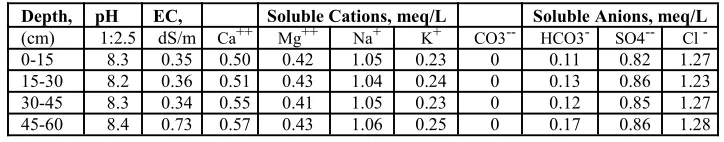
Table 3:Some soil chemical characteristics at the experimental site.
Depth, pH EC, Soluble Cations, meq/L Soluble Anions, meq/L
(cm) 1:2.5 dS/m Ca++ Mg++ Na+ K+ CO3-- HCO3- SO4-- Cl
-0-15 8.3 0.35 0.50 0.42 1.05 0.23 0 0.11 0.82 1.27 15-30 8.2 0.36 0.51 0.43 1.04 0.24 0 0.13 0.86 1.23 30-45 8.3 0.34 0.55 0.41 1.05 0.23 0 0.12 0.85 1.27 45-60 8.4 0.73 0.57 0.43 1.06 0.25 0 0.17 0.86 1.28
2.2. Crop types
Two crops, peanut (Arachis hypogaea L.) cultivar Giza-6, and sesame (Sesamum indicum L.) cultivar Shandauil-3, had cultivated as oil-seed crops for the validation purposes of the IMC-Model. The peanut and sesame were grown in north-south rows with 0.2 m spacing between plants and 0.7 m between rows. All plots of peanut sesame had been
Table 4.Standard values of Lengths, the basal (Kcb) and single (Kc) crop coefficients, crop height (h), and root depth (Zr) for the four growth stages of peanut and sesame17.
Stage Period days Kc Kcb h, m Zr, mm
I. Peanut
Initial stage 25-May: 18-Jun 25 0.40 0.15 0.14* 0.20 Development stage 19-Jun: 24-Jul 35 0.77* 0.62* 0.26* 0.49*
Mid-season stage 25-Jul: 7-Sep 45 1.15 1.10 0.40 0.80 Late season stage 8-Sep : 2-Oct 25 0.90 0.8 0.40 0.80
II. Sesame
Initial stage 25-May: 13-Jun 20 0.35 0.15 0.30* 0.10 Development
stage 14-Jun: 13-Jul 30 0.75* 0.60* 0.64* 0.20*
Mid-season stage 14-Jul: 22-Aug 40 1.15 1.05 1.0 0.30 Late season stage 23-Aug : 11-Sep 20 0.74 0.66 1.0 0.30 * The average stagey values which were computed using the IMC-Model program.
2.3. Experimental design and irrigation system
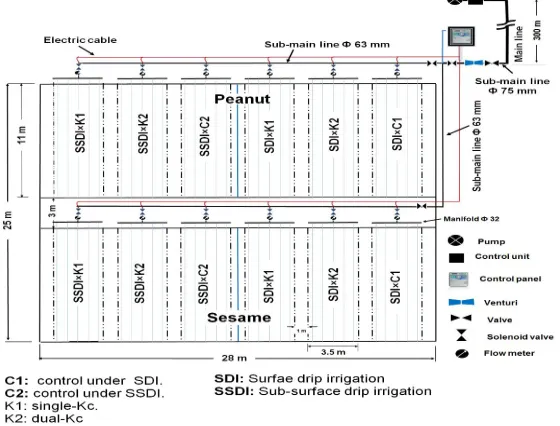
The field experiment was a split-plot design. The main plots were devoted to irrigation system treatments (SDI and SSDI). On the other hand, the three approaches for estimating daily actual ETc, single-Kc; dual-Kc; and control treatment which was recommended by Ministry of Agriculture, occupied the sub-plots. Therefore, two field plots of size (28 × 11) m2 with leaving 3 m between each other was selected for both peanut and sesame. Each plot was divided into two equal main plots of (12.5 × 11) m2for irrigation system treatments (SDI and SSDI) with leaving 1 m between these main plots as well as on both sides of the field. Each main plot of them was divided into three equal sub-plots of (3.5 × 11) m2 for the estimating ETc approaches (single-Kc, dual-Kc, and control) with leaving 1 m between them An automatic irrigation system was installed to apply the accurate irrigation depth needed by plants and at the appropriate time. The irrigation network consists of a centrifugal pump with 100 m3 h-1 discharge and control head (filters unit, pressure regulator, pressure gauges, flow-meter, and control valves). A PE venturi of 1 inch, the range of suction capacity 34-279 L h-1, was used for fertilization purposes. The Mainline (110 mm diameter pipe-6 bar, PVC) was connected to sub-main pipes of (75 and 63 mm diameter-6 bar, PVC) to feed the manifold line which represents a treatment. Manifold lines (32 mm in diameter-6 bar, PVC) were connected to the sub-main line
through a solenoid valve and discharge gauge for each sub-plot. The 12-solenoid valves were directly connected to a control panel. Lateral lines (16 mm in diameter-4 bar, PE) with built-in emitters (discharge of 4 L h-1 at 1 bar operating pressure and 0.30 m emitters spacing) were used for SDI and buried 0.15 m below the soil surface for SSDI. The distance between laterals was 0.70 m with 11 m long. The layout of the experiment is shown in Fig. 1.
2.4. Water productivity
Water productivity is a measure of the irrigation water productivity i.e., the yield produced by a unit volume of irrigation water. Water productivity (Kg m-3) was estimating as following3:
Y Water productivity = 4.2 ETc
Where, Y = seed yield (Kg fed.-1), and ETc = actual crop evapotranspiration (mm).
2.5. Statistical analysis
3. Results and discussion
3.1. The performance of the two Kc approaches
The dual-Kc curve during the whole season for peanut and sesame is described in Fig. 2. In the initial stage, the evaporation from the soil surface (Es) was the predominant component of ETc and the Kcb was constant. Whereas, at the crop development stage, the Kcb was increasing other than the Ke which was decreasing. This is due to the development and expansion of the leaf surface. As a result of increasing the canopy cover, the number of stomata
increased and so was the Kcb. At the mid-season stage, the full canopy cover and transpiration rate were typically reached at a maximum rate. As the leaves mature and senescence set in, the number of leaves transpiring decreases and the crop curve decreases whenever the soil surface was moist, following rain or irrigation especially during the late season growth stages. This result is previously supported by Odhiambo and Irmak12 and Parekh18as described earlier by Allenet al.17
Fig. 2:Ke, Kcb, and dual-Kc curves after irrigation during the whole season for (a) peanut and (b) sesame during 2015-2016. Fig. 3 illustrates the differences between both dual-Kc and
single-Kc curves during the growing season for peanut and sesame crops. In the initial period, it is noticed that the dual-Kc values were higher than single-Kc but the increasing rate was decreased gradually during the crop development stage and became unnoticed during both mid-and late season stages respectively as previously observed by Parekh18 whose revealed that maximum differences between single-Kc and dual-Kc were observed at the initial stage. This is maybe because of the effect of the
evaporation from the soil, which was taken in consideration in dual-Kc approach, was the prevailing component of ETc in the initial period. On the contrary, the Ke value was decreased gradually during crop development stage and became at the mid-season stage at a minimum rate. At the same time, the full canopy cover was reached at a maximum rate. Hence, the curves of dual-Kc and single-Kc were closer at the mid-season. This result is in agreement with that introduced by Odhiambo and Irmak9.
Stage Initial stage Development stage Mid-season Late season
days 25 35 45 25
Stage Initial stage Development stage Mid-season Late season
Fig. 3:Dual-Kc, and single-Kc curves after irrigation during the whole season for (a) peanut (b) sesame during 2015-2016.
3.2. Actual crop evapotranspiration
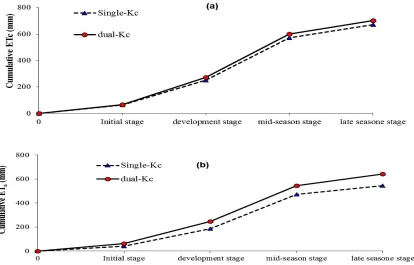
3.2.1. The cumulative ETc: The seasonal cumulative actual ETc computed by dual-Kc and single-Kc under SDI and SSDI for peanut and sesame are illustrated in both Fig. 4 and 5. The cumulative ETc estimated by single-Kc approach under SDI and SSDI were equal. On the contrary, the cumulative ETc estimated by dual-Kc under SDI overestimated it under SSDI for peanut and sesame crop. This result indicates that the cumulative ETc estimated by
single-Kc was not affected by the irrigation system. The dual-Kc approach overestimated the cumulative ETc estimated by single-Kc under SDI by 13.20 % for peanut and 21.90 % for sesame. while under SSDI, The dual-Kc overestimated the single-Kc by 4.42 % for peanut and 17.64 % for sesame. This result is in agreement with that mentioned by Odhiambo and Irmak12, Silva et al.19, and Paçoet al.20.
Stage Initial stage Development stage Mid-season Late season
days 25 35 45 25
Stage Initial stage Development stage Mid-season Late season
Fig. 4:Cumulative ETc estimated by single-Kc and dual-Kc approaches for (a) peanut and (b) sesame under SDI.
Fig. 5:Cumulative ETc estimated by single-Kc and dual-Kc approaches for (a) peanut and (b) sesame under SSDI.
3.2.2. The effect on seed yield and water productivity: The estimation of actual ETc according to single-Kc and dual-Kc approaches were compared with the control treatment as presented in Table 6. It could be indicated that the obtained seed yield and the recorded water productivity for peanut and sesame from the single-Kc and dual-Kc approaches overestimated the control treatment. It can be
Table 6:The effect of the three approaches for estimating ETc on seed yield for peanut and sesame.
Yield (ton fed-1) Water productivity (Kg m-3)
Treatments peanut sesame peanut sesame
Control 1.72c 0.51c 0.43 0.14 single-Kc 1.91b 0.55b 0.60 0.21 dual-Kc 2.14a 0.65a 0.62 0.22 Average 1.92 0.57 0.55 0.18
3.3. Irrigation system (SDI and SSDI)
3.3.1. The effect on seed yield and water productivity: Data presented in Table 7 revealed that the obtained seed yield was significantly affected by irrigation system for both peanut and sesame crops. It is clear that the obtained seed yield for peanut and sesame under SSDI overestimated those under SDI by 0.12 ton fed-1(6.06 %) and 0.04 ton
fed-1 (6.78 %) respectively. This tendency is in harmony with those mentioned by Patel and Rajput1. In the same trend, the recorded values of water productivity for peanut and sesame under SSDI overestimated those under SDI by 0.06 Kg m-3 (10.35 %), and 0.02 Kg m-3 (10.53 %) respectively.
Table 7:The effect of irrigation system (SDI and SSDI) on seed yield and water productivity for peanut and sesame.
Yield (ton fed-1) Water productivity (Kg m-3)
Treatments peanut sesame peanut sesame
SDI 1.86b 0.55b 0.52 0.17 SSDI 1.98a 0.59a 0.58 0.19 Average 1.92 0.57 0.55 0.18 SDI, SSDI: Surface, and Sub-surface drip irrigation system.
3.4. The interaction between actual ETc and irrigation system:
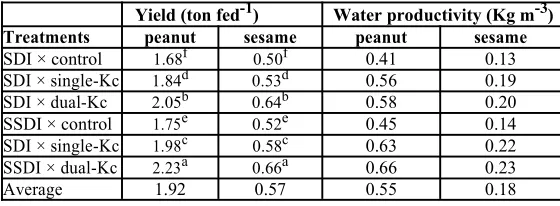
The effect on seed yield and water productivity: The obtained seed yield in response to the interaction between the irrigation system and the actual ETc computed by the two crop coefficient approaches (single-Kc and dual-Kc) were higher. According to the data presented in Table 8, the highest obtained values of seed yield for peanut (2.23 ton fed-1) and sesame (0.66 ton fed-1) were obtained from the interaction (SSDI × dual-Kc). While, the lowest values were obtained from the interaction (SDI × control) which were 1.68 ton fed-1, 0.50 ton fed-1 for peanut and sesame respectively. Therefore, the effect of the interactions between the irrigation system and ETc estimated by single-Kc and dual-single-Kc approaches on seed yield for both peanut and sesame could be arranged as the following ascending
orders: SDI × control < SSDI × control < SDI × single-Kc < SSDI × single-Kc < SDI × dual-Kc < SSDI × dual-Kc. In the same trend, the highest recorded values of water productivity for peanut (0.66 Kg m-3) and sesame (0.23 Kg m-3) were achieved with the interaction (SSDI × dual-Kc). On the contrary, the lowest values were recorded for the interaction (SDI × control) for peanut (0.41 Kg m-3) and sesame (0.13 Kg m-3) as presented in Table 8. Unlike seed yield, the effect of the interactions between the irrigation system and actual ETc estimated by single-Kc and dual-Kc approaches on water productivity for peanut and sesame could be arranged as the following ascending orders: SDI × control < SSDI × control < SDI × single-Kc < SDI × dual-Kc < SSDI × single-dual-Kc < SSDI × dual-dual-Kc.
Table 8:The effect of interaction between ETc and irrigation system (SDI and SSDI) on seed yield and water productivity for peanut and sesame.
Yield (ton fed-1) Water productivity (Kg m-3)
Treatments peanut sesame peanut sesame
SDI × control 1.68f 0.50f 0.41 0.13 SDI × single-Kc 1.84d 0.53d 0.56 0.19 SDI × dual-Kc 2.05b 0.64b 0.58 0.20 SSDI × control 1.75e 0.52e 0.45 0.14 SDI × single-Kc 1.98c 0.58c 0.63 0.22 SSDI × dual-Kc 2.23a 0.66a 0.66 0.23
Average 1.92 0.57 0.55 0.18
SDI, SSDI: Surface, Sub-surface drip irrigation system.
4. Conclusion
It can be concluded that the IMC-Model is a proper solution for irrigation management. In addition, some of the observed results can be summarized as follows:
a) The estimation of actual ETc according to dual-Kc approach is more accurate compared with the single-Kc approach.
b) The seasonal cumulative ETc estimated by dual-Kc overestimated that estimated by single-Kc under SDI by 13.20 % for peanut and 21.90 % for sesame. While under
for peanut and 17.64 % for sesame.
c) Seed yield: The highest seed yield of peanut (2.23 ton fed-1) and sesame (0.66 ton fed-1) were obtained with the interaction (SSDI ×dual-Kc) and the other interactions could be written as: SDI × control < SSDI × control < SDI × single-Kc < SSDI × single-Kc < SDI × dual-Kc. d) Water productivity: The optimal value of water productivity for peanut (0.66 Kg m-3) and
sesame (0.23 Kg m-3) recorded with the interaction (SSDI ×
5. References
1. Patel, N. and T.B.S. Rajput, 2008. Effect of subsurface drip irrigation on onion yield. Irrigation Science, 27: 97-108.
2. Hanson, B.R. and D.M. May, 2006. Crop coefficients for drip-irrigated processing tomato. Agricultural Water Management, 81:381-99.
3. Gao, Y., L. Yang, X. Shen, X. Li, J. Sun, A. Duan and L. Wu, 2014. Winter wheat with subsurface drip irrigation (SDI): Crop coefficients, water-use estimates, and effects of SDI on grain yield and water productivity. Agricultural Water Management, 146: 1-10.
4. Parekh, F., 2013. Crop water requirement using single and dual crop coefficient approach. IJIRSET, 2: 4493-4499.
5. Allen, R.G., I.A. Walter, R.L. Elliott, T.A. Howell, D. Itenfisu and M.E. Jensen, 2005b. The ASCE standardized reference evapotranspiration equation. The American Society of Civil Engineers of the Environmental and Water Resources Institute (ASCE-EWRI) Task Committee Report, Reston, Virginia, USA, 1-70.
6. Allen, R.G. and L.S. Pereira, 2009. Estimating crop coefficients from fraction of groundcover and height. Irrig. Sci., 28: 17-34.
7. Rosa, R.D., P. Paredes, G.C. Rodrigues, I. Alves, R.M. Fernando, L.S. Pereira and R. G. Allen, 2012a. Implementing the dual crop coefficient approach in interactive software. 1. Background and computational strategy. Agric. Water Manage, 103:8-24.
8. Suleiman, A.A., S.C. Tojo and G. Hoogenboom, 2007. Evaluation of FAO-56 crop coefficient procedures for deficit irrigation management of cotton in a humid climate. Agricultural Water Management, 91: 33-42. 9. Bodner, G., W. Loiskandl, H. Kaulm, 2007. Cover
crop evapotranspiration under semi-arid conditions using FAO dual crop coefficient method with water stress compensation. Agricultural Water Management, 93: 85-98.
10. Allen, R.G., L.S. Pereira, M. Smith, D. Rase and J.L. Wright, 2005a. FAO-56 dual crop coefficient method for estimating evaporation from soil and application extensions. J. Irrig. Drain. Eng., 131: 2-13.
11. Allen, R.G., 2000. Using the FAO-56 dual crop coefficient method over an irrigated region as part of an evapotranspiration intercomparison study. J. Hydrol, 229: 27-41.
12. Odhiambo, L.O. and S. Irmak, 2012. Evaluation of the impact of surface residue cover on single and dual crop coefficient for estimating soybean actual evapotranspiration. Agricultural Water Management, 104: 221-234.
13. Ucan, K. and F. Killi, 2010. Effects of different irrigation programs on flower and capsule numbers and shedding percentage of sesame. Agricultural Water Management, 98: 227-233.
14. Abou Kheira, A.A., 2009. Macromanagement of deficit-irrigated peanut with sprinkler irrigation. Agricultural Water Management, 96: 1409-1420. 15. Reddy, T.Y., V.R. Reddy and V. Anbumozhi, 2003.
Physiological responses of groundnut (Arachis hypogea L.) to drought stress and its amelioration: a critical review. Plant Growth Regul, 41: 75-88. 16. Alizadeh, A., 2002. Soil, Water, Plants Relationship,
third ed. Emam Reza University Press, Mashhad, Iran, ISBN, 21: 964-6582.
17. Allen, R.G., L.S. Pereira, D. Rase and M. Smith, 1998. Crop evapotranspiration: Guidelines for computing crop requirements, United Nations, FAO, Irrigation and Drainage, Paper No. 56, Rome.
18. Parekh, F., 2013. Crop Water Requirement using Single and Dual Crop Coefficient Approach. International Journal of Innovative Research in Science, Engineering and Technology, 2: 4496-4498. 19. Silva, V.P.R., C.J.R. Borges, C.H.A. Farias, V.P.
Singh, W.G. Albuquerque and B.B. Silva, 2012. Water requirements and single and dual crop coefficients of sugarcane grown in a tropical region, Brazil. Agricultural Sciences, 3: 274-286.