EVALUATION OF THE EFFECT OF
ATORVASTATIN ON INSULIN SENSITIVITY
Dissertation submitted to
THE TAMIL NADU DR. M.G.R. MEDICAL UNIVERSITY
In partial fulfillment of the regulations
for the award of the degree of
M.D. BRANCH - I
GENERAL MEDICINE
GOVT. STANLEY MEDICAL COLLEGE & HOSPITAL
THE TAMIL NADU DR. M.G.R. MEDICAL UNIVERSITY
CHENNAI, INDIA
CERTIFICATE
This is to certify that the dissertation titled “EVALUATION OF THE EFFECT OF ATORVASTATIN ON INSULIN SENSITIVITY” is a original work done by Dr. A.SANTHI SELVI, Post-graduate in General Medicine at Govt. Stanley Medical College Hospital, Chennai – 1, which is to be submitted to The Tamilnadu Dr. M.G.R Medical University, Chennai – 32 towards the partial fulfillment of the requirement for the award of M.D. degree in General Medicine in March 2009.
Signature of the Unit Chief Signature of H.O.D. of Medicine
Dr. J. MOHANASUNDARAM,M.D., Ph.D., DNB D E A N
DECLARATION
I, Dr. A.SANTHI SELVI, solemnly declare that the dissertation titled
“EVALUATION OF THE EFFECT OF ATORVASTATIN ON INSULIN SENSITIVITY” is a bonafide work done by me at Government Stanley Medical College Hospital, during 2006 to 2009 under the guidance and supervision of my Unit Chief Prof . Dr. P. CHITRAMBALAM, M.D.,
The dissertation is submitted to The Tamil Nadu Dr. M.G.R. Medical University, towards partial fulfillment of requirement for the award of
M.D. Degree (BRANCH –I) in General Medicine.
ACKNOWLEDGEMENT
I sincerely wish to express my wholehearted gratitude to the Dean Stanley Medical College, Dr. J. MOHANASUNDARAM, M.D., Ph.D., DNB for permitting me to use this hospital clinical material for the study.
I am grateful to the Professor and Head of the Department of Medicine Prof. Dr.V.RUCKMANI, M.D., and I place on records my deep sense of gratitude to my Unit Chief and Guide Dr. P. CHITRAMBALAM, M.D., for his advice and timely suggestions in preparing this dissertation.
I also thank my Unit Asst. Professors Dr. NALINI KUMARAVEL M.D. and Dr.CHANDRA SEKAR, M.D., for their timely suggestions and guidance.
Lastly my gratitude and thanks to patients who were kind and co-operative.
CONTENTS
PAGE NO
1. INTRODUCTION 1
2. AIM OF THE STUDY 4
3. REVIEW OF LITERATURE 5
4. MATERIALS AND METHODS 31
5. RESULTS AND OBSERVATIONS 34
6. DISCUSSION 47
7. CONCLUSION 51
8. BIBLIOGRAPHY
9. ANNEXURE
INTRODUCTION
The 3-Hydroxyl-3 methyl glutaryl Coenzyme A (HMG CoA) reductase
inhibitors or statins have been a primary force in the management of
hypercholesterolemia for many years and are important in the primary and
secondary prevention of heart disease. However, increasingly it is being shown
that the statins have clinical benefits that appear to be greater than those one
would expect from improvement in the lipid profile alone. These pleotrophic
actions include direct effects on vascular tissue, kidney, bone and glucose
metabolism.
The hyperinsulinaemic / insulin resistant states is a metabolic condition
linked to widespread and heterogeneous clinical syndrome like hypertension,
obesity, type-2 diabetes, dyslipidaemia, atherosclerosis and coronary vascular
disease. About 25% of the non-diabetic population shows abnormalities of
insulin sensitivity and compensatory hyperinsulinaemia.
Diabetes affected 194 million people worldwide in 2003 and is estimated
to affect 299 to 333 million by 2025, according to International Diabetes
The South Asian population is known to be at risk of a atherosclerosis,
even though the subject does not have clinical evidence of coronary heart
disease.
In India, population is vast, and there is heterogenecity of origin or race,
geography and habit, socioeconomic status, dietary habits, methods of cooking
and preservation, use of pesticides etc. These factors along with known
variables like age, sex etc. influence lipid profile of individuals.
India is facing a diabetic explosion. It has the world’s largest diabetic
population about 25 million, and the number is predicted to rise to 35 million
by 2010 and to 57 million by 2025. The exact nature of the increase in
prevalence of type 2 diabetes is unknown, and both genetic and lifestyle factors
are being blamed. The urbanization tendency of rural India puts the incidence
of diabetes with all its complications and mortality on the rise. Insulin
resistance is supposed to play a major role in the development of diabetes.
Considering the magnitude and severity of hyperinsulinaemic / insulin resistant
state, pharmaceutical measures are initiated early in an Indian.
Clinical trials and animal studies (invivo and invitro) have shown that
statins reduce cardiovascular disease risks and events, progression of
nephropathy, development of diabetes and fracture rates, these are benefits that
reduce the likelihood of persons progressing from impaired glucose tolerance
to type II diabetes.
Various studies have observed the effect of statins on insulin sensitivity
in Type 2 Diabetic mellitus. Since statins are commonly used for the treatment
of hypercholesterolemia in clinical practice, it is important to know their effect
AIMS AND OBJECTIVES
REVIEW OF LITERATURE
STATIN
The statins (or HMG-CoA reductase inhibitors) form a class of
hypolipidemic drugs used to lower cholesterol levels in people with or at risk
of cardiovascular disease. They lower cholesterol by inhibiting the enzyme
HMG-CoA reductase, which is the rate-limiting enzyme of the mevalonate
pathway of cholesterol synthesis. Inhibition of this enzyme in the liver
stimulates LDL receptors, resulting in an increased clearance of low-density
lipoprotein (LDL) from the bloodstream and a decrease in blood cholesterol
levels. The first results can be seen after one week of use and the effect is
maximal after four to six weeks.
Akira Endo and Masao Kuroda of Tokyo, Japan commenced research
into inhibitors of HMG-CoA reductase in 1971 (Endo 1992). This team
reasoned that certain microorganisms may produce inhibitors of the enzyme to
defend themselves against other organisms, as mevalonate is a precursor of
many substances required by organisms for the maintenance of their cell wall
The first agent isolated was mevastatin (ML-236B), a molecule
produced by Penicillium citrinum. The pharmaceutical company Merck & Co.
showed an interest in the Japanese research in 1976, and isolated lovastatin
(mevinolin, MK803), the first commercially marketed statin, from the mold
Aspergillus terreus. Dr Endo was awarded the 2006 Japan Prize for his work
on the development of statins.
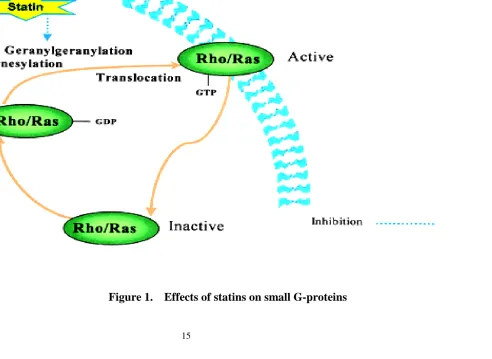
PATHWAYS OF ACTIVITY
Cholesterol is required in maintaining cellular membrane structure and is
also a precursor for the synthesis of steroid hormones and bile acid. The
mevalonate pathway (FIGURE 1) is the series of biochemical reactions leading
to the synthesis of cholesterol. The statins, by inhibiting HMG-CoA reductase,
block the rate-limiting step in this pathway, resulting in decreased cholesterol
production. Blocking cholesterol synthesis has been believed to be the statins'
primary mechanism of action. However, a number of cholesterol-independent
or pleiotropic effects of statins relate to their ability to block the synthesis of
important intermediate products.
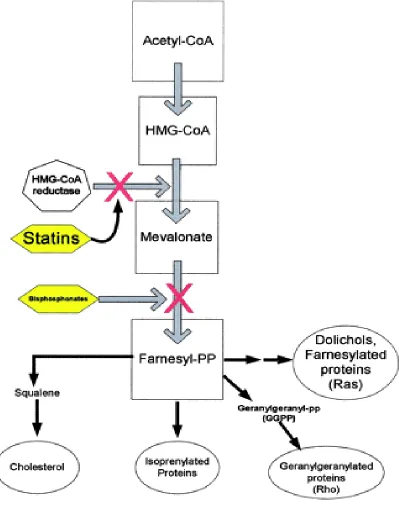
Intermediate products in the mevalonate pathway include isoprenoids
such as farnesylpyrophosphate and geranylgeranylpyrophosphate. The biologic
mechanism for most of the pleiotropic effects of statins is related to inhibition
proteins is necessary for cellular differentiation and proliferation, while the
Rho family is important for cytoskeleton formation, superoxide generation, and
cell growth progression.1 Blocking these important isoprenoid intermediates
affects mitochondrial respiration, lipid peroxidation, posttranslational
modifications of cellular proteins, modifications of certain tRNA, and
production of glycoproteins. Therefore, blocking of the mevalonate pathway by
ACTIONS OF STATINS
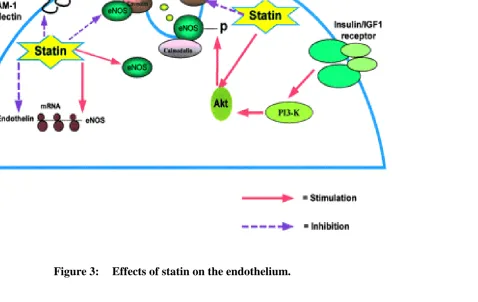
Statin therapy has been found to rapidly improve vasomotor response,
enhance coronary blood flow, and reduce the levels of adhesion molecules.
This is due in part to the ability of the statins to increase endothelial nitric
oxide production secondary to inhibition of Rho and the resulting up-regulation
of endothelial nitric oxide synthase (eNOS). Endothelial nitric oxide synthase
is the enzyme required for nitric oxide production. Through another unclear
mechanism, statins up-regulate the phosphatidylinositol 3'-kinase/Akt pathway
(PI3-kinase/Akt pathway). This also activates eNOS (fig 2). The antioxidant
effects of this group of drugs may also contribute to their ability to improve
endothelial function.2
Unstable atherosclerotic plaques are characterized by a lipid-rich core
and excess inflammatory cells. The release of matrix metalloproteases by
macrophages degrades plaque matrix connective tissue, weakening the fibrous
cap. This makes these plaques susceptible to rupture. Statins have been shown
to increase plaque stability by decreasing levels of metalloproteases,
collagen content in plaque matrix. Through the inhibition of Rho, lovastatin
has been shown to increase tissue plasminogen activator activity while
inhibiting plasminogen activator inhibitor type-1 activity. Thus, statins exert
Statins may exert anti-inflammatory effects by several pathways. The
isoprenoids have been shown to activate inflammation via intracellular second
messenger systems. Two other pathways include blocking the function of the
integrin lymphocyte function-associated antigen-1 (LFA-1) and action on the
phosphatidylinositol 3'-kinase/Akt signal transduction pathway. Disruption of
these pathways may inhibit lymphocyte recirculation, cell activation, and
T-cell migration. Other mechanisms yet to be fully elucidated may involve
inhibition of adhesion molecules and inhibition of interleukins 6 and 8. High
sensitivity C-reactive protein, a clinical marker of inflammation, is lower in
hypercholesterolemic patients on statin therapy.
Statins also affect gene expression. Increased gene expression of bone
morphogenetic protein-2 (BMP-2) through statin use resulted in increased bone
formation in animal studies. This drug group has been demonstrated to inhibit
the expression of class II major histocompatibility complex (MHC II) genes.
T-cell activation is dependent on interactions involving MHC. These findings
indicate that statins may be effective as immunomodulators. In addition, in
vitro studies with the HMG-CoA reductase inhibitors have demonstrated the
suppression of natural killer cells, inhibition of chemotaxis by monocytes,
regulation of DNA in cycling cells, and the inhibition of antibody-dependent
Statins modify several processes in the cell cycle. They have been shown
to synchronize tumor cells by blocking the transition of G1-S in the cell cycle,
thereby exerting antiproliferative effects. This is thought to be secondary to the
inhibition of geranylgeranylated proteins. The depletion of geranylgeranylated
proteins also appears to mediate statin induced apoptosis. Ras inactivation is
considered an important mechanism in the ability of statins to inhibit cell
signaling pathways associated with the invasive and metastatic properties of
cancer.
PLEIOTROPIC EFFECTS OF STATINS : LIPID REDUCTION
AND BEYOND
IMPACT ON CVD
Statins have been shown in primary and secondary prevention6 trials to
significantly reduce fatal and nonfatal CVD events. Cardiovascular benefits of
statins have been conventionally attributed to reduction of LDL-cholesterol.
However, subanalyses of large clinical trials suggest that statins also have
direct cardioprotective effects. For example, in WOSCOPS3, the time-to-event
curves began to diverge within 6 months of initiating therapy, an effect that is
shown larger significant CVD benefits associated with only minimal changes
in luminal dimensions on angiography, benefits that cannot be explained by
simple plaque regression . Statins also increase myocardial perfusion and
reduce recurrent anginal episodes after acute coronary events. Potential
mechanisms that may mediate these effects include modulation of endothelial
function, plaque stabilization, attenuated atherogenesis, and anti-inflammatory
and antithrombotic action3.
STATINS AND PLAQUE STABILIZATION
Most acute coronary events are due to disruption of unstable
atherosclerotic plaques, which result in thrombotic occlusion. These vulnerable
lesions occur in moderately stenotic vessels and are characterized by a
lipid-rich core and excess activated inflammatory cells . Macrophages release matrix
metalloproteases that degrade plaque matrix connective tissue, weaken the
fibrous cap, and render them susceptible for rupture . Statins have been shown
to decrease the levels of metalloproteases, oxidized-LDL (ox-LDL), core lipid
content, and macrophages and to increase collagen content in plaque matrix,
STATINS AND ENDOTHELIAL FUNCTION
Statins have beneficial effects on vascular endothelium and many of
these effects are mediated by the inhibition of small molecular weight
G-proteins of the Ras superfamily (Ras and Rho). These small molecular weight
G-proteins are involved in cell proliferation, differentiation, apoptosis,
migration, contraction, and regulation of gene transcription. Activated Ras/Rho
proteins are key components in signal-transducing kinase cascades involved in
NO production and glucose metabolism. Thus, inhibition of these proteins can
critically affect various cellular processes. The anchoring of these small
G-proteins to cell membranes requires prenylation; Ras G-proteins are farnesylated,
whereas Rho proteins are geranylgeranylated. Small G-proteins exist in an
inactive GDP-bound cytosolic form, and upon cellular activation they
exchange GTP and translocate to the active-membrane form (Fig.1). Lack of
protein isoprenylation leads to cytosolic sequestration and loss of biological
activity. Statins, in addition to lowering cholesterol by inhibiting HMG-CoA
reductase enzyme, also reduce cellular isoprenoid intermediates such as
dolichol, ubiquinone, farnesol, and geranylgeraniol (Fig.2). Statins, by
inhibiting isoprenylation, effectively lower membrane levels and activity of
Studies in humans and animals have demonstrated a positive effect of
statins on endothelial function. Basal and stimulated endothelium-dependent
forearm blood flow responses in hypercholesterolemic subjects are improved in
4 wk of treatment with statins.. Simvastatin has been reported to increase
endothelial NO production and improve NO-dependent vasorelaxation in
different vascular beds . Chronic administration of simvastatin or mevastatin to
rodents up-regulates endothelial NO synthase (eNOS) expression ,augments
blood flow in cerebral vessels, and reduces infarct size . These studies suggest
a direct action of the statins on NO production in the endothelium.
Nevertheless, a major mechanism of action of statins in improving
endothelial-derived vasorelaxation is through LDL-cholesterol lowering. Indeed, acute
lowering of LDL by apheresis has been shown to improve
Figure 2.
Cholesterol biosynthesis and mevalonate pathway. Bisphosphonates
eNOS resides in the caveolae and produces small amounts of NO on
demand in a transient fashion that is both calcium- and calmodulin-dependent.
In the caveolae, eNOS is bound to the caveolar protein, caveolin that inhibits
its activity. Elevations in cytoplasmic calcium promote binding of calmodulin
to eNOS that subsequently displaces caveolin, thus activating eNOS (Fig.3). In
addition to undergoing regulatory posttranslational modifications, eNOS is
regulated by a serine-threonine kinase, Akt. Akt is activated by insulin/IGF-I
binding to endothelial and vascular smooth muscle cells (VSMCs).
Phosphorylation by Akt increases the affinity of eNOS to calmodulin and
enhances the activity of eNOS. Statins activate Akt and thus increase NO
production. Statins also decrease cellular caveolin levels and attenuate the
inhibition of eNOS by caveolin, resulting in increased NO production. In
addition to affecting posttranslational regulatory mechanisms, statins increase
eNOS transcription, stability, and protein level. These class effects of statins
contribute to improved NO-mediated vascular relaxation.
Endothelial dysfunction is a hallmark of diabetes and insulin-resistant states
and is characterized by reduced effective vascular NO action . Statins
ameliorate the abnormal vascular relaxation and partially restore NO
production in the aorta of diabetic mice. Hyperglycemic states both in vivo
in increased vascular tone. The protective effect of statinson diabetic vascular
disease may be due to the suppression of Rho kinase cascades, resulting in
increased NO production anddecreased vascular tone. Statins not only increase
endothelialcell NO production but also up-regulate the inducible form ofNOS
(iNOS) in Vascular Smooth Muscle Cells. iNOS is expressed after vascular
injury, and induction of iNOS in these states may be beneficial in preventing
Statins also modulate the release and action of vasoconstrictors
(e.g. endothelin and angiotensin II). Clinical studies show that
hypercholesterolemic men have exaggerated hypertensiveresponses to infused
angiotensin II, and this response is reversed bystatins . In a study using double
transgenic rat model harboring the human renin and angiotensin genes,
cervistatin improved survival, decreased blood pressure, and reduced cardiac
hypertrophy . Statins also have a direct effect on endothelin-1 (ET-1)
production (Fig.3). These agents reduce, in a dose- and time-dependentfashion,
the expression of ET-1 in endothelial cells. This reduction is maintained even
in the presence of ox-LDL. Because ET-1 is a powerful vasoconstrictor,
decreasing ET-1 levels potentially reduces vascular resistance and improves
blood flow in coronaryand systemic vascular beds.
THE ANTI-INFLAMMATORY ACTIONS OF STATINS
The vascular inflammatory response is a complex process that leads to
thrombus formation, angiogenesis, neointimal thickening, and atherosclerosis
(4). Markers of inflammation such as C-reactive protein, IL-6, TNF-, and
monocyte-chemotactic protein-1 (MCP-1) have, in varying degrees, been
proposed as CVD risk factors. Recent evidence indicates that statins decrease
cholesterol reduction, and suggests that statins possess anti-inflammatory
actions.
Augmented expression of adhesion molecules on leukocytes
(e.g. CD11b) and endothelial cells (e.g. P-selectin, intracellular adhesion
molecule, ICAM-1) is necessary and critical in the early vascular response to
injury. Cytokines, in addition to enhancing cellular adhesion, promote
chemotaxis and stimulate vascular proliferation. Statins affect many of these
eventsin the inflammatory cascade by inhibiting receptor-dependentactivation
of signal-transducing cascades. In a rat model of coronary inflammation,
pravastatin reduces MCP-1 expression,monocyte infiltration, and proliferation.
Simvastatin reduces leukocyte rolling, adherence, and transmigration in a
rodent model of NO deficiency and attenuates endothelial adhesion molecule
and monocyte CD11b expression in the absence of lipid lowering (Fig.4).
Statin therapy reduced the levels of soluble P-selectin in patients with acute
coronary syndromes. In another rat model associated with elevated serum
levels of TNF- and IL-1ß, cerivastatin has been shown to reduce serumlevels
of these markers and improve survival rate. Statins also mediate the
suppression of cytokine and adhesion molecule expression by reducing NFkB
importance of statins in attenuating the inflammatory process and the
consequent impacton CVD risk reduction8.
STATINS AND OXIDATIVE STRESS
Oxidative stress is a result of altered balance in the relative
concentrations of oxidants and antioxidants. Ox-LDL is deleterious to
endothelial and Vascular Smooth Muscle Cells. It activates macrophages,
induces release of various cytokines, and increases endothelial adhesiveness
resulting in vascular injury and inflammation. Statins as potentantioxidants and
antiatherosclerotic agents are attractive therapeutic options for preserving
normal vascular function and blood flow.In several human and animal studies,
various statins have beenshown to: 1) inhibit the uptake and generation of
ox-LDL4, 2) attenuate vascular and endothelial superoxide anion formation by
inhibition of NADH oxidases via Rho-dependent mechanisms4; and 3) preserve
the relative levels of vitamin E,vitamin C, and endogenous antioxidants such
as ubiquinone andglutatione in LDL particles4. Thus, statins notonly decrease
oxidants but also restore antioxidants, thereby possibly reducing the level of
oxidative stress in the vascularmilieu, which may explain some of the observed
STATINS AND THROMBOSIS
Different statins have varying effects on prothrombotic factors, such as
tissue factor, tissue factor pathway inhibitor, platelet aggregation, blood and
plasma viscosity, fibrinogen, plasminogen activator inhibitor 1 (PAI-1), and
lipoprotein (a)4. Cellular expression of tissue factor in human macrophages is
suppressed by lipophilic statins. Statins normalize thrombin generation in
hypercholesterolemic patients and reduce platelet aggregation. Furthermore,
decreases in platelet aggregation after statintherapy may be partially related to
relative reductions in the cholesterol to phospholipid content in the platelet
membrane.
STATINS AND VASCULOGENESIS
Statins, in addition to modulating endothelial and vascularfunction, may
mediate neovascularization (vasculogenesis) and collectively contribute to the
reduction in recurrent CVD events. Increased vasculogenesis has been
demonstrated in rabbits treated with simvastatin via the activation of vascular
Akt4. Statins mobilize endothelial progenitor cells (EPCs) from the bone
marrow that play a role in maintenance vasculogenesis. Increased EPCs are
seen immediately after a coronary event and line the endothelium of
myocardial vessels. Indeed, statin therapyis associated with enhanced EPCs in
STATINS AND KIDNEYS
Statins have been shown to attenuate renal injury in both in vivo and in
vitro studies. Renal injury initiates inflammatorycascades that involve similar
cellular events as seen in vascular tissue. Statins inhibit key events in this
process that alter the progression of renal injury. In hyperglycemic
insulin-deficient diabetic rats, pravastatin ameliorates the structural and functional
changes of diabetic nephropathy13. Statinshave been demonstrated to decrease
TGF-ß production and suppress the enhanced Ras-dependent activation of
MAPK cascade(Fig.4). In another model of renalinjury due to overexpression
of Ang II, cerivastatin decreased systolic blood pressure, albuminuria, and
cortical necrosis. These changes were associated with reduced infiltration of
inflammatory cells, diminished expression of adhesion molecules, and lower
levels of transcription factor (NFkB) activity (Fig.4). In rats with
glomerulonephritis, simvastatin decreased mesangial cell proliferation and
monocyte/macrophage infiltration.
Statins have been shown to inhibit the proliferative actions of
platelet-derived growth factor and TGF-ß. Cytokines released during renal injury
activate NF-B and growth-regulatingpathways in mesangial and tubular cells.
Statins both decrease the levels of cytokines and inhibit the NF-B-dependent
urinary albumin excretion in patients with nephroticsyndrome and in patients
with type II diabetes4. Thus, statins modulate glomerular mesangial and
interstitial inflammatoryprocess independent of lipid reduction.
STATINS AND GLUCOSE METABOLISM
A retrospective analysis of the WOSCOPS examining the development
of new diabetes mellitus revealed that pravastatin therapy reduced the risk of
developing diabetes by 30%. This prevention in the onset of diabetes was
associated with significant reduction in triglyceride levels, but upon further
analyses the reduction in triglycerides did not account for the effect of statins
onthe development of diabetes14.
Statins may affect substrate delivery to insulin-sensitive tissues or
modulate insulin-activated signaling cascades that mediate glucose uptake.
Insulin increases skeletal muscle perfusion and substrate deliveryby enhancing
eNOS activity. As described previously, statinsalso increase eNOS expression,
which may result in increased capillary recruitment and glucose disposal .
Insulin activates a series of kinase cascades that involve PI3K and Akt,
resulting in the translocation of glucose transporters to cell membrane and
enhanced glucose uptake. This cascade is inhibited by circulating cytokines
Statins, like insulin, activate PI3K and Akt, which may play a role in
glucose uptake. Statins, in addition to decreasing cytokine levels,also inhibit
the cellular cascades such as Rho-kinase that inactivatethe insulin receptor and
signaling. NO is a potential intermediary, because it has been shown to
stimulate skeletal muscle glucoseuptake .
There is also evidence that statin mediated effects on fatty acid
metabolism influence glucose metabolism. The peroxisome proliferator
activator protein receptors are known to known to be major regulators of intra
and extracellular fatty acid metabolism, especially PPAR alpha (5). PPARs
belong to the superfamily of nuclear receptors that are ligand activated
transcription factors.
There is preliminary evidence that PPAR alpha activation would also
result in improved insulin sensitivity. A possible mechanism for this PPAR
alpha activation is the statin induced inhibition of Rho, which results in PPAR
alpha activation. This raises the possibility that atorvastatin positively affects
insulin sensitivity and help to prevent transition from impaired glucose
tolerance to manifest type 2 diabetes.
Inflammatory markers linked with insulin resistance is associated with
the development with type 2 diabetes in adults. The mechanism by which
proinflammatory cytokines may affect insulin receptor or impair insulin action
and secretion(11).
In the WOSCOPS study ,pravastatin was found to produce 30%
reduction in the risk of diabetes.The possible roles of pravastatin in the
development of diabetes are
1. The triglyceride lowering effect of pravastatin could reduce the
risk of developing insulin resistance. But other lipid lowering
agents do not appear to improve insulin resistance.3.
2. Pravastatin has been shown to reduce levels of interleukin 6 and
TNF –a through its anti - inflammatory effects. These cytokines
are known to inhibit lipoprotein lipase activity and to stimulate
lipolysis in adipose tissue . Pravastatin may therefore interrupt the
progression from central obesity to insulin resistance mediated by
adipose tissue – derived cytokines.
3. Impaired endothelial function has been shown to correlate with
insulin resistance. Pravastatin, by restoring endothelial function,
STATINS AND CHOLESTEROL
Insulin resistance and type 2 diabetes are associated with high
triglyceride and low HDL-cholesterol levels. Increased synthesis of VLDL
particles in the liver has been proposed the main cause of increased
concentrations of triglyceride-rich lipoproteins. This overproduction of VLDL
and triglycerides in the liver has been proposed to be driven by high levels of
serum free fatty acids in patients with insulin resistance.
Insulin resistance could explain the increase in cholesterol synthesis in
patients with obesity and type 2 diabetes6 .This hypotheses is supported by the
finding that in subjects with normal glucose tolerance, high glucose is linked to
increased cholesterol synthesis. Increased cholesterol synthesis is always
accompanied by low rates of cholesterol absorption. Therefore insulin
resistance is associated with high cholesterol synthesis and cholesterol
absorption. Because fasting insulin correlated with cholesterol synthesis
independent of the rates of BMI and whole body glucose uptake, it is possible
that regulation of cholesterol synthesis by hyperinsulinemia may be a link
between insulin resistance and cholesterol metabolism7.
Various studies have shown that insulin sensitizing effect of statins may
STATINS AND BONE REMODELING
Statins were also shown to stimulate bone formation in several studies.
In vitro, statins increase the number of osteoblasts and the amount of new bone
formation in mouse skull bones. Similar effects were also seen in vivo when
simvastatin or lovastatin was injected subcutaneously over the skull bone of
mice. Furthermore, oral administration of simvastatin to rats increased
trabecular bone volume and the rate of new bone formation. These findings
were confirmed by further studies; for example, transdermal lovastatin and
cerivastatin were shown to increase bone mass in rodents at doses similar to the
dose used in humapins in the treatment of hypercholesterolemia .All of these
findings illustrate positive effects of statins on bone remodeling in the form of
MATERIAL AND METHODS
SELECTION OF VOLUNTEERS
The study deals with the effect of Atorvastatin on insulin sensitivity
conducted at Hypertension outpatient department of Government Stanley
Medical College Hospital, Chennai. Ethical approval for the study was
obtained from the institutional ethical review board. Ninety patients are
screened for the study from a random population of 110 hypertensive patients
receiving atenolol as anti-hypertensive drug, by a random selection process,
from which 68 patients are considered based on patient compliance,
intelligence to understand dietary prescriptions and directions and whether free
from any other disease on initial medical testing. Written consent for the study
as per protocol is obtained.
The patients were randomized into two groups, of 34 patients each, by a
random selection process. The experimental group consisting of 34
dyslipidaemic and hypertensive patients receiving atorvastatin 10mg/day and
atenolol 50 mg/day at the Hypertension OPD at Govt Stanley Medical College
Hospital are chosen as volunteers and are compared with another group of 34
hypertensive patients receiving atenolol 50 mg/day only. Uniform diet pattern
INCLUSION CRITERIA
Dyslipidaemia, Hypertension, Age 40 to 50 years, not receiving any
drugs other than mentioned above, not suffering from any other diseases.
EXCLUSION CRITERIA
Those patients not satisfying the inclusion criteria are excluded.
CLINICAL CHARACTERS OF VOLUNTEERS
Clinically, both the groups show no abnormality, other than hypertension
in both groups, along with dyslipidaemia in the experimental group.
DATA COLLECTION
Height, Weight, BMI and blood pressure measurements were done and
other information collected with the help of predesigned questionnaire.
BIOCHEMICAL PARAMETERS
Fasting blood sugar, fasting insulin, fasting lipid profile (cholesterol,
triglyceride, HDL, LDL) were done by the standard methods.
Other parameters like liver function tests (LFT), total leukocyte count
(TLC), differential leukocyte count (DLC), haemoglobin (Hb), urea, creatinine,
total proteins, serum electrolytes, urine tests, electro-cardiograph (ECG), X-ray
COLLECTION OF BLOOD SAMPLES
Twelve hours fasting values are taken initially and at monthly intervals
for 1 year.
ASSESSMENT OF INSULIN SENSITIVITY
Insulin sensitivity was assessed by calculating Homeostasis model
assessment (HOMA –IR) as follows :
Fasting Insulin µ/ml x Fasting Glucose mg/dl 22.5
STATISTICAL METHODS
The statistical analysis is done based on paired t-test, and p-value is
RESULTS AND OBSERVATIONS
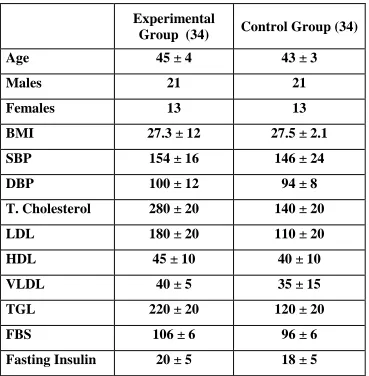
Table – 1 shows the anthropometric and biochemical characteristics of
the subject in the control and Atorvastin treated groups at the start of the study.
The proportion of the male & female in both the groups was similar.
Proportion of subjects having positive family history of diabetes and blood
pressure in both the groups were also similar.
It is found that in the group receiving atenolol and atorvastatin
(experimental group), TC is reduced from initial values of 280 +/- 20 mg/dl to
202 12 mg/dl (p = 0.05). HDLC is increased from 45 10 mg/dl to 52
+/-12 mg/dl (p = 0.04). LDLC reduced from 180 +/-20 mg/dl to 148 +/-+/-12 mg/dl
(p = 0.05). VLDLC, Triglycerides values remain almost same, and changes are
statistically insignificant. FBS values changed from initial 106 +/- 6 mg/dl to
88 +/-4 mg/dl (p = 0.04).
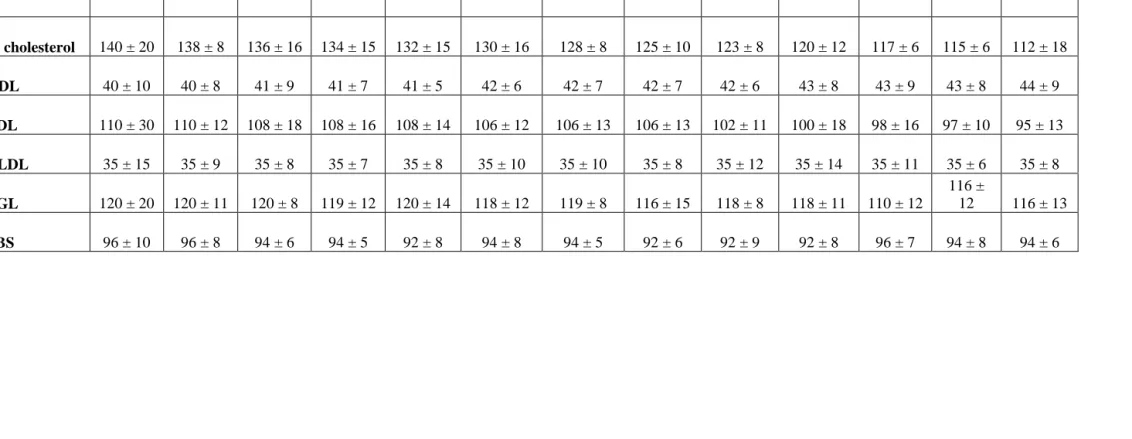
In the control group receiving atenolol only, it is observed that TC is
from initial values of 140 +/-20 mg/dl to 112+/-8 mg/dl. HDLC changes from
40 +/-10 mg/dl to 44 +/-9 mg/dl. LDLC changes from 110 +/-30 mg/dl to 95
+/-13 mg/dl. VLDLC, TG and FBS values remain almost same, and all the
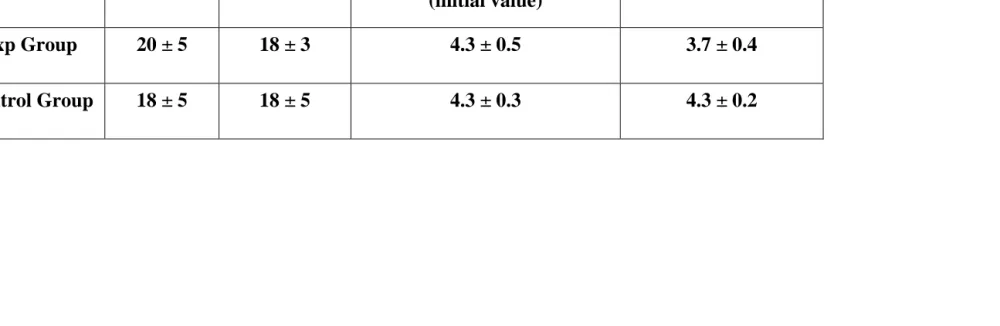
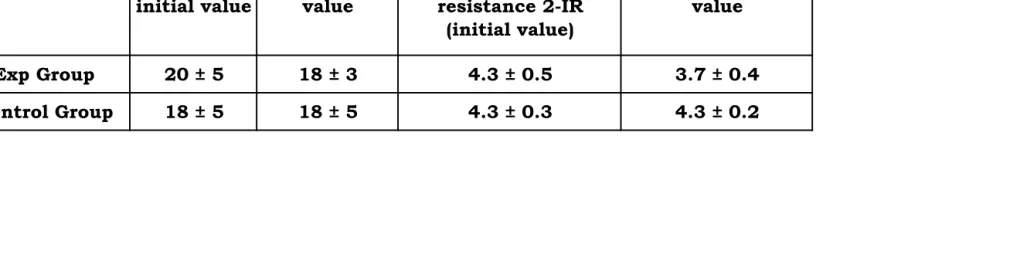
value changes are statistically insignificant. Table 4 shows serum insulin and
different groups, in order to determine insulin sensitivity. It was observed that
in the experimental group, serum insulin value initially is 20 +/-5 microU/ml
and finally is 18 +/-3 microU/ml (p = 0.03), and in the control group, serum
insulin value initially is 18 +/-5 microU/ml and finally is 31 +/-2 microU/ml.
HOMA 2 values (insulin resistance or IR) of the two groups of patients show
that in the experimental group it was 4.3 0.5 microU/ml initially and 4.3
Table 1: Anthropometrical, Clinical and Biochemical characters of
volunteers
Experimental
Group (34) Control Group (34)
Age 45 ± 4 43 ± 3
Males 21 21
Females 13 13
BMI 27.3 ± 12 27.5 ± 2.1 SBP 154 ± 16 146 ± 24 DBP 100 ± 12 94 ± 8 T. Cholesterol 280 ± 20 140 ± 20 LDL 180 ± 20 110 ± 20 HDL 45 ± 10 40 ± 10 VLDL 40 ± 5 35 ± 15 TGL 220 ± 20 120 ± 20
FBS 106 ± 6 96 ± 6
Table 2: Values of Blood parameters of Experimental Group
0 mon 1 mon 2 mon 3 mon 4 mon 5 mon 6 mon 7 mon 8 mon 9 mon 10 mon 11mon 12 mon
T.
cholesterol 2.80 ± 20 276 ± 18 270 ± 16 260 ± 15 256 ± 16 248 ± 18 240 ± 16 234 ± 12 226 ± 11 218 ± 13 212 ± 12 208 ± 10 202 ± 12
HDL 45 ± 10 45 ± 12 46 ± 12 46 ± 13 47 ± 12 48 ± 16 48 ± 8 49 ± 11 50 ± 14 50 ± 10 51 ± 13 51 ± 11 52 ± 12
LDL 180 ± 20 178 ± 18 17 ± 12 172 ± 11 172 ± 12 168 ± 18 166 ± 10 164 ± 8 160 ± 12 160 ± 8 158 ± 10 152 ± 8 148 ± 12
VLDL 40 ± 5 40 ± 3 40 ± 2 39 ± 6 39 ± 5 39 ± 6 39 ± 5 39 ± 4 39 ± 2 39 ± 4 39 ± 3 39 ± 4 39 ± 3
TGL 220 ± 20 218 ± 18 218 ± 16 214 ± 10 214 ± 8 216 ± 8 212 ± 10 210 ± 11 210 ± 12 206 ± 6 214 ± 8 208 ± 8 212 ± 6
Table 3: Values of Blood parameters of Control Group
0 mon 1 mon 2 mon 3 mon 4 mon 5 mon 6 mon 7 mon 8 mon 9 mon 10 mon 11 mon 12 mon
T. cholesterol 140 ± 20 138 ± 8 136 ± 16 134 ± 15 132 ± 15 130 ± 16 128 ± 8 125 ± 10 123 ± 8 120 ± 12 117 ± 6 115 ± 6 112 ± 18
HDL 40 ± 10 40 ± 8 41 ± 9 41 ± 7 41 ± 5 42 ± 6 42 ± 7 42 ± 7 42 ± 6 43 ± 8 43 ± 9 43 ± 8 44 ± 9
LDL 110 ± 30 110 ± 12 108 ± 18 108 ± 16 108 ± 14 106 ± 12 106 ± 13 106 ± 13 102 ± 11 100 ± 18 98 ± 16 97 ± 10 95 ± 13
VLDL 35 ± 15 35 ± 9 35 ± 8 35 ± 7 35 ± 8 35 ± 10 35 ± 10 35 ± 8 35 ± 12 35 ± 14 35 ± 11 35 ± 6 35 ± 8
TGL 120 ± 20 120 ± 11 120 ± 8 119 ± 12 120 ± 14 118 ± 12 119 ± 8 116 ± 15 118 ± 8 118 ± 11 110 ± 12
116 ±
12 116 ± 13
Table 4: Showing serum insulin and HOMA-IR 2 values of Different group
S. insulin initial
value
S. insulin end value
Homeostasis model assessment of insulin
resistance 2-IR (initial value)
HOMA - 2 IR end value
Exp Group 20 ± 5 18 ± 3 4.3 ± 0.5 3.7 ± 0.4
Comparison of different variables between experimental groups and Control Groups
Comparison of Total Cholesterol between Experimental and Control groups on 0 month
0 50 100 150 200 250 300 Variables C h o le s te ro l m g /d l Experimental Control
Comparison of Cholesterol between Experimental and Control groups on 1 year
Comparison of LDLC between Experimental and
Control groups on 0 month
0 20 40 60 80 100 120 140 160 180 200 Variables L D L C m g /d l Experimental Control
Comparison of LDLC between Experimental and
Control groups on 1 year
Comparison of HDLC between Experimental and Control groups on 0 month
37 38 39 40 41 42 43 44 45 46 Variables H D L C m g /d l Experimental Control
Comparison of HDLC between Experimental and
Control groups on 1 year
Comparison of VLDLC between Experimental and Control groups on 0 month
32 33 34 35 36 37 38 39 40 41 Variables V L D L C m g /d l Experimental Control
Comparison of VLDLC between Experimental and Control groups on 1 year
Comparison of TGL between Experimental and Control groups on 0 month
0 50 100 150 200 250 Variables T G L m g /d l Experimental Control
Comparison of TGL between Experimental and Control groups on 1 year
Comparison of FBS between Experimental and Control groups on 0 month
90 92 94 96 98 100 102 104 106 108 Variables F B S m g /d l Experimental Control
Comparison of FBS between Experimental and
Control groups on 1 year
Comparison of Insulin between Experimental and Control groups on 0 month
17 17.5 18 18.5 19 19.5 20 20.5 Variables In s u li n m g /d l Experimental Control
Comparison of Insulin between Experimental and Control groups on 1 year
DISCUSSION
The study shows that atorvastatin increases insulin sensitivity in normal
subjects. Compared with placebo, treatment with atorvastatin (10 mg/day)
resulted in significant reduction in the HOMA index. In addition, significant
reductions in total and LDL cholesterol concentrations were observed in the
atorvastatin group. It thus corroborates previous findings that though uncertain,
statin therapy can affect insulin resistance syndrome.14.
Insulin Resistance refers to the reduction in insulin mediated glucose
uptake in insulin sensitive tissues, specifically in the skeletal muscles. As a
compensatory response, hyperinsulinemia ensures to maintain normal blood
glucose levels. In epidemiological studies, fasting insulin level is commonly
used as a surrogate marker of insulin resistance.14.
In normoglycemic subjects, fasting insulin correlated well with whole
body glucose uptake. Although fasting insulin is a reasonable measure of
insulin resistance, it is potentially confounded by variability in insulin
secretion. Thus the indexes derived from fasting insulin and glucose, such as
Homeostasis Model Assessment (HOMA), the Quantitative Insulin Sensitivity
Check Index (QUICKI), and the Insulin Sensitivity Index (ISI) developed by
Gutt and coworkers, have been more widely used to assess insulin resistance in
Although the role of insulin resistance in the pathophysiology of type 2
diabetes mellitus is well accepted, the relationship between insulin resistance
and blood pressure remains controversial. Nearly 40 years ago, Welborn and
colleagues observed that non diabetic patients with essential hypertension had
significantly higher plasma insulin concentrations than did normotensive
individuals.
Statins are the more effective LDL – cholesterol-lowering drugs by
about 25% to 60%. In addition, they also increase HDL-cholesterol by about
5% to 10% and decrease triglycerides by about 10% to 30%. The effect on
triglycerides is proportional to the decrease in LDL-cholesterol. Pre diabetes
and type 2 diabetes are characterized with low grade inflammation. Aggressive
lowering of LDL-cholesterol by atorvastatin decreases hsCRP by 42% vs 9.6%
with placebo. Several studies have proved that LDL-reduction by statins is
associated with improved endothelial function due to enhanced NO
release.Besides these actions ,the reduction in risk of development of diabetes
Okyima et. al suggest that statins could have some impact on insulin
action, and, to estimate the direct effects of statins on insulin secretion from
pancreatic beta cells, MIN6 cells were treated with pravastatin, simvastatin or
atorvastatin. Basal insulin secretion at low glucose concentration was
unexpectedly increased at very high doses of simvastatin or atorvastatin after
24 and 48 hours of incubation, though insulin secretion was apparently
decreased by these lipophilic statins.18.
Yoshitomi et al. assessed the relationship between IR and the changes of
lipid profile in patients with hyperlipidaemia treated by atorvastatin. The IR did
not affect the degree of reduction in cholesterol by atorvastatin in non-diabetic
subjects. The IR may influence hypertriglyceridaemia greater than the effect of
atorvastatin in non-diabetic subjects.20
It has been suggested that HMG Co-A reductase inhibitors (‘statins’)
may reduce the risk of developing type 2 Diabetes mellitus. Yee et al.
designed to evaluate whether use of statins would also delay progression to
insulin therapy. After multivariate adjustment, however, statin use was
associated with a 10-month delay before newly treated diabetic subjects needed
Poalisso G et al. observed that statins administration was associated with
an improvement of insulin resistance and decline in plasma triglyceride
concentrations.
This study suggest that statins increase insulin sensitivity even in
CONCLUSION
1. Statins improve insulin sensitivity even in normoglycemics and
prevent the progression of IGT to type 2 diabetes.
2. Statins reduce levels of interleukin 6 and TNF through its
anti-inflammatory activity. These cytokines inhibit lipoprotein lipase
activity and to stimulate lipolysis in adipose tissue. Atorvastatin may
therefore interrupt the progression from central obesity to insulin
resistance mediated by the adipose tissue derived cytokines.
3. Impaired endothelial function has been shown to correlate with insulin
resistance. Atorvastatin by restoring endothelial function, may
beneficially affect glucose and insulin transport.
4. Since statins are used for the treatment of hypercholesterolemia in
clinical practice, it is important to know their effect on insulin
sensitivity. If further studies confirm the observation that statins
improve insulin sensitivity and reduce the onset of type 2 diabetes, the
perceived benefit of cardiovascular intervention in clinical trials could
be greatly increased and the long term cost-benefit analysis of those
interventions may be more positive than previous studies have
BIBLIOGRAPHY
1. Mcfarlane S et al. Pleotropic effects of statins: Lipid reduction and
beyond. Journal of clinical endocrinology 2002;879(4); 1451-1458
2. Wolfrum et al. Endothelium dependent effects of statins . Arterioscler
Thromb Vasc Biol;2003;23(5).729-736
3. Freeman et al. Pravastatin and development of diabetes.West of
Scotland Coronary Prevention Study .Circulation.2001;103;(3);357-362
4. Ikeda et al. Pleotropiceffects of statins on vascular tissue. Current Drug
Targets Cardio Haematology Disorder.2001;1(1);51-58
5. Waldman et al . Pleotropic effects of statins. Drugs. 2003;63(2);139-152
6. Shepherd et al.Prevention of coronary artery disease with pravastatin in
hypercholesterolemia.1995 NEJM303.1301-1307.
7. Tonolo et al .Additive effects of simvastatin beyond its effect on
LDLcholesterol in hypertensive type 2 diabetic patients.2000 Eur J Clin
30;980-987
8. Tedgui et al .Anti-inflammatory mechanisms in vascular
wall.Circulation. 2001.88:877 – 887
9. Perticone et al. Effects of atorvastatin on endothelial function of
10. Mcfarlane et al. Insulin resistance and cardiovascular disease.Journal of
Clinical Endocrinology 2001. 86; 713-718.
11.Jialal et al.Effect of statin on high sensitive Creactive protein.
Circulation.2001. 103; 1933-1935.
12.Albert et al.Effect of Statins on C-reactive protein. PRINCE trial
JAMA2001.286; 64-70
13.Yokota et al. Mechanism of preventive effect of statins on diabetic
nephropathy. Kidney International journal. 1999; 71; 178-181.
14.Recent advances in our understanding of insulin action and insulin
resistance. Le Roith et al. Diabetes Care.2001.24;503-508.
15.Gill et al.Difficult diabetes. Oxford ;Blackwell science ;2001
16. King et al.Global burden of diabetes. Diabetes care.1998.21(9).1414-31.
17.Parhoefer et al. Atorvastatin aids insulin sensitivity in metabolic
syndrome. American journal of Cardiology2006;98;66-69.
18.Okajima et al. Effects of statins on insulin secretion from a beta cell line,
19. Takono et al. Effects of statins on glucose tolerance in type 2 diabetes
mellitus.AtheroscleroThromb 2006.13(2);95-100.
20.Yoshitomi et al .Relationship between insulin resistance and effect of
atorvastatin in nondiabetic subjects. Atherosclero Thrombosis.2005;
12(1); 9-13.
21.Yee et al. Statin use in type 2 diabetes is associated with a delay in
starting insulin.Diab Med. 2004.21(9);962-7.
22.Jick et al.Statins and newly diagnosed diabetes. British journal of clinical
PROFORMA
Data collected from the participants
Name : Age : Sex : Occupation : Address : Weight
BMI SBP DBP Hb TC DC Urea Creatinine Electrolytes LFT
T.Proteins Urine analysis ECG
X-ray chest T.Cholesterol LDL-C(mg/dl) HDL-C(mg/dl) VLDL-C(mg/dl) TGL(mg/dl)
S.No. Name BMI T.cholesterol mg/dl LDLC mg/dl HDLC mg/dl VLDLC mg/dl TGL mg/dl FBS mg/dl S.insulin µU/ml
1 Munusamy 48 / m 26 156 / 100 282 194 48 42 210 105 21
2 Muthu 45 / m 25 160 / 90 285 202 42 46 215 109 20
3 Krishnan 46 / m 23 150 / 110 274 203 41 50 200 98 21
4 Pasupathy 49 / m 24 160 / 100 281 196 39 48 216 102 19
5 Moorthy 46 / m 27 152 / 90 292 194 49 38 215 108 19
6 Benjamin 46 / m 26 162 / 100 271 188 45 44 220 110 20
7 Murugesan 49 / m 26 156 / 90 282 192 44 40 202 98 18
8 James Raja 48 / m 24 160 / 100 275 201 40 46 216 108 22
9 Kalimuthu 45 / m 23 162 / 98 282 192 42 38 218 102 21
10 Ganesan 44 / m 26 166 / 92 268 206 48 36 226 95 19
11 Subbiah 49 / m 24 154 / 90 272 188 42 46 208 97 20
12 Karupiah 45 / m 24 152 / 94 284 202 51 48 220 101 18
13 Rajendran 46 / m 23 160 / 90 268 196 41 52 211 110 19
14 Kuppusamy 49 / m 25 156 / 96 288 188 42 56 210 106 21
15 Ramachandran 48 / m 20 162 / 96 288 192 48 42 206 98 20
16 Lakshmi 49 / F 24 150 / 90 276 182 47 38 210 92 21
17 Kamalammal 49 / F 24 154 / 90 276 196 46 48 217 102 20
SBP/DBP mmhg Age/Sex
S.No. Name BMI T.cholesterol mg/dl LDLC mg/dl HDLC mg/dl VLDLC mg/dl TGL mg/dl FBS mg/dl S.insulin µU/ml SBP/DBP mmhg Age/Sex
18 Vijaya 46 / F 26 160 / 90 280 201 48 52 210 105 21
19 Saroja 47 / F 21 154 / 96 296 190 48 48 216 109 20
20 Vasanthi 49 / F 24 160 / 100 274 188 46 38 198 108 21
21 Rajeswari 48 / F 24 150 / 110 278 196 49 36 202 102 19
22 Pushpa 45 / F 26 152 / 100 281 195 52 38 196 108 19
23 Jaya 44 / F 23 156 / 90 284 199 51 44 192 110 20
24 Dayalan 46 / m 24 162 / 110 278 192 46 46 204 102 18
25 Egambaram 48 / m 25 158 / 74 276 204 48 42 201 108 22
26 Munirajan 46 / m 27 164 / 90 284 203 46 42 197 92 21
27 Saraswathy 49 / F 24 162 / 98 288 205 45 38 192 95 19
28 Rajakumari 44 / F 24 160 / 100 292 198 49 40 195 99 20
29 Arockiyam 47 / m 26 160 / 90 282 196 46 46 204 101 21
30 Joseph 44 / m 27 164 / 94 272 204 47 50 203 116 20
31 Mariammal 49 / F 24 150 / 92 278 196 45 48 201 106 19
32 Saritha 47 / F 23 156 / 94 274 194 49 46 195 108 18
33 Govindan 44 / m 25 158 / 92 278 191 48 40 197 102 20
S.No. Name BMI T.cholesterol mg/dl LDLC mg/dl HDLC mg/dl VLDLC mg/dl TGL mg/dl FBS mg/dl S.insulin µU/ml
1 Lakshmi 44 / F 24 160 / 90 132 107 41 49 108 110 20
2 Mani 46 / m 26 154 / 90 121 111 36 52 112 98 16
3 Jayaraman 46 / m 25 160 / 100 112 108 42 51 123 85 15
4 Baskaran 45 / m 24 170 / 90 128 112 42 48 111 94 17
5 Kasi 44 / m 25 160 / 90 126 98 51 46 124 104 18
6 Pitchai 45 / m 24 170 / 110 132 100 54 45 112 106 17
7 Manickam 45 / m 24 150 / 100 127 102 48 49 119 98 19
8 Rathnam 46 / m 25 152 / 98 122 92 46 40 118 96 20
9 Jaya 44 / F 22 156 / 92 128 96 45 46 112 102 14
10 Nagammal 46 / F 23 158 / 94 112 98 49 50 108 104 16
11 Kuppusamy 46 / m 26 152 / 96 124 95 47 58 110 92 18
12 Sivaraman 45 / m 24 162 / 90 121 94 48 52 106 88 17
13 Surnammal 46 / F 21 152 / 100 120 98 45 54 110 94 19
14 Ranganayaki 47 / F 21 156 / 98 136 102 46 58 108 96 16
15 Vijayalakshmi 43 / F 22 162 / 100 120 106 48 48 112 98 17
16 Parvathi 46 / F 21 158 / 98 128 101 47 51 104 89 18
17 Sarasvathy 45 / F 21 156 / 102 132 88 48 42 116 98 18 MASTER CHART- CONTROL GROUP
Age/Sex SBP/DBP
S.No. Name BMI T.cholesterol mg/dl LDLC mg/dl HDLC mg/dl VLDLC mg/dl TGL mg/dl FBS mg/dl S.insulin µU/ml Age/Sex SBP/DBP mmhg
18 Laksmanan 46 / m 24 162 / 98 128 89 42 46 119 102 19
19 Jyothi 44 / F 22 154 / 98 136 92 41 50 108 96 17
20 Madhavan 45 / m 24 164 / 100 122 78 39 48 106 104 20
21 Rathnammal 46 / F 23 168 / 100 112 79 49 38 105 94 18
22 Subramanian 45 / m 21 170 / 100 108 92 45 44 116 88 16
23 Vinayagamurthy 46 / m 24 160 / 98 118 91 44 40 118 95 20
24 Ragavan 47 / m 23 150 / 90 126 94 40 46 112 94 19
25 Sankaran 44 / m 22 152 / 96 114 88 42 38 106 88 18
26 Chandra 44 / F 21 156 / 100 122 97 48 54 119 96 19
27 Indra 46 / F 22 160 / 90 130 102 47 49 121 98 19
28 Krishnamurthy 46 / m 24 154 / 100 126 88 51 48 118 90 17
29 Pushpa 45 / m 22 152 / 90 118 86 41 52 112 98 15
30 Shanmugam 45 / F 23 162 / 100 128 88 42 38 116 102 20
31 Shekar 46 / m 22 156 / 100 124 92 48 42 115 94 16
32 Arumugam 45 / m 21 152 / 98 128 94 47 48 109 98 18
33 Vel Murugan 46 / m 22 160 / 100 119 93 26 36 112 98 19
34 Ganesan 47 / m 23 162 / 98 122 95 42 44 115 88 18
BMI - Body Mass Index LDLC - Low Density Lipoprotein Cholesterol
SBP - Systolic Blood Pressure HDLC - High Density Lipoprotein Cholesterol
DBP - Diastolic Blood Pressure VLDLC - Very Low Density Lipoprotein Cholesterol
Experimental Group (34)
Control Group (34)
Age 45 ± 4 43 ± 3
Males 31 31
Females 13 13
BMI 27.3 ± 12 27.5 ± 2.1
SBP 154 ± 16 146 ± 24
DBP 100 ± 12 94 ± 8
T. Cholesterol 280 ± 20 140 ± 20
LDL 180 ± 20 110 ± 20
HDL 45 ± 10 40 ± 10
VLDL 40 ± 5 35 ± 15
TGL 220 ± 20 120 ± 20
FBS 106 ± 6 96 ± 6
[image:65.612.104.499.153.504.2]Fasting Insulin 20 ± 5 18 ± 5
Table 1:
0mon 1 mon 2mon 3mon 4mon 5mon 6mon 7mon 8mon 9mon 10 mon 11mon
T. cholesterol 2.80 ± 20 276 ± 18 270 ± 16 260 ± 15 256 ± 16 248 ± 18 240 ± 16 234 ± 12 226 ± 11 218 ± 13 212 ± 12 208 ± 10
HDL 45 ± 10 45 ± 12 46 ± 12. 46 ± 13 47 ± 12 48 ± 16 48 ± 8 49 ± 11 50 ± 14 50 ± 10 51 ± 13 51 ± 11
LDL 180 ± 20 178 ± 18 17 ± 12 172 ± 11 172 ± 12 168 ± 18 166 ± 10 164 ± 8 160 ± 12 160 ± 8 158 ± 10 152 ± 8
VLDL 40 ± 5 40 ± 3 40 ± 2 39 ± 6 39 ± 5 39 ± 6 39 ± 5 39 ± 4 39 ± 2 39 ± 4 39 ± 3 39 ± 4
TGL 220 ± 20 218 ± 18 218 ± 16 214 ± 10 214 ± 8 216 ± 8 212 ± 10 210 ± 11 210 ± 12 206 ± 6 204 ± 8 204 ± 8
FBS 106 ± 6 106 ± 5 105 ± 3 103 ± 4 103 ± 3 101 ± 4 98 ± 5 98 ± 6 96 ± 5 93 ± 4 92 ± 5 90 ± 3
12mon
202 ± 12
52 ± 12
148 ± 12
39 ± 3
202 ± 6
Table 3: Values of Blood parameters of Control Group
0mon 1mon 2mon 3mon 4mon 5mon 6mon 7mon 8mon 9mon 10 mon 11mon 12mon
T. cholesterol 140 ± 20 138 ± 8 136 ± 16 134 ± 15 132 ± 15 130 ± 16 128 ± 8 125 ± 10 123 ± 8 120 ± 12 117 ± 6 115 ± 6 112 ± 18
HDL 40 ± 10 40 ± 8 41 ± 9 41 ± 7 41 ± 5 42 ± 6 42 ± 7 42 ± 7 42 ± 6 43 ± 8 43 ± 9 43 ± 8 44 ± 9
LDL 110 ± 30 110 ± 12 108 ± 18 108 ± 16 108 ± 14 106 ± 12 106 ± 13 106 ± 13 102 ± 11 100 ± 18 98 ± 16 97 ± 10 95 ± 13
VLDL 35 ± 15 35 ± 9 35 ± 8 35 ± 7 35 ± 8 35 ± 10 35 ± 10 35 ± 8 35 ± 12 35 ± 14 35 ± 11 35 ± 6 35 ± 8
TGL 120 ± 20 120 ± 11 120 ± 8 119 ± 12 120 ± 14 118 ± 12 119 ± 8 116 ± 15 118 ± 8 118 ± 11 110 ± 12 116 ± 12 116 ± 13
Table 4:
S. insulin initial value
S. insulin end value
Homeostasis model assessment of insulin
resistance 2-IR (initial value)
HOMA - 2 IR end value
Exp Group 20 ± 5 18 ± 3 4.3 ± 0.5 3.7 ± 0.4
Control Group 18 ± 5 18 ± 5 4.3 ± 0.3 4.3 ± 0.2