Contents
Introduction—The Recommended First Step to Rules of Thumb in Reliability Engineering xiii
P A R T
I
THE BASICS OF MAINTENANCE
AND RELIABILITY
C H A P T E R
1
Understanding Maintenance
and Reliability
1.1. The Maintenance Function 3 1.2. Strategy to Achieve World-Class
Production through Reliability 3 1.2.1. Maintenance Approaches 4 1.2.2. Maintenance Management
Philosophy 4
1.2.3. The Function and Control System 5 1.2.4. What Is Maintenance? 5
1.2.5. Specification 6
1.2.6. The Maintenance Function 6 1.3. What Is Reliability? 8
1.3.1. Companies That Get It 8
1.3.2. Why Move Toward Proactive Work? 9 1.3.3. A New Way to View Failure 10 1.4. Maintenance/Reliability Assessment 10
1.5. Introduction to Change Management 14 1.6. Developing a Business Case for
a Reliability Initiative 16
1.7. Calculating Return on Investment 19 1.7.1. Leadership of the ROI Team 19 1.7.2. Case Study 19
1.8. Planning and Scheduling 21
C H A P T E R
2
The Functional Maintenance
Organization and Its People
2.1. Functional Maintenance Organizational Structure 27
2.2. Maintenance Supervisor 29 2.2.1. Responsibilities 29
2.2.2. Environmental, Health, and Safety Aspects 30
2.3. Maintenance Planner/Scheduler 30 2.3.1. Responsibilities 30
2.4. Maintenance and Engineering Manager 31 2.4.1. Responsibilities 31
2.4.2. Environmental, Health, and Safety Aspects 32
2.5. Area Manager of Warehouse and Inventory Control 32
2.5.1. Responsibilities 32 2.6. Reliability Engineer 33
2.6.1. Responsibilities 34 2.6.2. Job Skills 34
C H A P T E R
3
Preventive Maintenance Program
3.1. Reliability-Based Preventive Maintenance 37
3.1.1. Information Collection 38 3.1.2. System Analysis 38
3.1.3. Identification of Systems 38 3.1.4. Identification of System
Functions 38
3.1.5. Selection of Systems 38 3.1.6. System Functional Failure and
Criticality Rating 40 3.2. Identification of Functionally
Significant Items 40
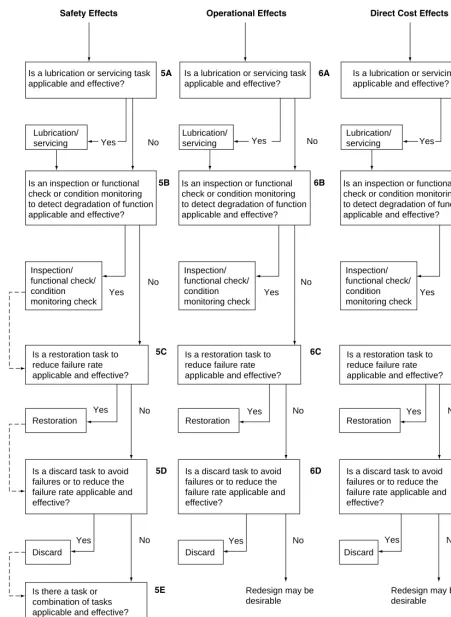
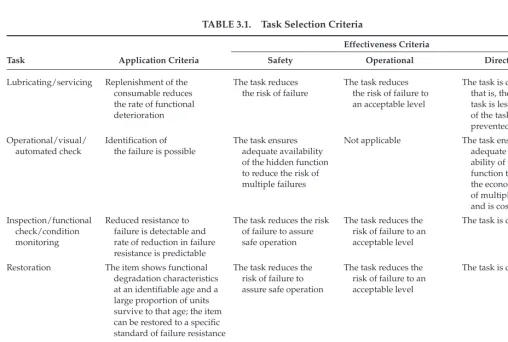
3.3. Maintenance Task Selection (Decision Logic Tree Analysis) 40
3.3.1. Levels of Analysis 41
3.3.2. Paralleling and Default Logic 43 3.4. Maintenance Tasks 43
3.5. Task Frequencies/Intervals 44
C H A P T E R
4
Predictive Maintenance Program
4.1. Setting Up a Preventive/Predictive Maintenance Program 49
4.2. Visual Inspection 50 4.3. Vibration Analysis 50 4.4. Thermography 53 4.5. Tribology 54 4.6. Ultrasonics 56
C H A P T E R
5
Reliability Processes
5.1. Reliability Software—Managing the Health of Assets 57
5.1.1. Building an Effective Asset Reliability Program 58
5.1.2. Using Reliability Software to Put the Program into Action 58
5.1.3. Using Handheld Devices to Collect and Upload Condition Inspection Data 59 5.1.4. Plotting Asset Health Trends 61
5.1.5. Capturing the Experts’ Knowledge about Asset Condition 61
5.1.6. Integration to Enterprise Asset Management and Computerized Maintenance Management Systems 62 5.1.7. The Bottom Line 63
5.2. Seven Questions Addressed by Reliability Centered Maintenance 63
5.3. Failure Mode and Effects Analysis 66 5.4. Equipment Criticality Analysis 68
5.4.1. Preparing for an Equipment Criticality Analysis 71 5.4.2. Conducting the Review 72
5.4.3. Analyzing the Assessment Results 75 5.4.4. Using the Output of the Equipment
Criticality Assessment 77 5.4.5. Conclusions 78
5.5. Root Cause Analysis 79 5.5.1. Plan 79
5.5.2. Do 81 5.5.3. Check 83 5.5.4. Act 86
C H A P T E R
6
Key Performance Indicators
6.1. Defining and Understanding KPIs 89 6.1.1. The Problem 90
6.1.2. John Day 91 6.1.3. The Solution 93 6.2. KPI Dashboards 93
6.2.1. Plant Manager Dashboard 93
6.2.2. Plant Management Team Dashboard 93 6.2.3. Production Manager (Supervisor)
Dashboard 94
6.2.4. Production Operator Dashboard 94 6.2.5. Maintenance Manager (Supervisor)
Dashboard 94
6.3. Measuring and Managing the Maintenance Function 95
6.3.1. Physical Asset Management 96 6.3.2. The Asset Reliability Process 97 6.3.3. Performance Metrics for the
Maintenance Function 99
6.3.4. Reliability Process Key Performance Indicators—Leading Measures 99 6.3.5. Work Identification 99
6.3.6. Work Planning 100 6.3.7. Work Scheduling 100 6.3.8. Work Execution 101 6.3.9. Follow-Up 101
6.3.10. Performance Analysis 101 6.3.11. Key Performance Indicators of
Maintenance Effectiveness (Result Measures) 102 6.3.12. The Importance of the Work
Order 103
6.3.13. Reporting and Use of Key Performance Indicators 103 6.3.14. Conclusion 104
C H A P T E R
7
Total Productive Maintenance
7.1. Introduction to Total Productive Maintenance 107
7.1.1. The TPM Organization 107 7.1.2. TPM Objectives 108
7.1.3. Autonomous Maintenance 108 7.1.4. Equipment Management 108 7.1.5. TPM Integration 108
7.1.6. TPM Is an Investment 108 7.1.7. Calculating Major Losses Is Key
to TPM’s Success 109 7.2. Lean Reliability 111
7.2.1. The Evolution from Lean
Manufacturing to Lean Maintenance to Lean Reliability 111
7.2.2. Managing Asset P erformance to Meet Customer Needs 112 7.2.3. The Basic Principles of Lean
Reliability 114
7.2.4. How Lean Reliability Aligns with TPM, Kaizen, Five S, and Six Sigma 117
7.2.5. Key Elements to Implement and Sustain Lean Reliability 119 7.2.6. Summary 120
P A R T
II
EQUIPMENT AND PROCESSES
C H A P T E R
8
Chain Drives
8.1. Chain Selection 124
8.1.1. Plain or Detachable-Link Chain 124 8.1.2. Roller Chain 124
8.1.3. Sprockets 124 8.2. Chain Installation 124 8.3. Power Train Formulas 125
8.3.1. Shaft Speed 125 8.4. Chain Length 126 8.5. Multiple Sprockets 126 8.6. Chain Speed 127
8.7. Preventive Maintenance Procedures 127
C H A P T E R
9
Hydraulics
9.1. Hydraulic Knowledge 129 9.2. Hydraulic Troubleshooter 129 9.3. General Maintenance Person 129 9.4. Best Maintenance Hydraulic
Repair Practices 130
9.5. Root Cause Failure Analysis 130 9.6. Preventive Maintenance 130 9.7. Measuring Success 132
9.8. Recommended Maintenance Modifications 133
C H A P T E R
10
Maintenance Welding
10.1. Shielded Metal Arc Welding (SMAW), “Stick Welding” 136
10.2. Flux-Cored Arc Welding (FCAW) 137 10.2.1. FCAW with Gas 137
10.2.2. FCAW Self-Shielded 137
10.3. Gas-Shielded Metal Arc Welding (GMAW) 141
10.3.1. GMAW for Maintenance Welding 141 10.3.2. Gas Selection for GMAW 141 10.4. Gas Tungsten Arc Welding (GTAW) 144 10.4.1. Applicability of GTAW 145 10.4.2. Advantages and Disadvantages
of GTAW 145
10.4.3. Principles of Operating GTAW 145 10.4.4. Polarity and GTAW 147
10.4.5. GTAW Shielding Gases and Flow Rates 147
10.4.6. Electrode Material for GTAW 148 10.4.7. GTAW Electrode Size and Tip
Shape 148
10.4.8. GTAW Electrode Holders and Gas Nozzles 149
10.4.9. Characteristics of GTAW Power Supplies 149
10.4.10. GTAW Torches 150
10.4.11. Manual GTAW Techniques 151 10.4.12. Establishing Welding Parameters
for GTAW 151
10.4.13. Gas Tungsten Arc Starting Methods 151
10.5. Oxyacetylene Cutting 151
10.6. Air-Carbon Arc Cutting and Gouging 152 10.6.1. Applications 153
10.6.2. Power Sources 154 10.7. Plasma Arc Cutting 155 10.8. Welding Procedures 157 10.9. Qualification of Welders 157 10.10. Plasma Arc Welding 157 10.11. Base Metals 157
10.11.1. The Carbon Steels 157 10.11.2. The Alloy Steels 158 10.11.3. The Nonferrous Metals 160 10.12. Control of Distortion 160
10.13. Special Applications 161
10.13.1. Sheet Metal Welding 161 10.13.2. Hard Surfacing 161
10.13.3. Resisting Abrasive Wear 161 10.13.4. Resisting Impact Wear 161 10.13.5. Types of Surfacing Electrodes 163 10.13.6. Choosing Hard-Facing Material 163 10.13.7. Check Welding Procedure 165 10.13.8. Check Before the Part Is
Completely Worn 165
10.13.9. Hard Surfacing with SAW 165 10.14. Selection and Maintenance of Equipment 167 10.14.1. Machines 167
10.14.2. Accessory Equipment 169 10.15. Installation of Equipment 169
10.16. Equipment Operation and Maintenance 170 10.16.1. Keep the Machine Clean and Cool 170 10.16.2. Do Not Abuse the Machine 170
10.16.3. Do Not Work the Machine Over Its Rated Capacity 170 10.16.4. Do Not Handle Roughly 170 10.16.5. Maintain the Machine
Regularly 170 10.17. Safety 172
C H A P T E R
11
Bearings
11.1. Types of Movement 175
11.1.1. About a Point (Rotational) 175 11.1.2. About a Line (Rotational) 175 11.1.3. Along a Line (Translational) 175 11.1.4. In a Plane (Rotational/
Translational) 178
11.2. Commonly Used Bearing Types 178 11.2.1. Plain Bearings 178
11.2.2. Rolling Element or Antifriction 182 11.2.3. Roller 185
11.3. Bearing Materials 187 11.3.1. Plain 188
11.3.2. Rolling Element 188 11.4. Lubrication 188
11.4.1. Plain Bearings 188
11.4.2. Rolling Element Bearings 189 11.5. Installation and General Handling
Precautions 190
11.5.1. Plain Bearing Installation 190 11.5.2. Roller Bearing Installation 190 11.5.3. General Roller-Element Bearing
Handling Precautions 192 11.6. Bearing Failures, Deficiencies, and
Their Causes 193
11.6.1. Improper Bearing Selection and/or Installation 193
C H A P T E R
12
Compressors
12.1. Centrifugal 199
12.1.1. Configuration 199 12.2. Performance 201
12.2.1. First Law of Thermodynamics 201 12.2.2. Second Law of Thermodynamics 202 12.2.3. Pressure/Volume/Temperature
12.2.4. Pressure/Compression 202 12.2.5. Other Performance Indicators 202 12.3. Positive Displacement 203
12.3.1. Rotary 203 12.4. Reciprocating 206
12.4.1. Configuration 207 12.4.2. Performance 210 12.4.3. Installation 210
12.4.4. Operating Methods 212 12.5. Troubleshooting 212
12.5.1. Centrifugal 212
12.5.2. Rotary-Type, Positive Displacement 212 12.5.3. Reciprocating, Positive
Displacement 216
C H A P T E R
13
Gears and Gearboxes
13.1. Spur Gears 225
13.2. Pitch Diameter and Center Distance 226 13.3. Circular Pitch 227
13.4. Diametrical Pitch and Measurement 227 13.4.1. Method 1 228
13.4.2. Method 2 228 13.5. Pitch Calculations 228 13.6. Tooth Proportions 229 13.7. Backlash 230
13.8. Other Gear Types 230 13.8.1. Bevel and Miter 230 13.8.2. Helical 231
13.8.3. Worm 232 13.8.4. Herringbone 233
13.8.5. Gear Dynamics and Failure Modes 233 13.8.6. Common Characteristics 235
13.9. Troubleshooting 236 13.9.1. Normal Wear 237 13.9.2. Abnormal Wear 237
C H A P T E R
14
Packing and Seals
14.1. Fundamentals 239
14.1.1. Shaft Seal Requirements 239 14.1.2. Sealing Devices 239
14.2. Mechanical Seal Designs 242 14.2.1. Single-Coil Spring Seal 242 14.2.2. Positive Drive 242
14.3. Installation Procedures 242 14.3.1. Packed Stuffing Box 243 14.3.2. Mechanical Seals 245 14.4. Troubleshooting 248
14.4.1. Mechanical Seals 248 14.4.2. Packed Boxes 249
C H A P T E R
15
Electric Motors
15.1. Bearing Frequencies 251 15.2. Imbalance 251
15.3. Line Frequency 251 15.4. Loose Rotor Bars 251 15.5. Running Speed 252 15.6. Slip Frequency 252
15.7. V-Belt Intermediate Drives 252 15.8. Electric Motor Analysis 252
P A R T
III
ADDITIONAL READINGS ON
MAINTENANCE AND
RELIABILITY
C H A P T E R
16
Reliability Articles
16.1. Top Five Reasons Why Companies Don’t Measure Reliability: It Seems Like Everyone Has an Excuse as to Why They Don’t Measure Reliability 255
16.1.1. Reason 1 255 16.1.2. Reason 2 255 16.1.3. Reason 3 255 16.1.4. Reason 4 255 16.1.5. Reason 5 256
16.2. Creating a Culture Change in Your Maintenance Department: Is Your Maintenance Crew in a Reactive Mindset? Check Out a List of Qualifiers to Find Out and Then Learn How to Change It 256
16.3. Exterminate Lube Problems: Grease and Oil Expertise Can Be a Serious Competitive Edge 257
16.3.1. Big, Bad, and Ugly 257
16.3.2. Make Lube Expertise a Specialty 258 16.3.3. Get the Job Done 260
16.4. What It Takes to Make the Climb from Reactive to RCM 260
16.4.1. Waving the Flag 261
16.4.2. Does Management Understand? 269 16.4.3. Who Owns Reliability? 270
16.4.4. Informal versus Formal PM Programs 270
16.4.5. To Measure Is to Manage 270 16.4.6. Depth of Understanding 271 16.4.7. Indicated Actions 272 16.4.8. Lessons Are Simple 273 16.5. Put a Plant-wide Focus on Functional
Failures 274
16.6. Reliability Is Worth a Second Look: Statistical Analysis and Time-Based Preventive
Maintenance Don’t Really Address the Ability to Perform—It’s Time to Get Familiar with the Definition of Reliability 275
16.7. When Preventive Maintenance Doesn’t Work 276
16.8. The Top Four Reasons Why Predictive
Maintenance Fails and “What to Do about It” 277 16.8.1. PF Curve 278
16.8.2. Reason 1: The Collection of PdM Data Is Not Viewed as Part of the Total Maintenance Process 278
16.8.3. Reason 2: The Collected PdM Data Arrives Too Late to Prevent Equipment Failures 279
16.8.4. Reason 3: Many Companies Fail to Take Advantage of Data from PLCs and DCSs 279
16.8.5. Reason 4: Most PdM Data Is Dispersed in Too Many Non-Integrated
Databases 280
16.8.6. Some Simple Guidelines Will Help to Get You Moving in the Right Direction 281 16.8.7. Summary 282
C H A P T E R
17
MTBF Users Guide
17.1. Understanding Definitions 283 17.2. The MTBF Process 283
17.3. Example 284
17.3.1. MTBF Percentage Change 284 17.3.2. Total Plant MTBF 284
17.4. Summary 284
A P P E N D I X
A
Workflow for Planning
A P P E N D I X
B
Checklists and Forms
Glossary 315
Introduction—The Recommended First Step to Rules
of Thumb in Reliability Engineering
Begin your journey with this introduction to reli-ability, making this book a great tool for you to be successful. We came up with the idea of the book so someone whose sole purpose in life is reliability can go to a simple book to quickly find answers to issues facing his or her organization. The answer my not be simple; however, the book provides direction for any-one needing an answer to most reliability issues. The first recommendation is to follow these steps:
Step 1. Find some education for yourself:
● Attend a one- or two-week RCM training workshop.
If you can, RCM training in your plant would be even better, so that part of the workshop could be applied to an asset in your plant.
● Attend a workshop on Maintenance Best Practices
and Key Performance Indicators.
● Attend training in Six Sigma.
● This sounds like a lot of training but it is not. A true
reliability engineer must have the tools required to accomplish the job, and very few universities offer real-world training and education.
Step 2. Educate management at your site in what truly is reliability and how it affects plant capacity, asset availability, and utilization.
Step 3. Read the article in Chapter 16 “Put a Plant-wide Focus on Functional Failures.”
Step 4. Take the maintenance/reliability assess-ment in the book (Chapter 1) and identify the gaps. Be honest with your answers.
Step 5. Rank the plant’s assets based on conse-quence and risk to the business (see Chapter 5).
Step 6. Develop a business case (see Chapter 1) and present it to executive leadership. This business case should include the cost of change, return on investment, project plan, and so forth. You want an
executive engaged in your reliability initiative. This is not a journey with an end. Reliability must become a way of life for the plant.
Step 7. Execute your plan. Be sure key performance indicators (see Chapter 6) are in place before you begin this journey in order to measure and manage the project and thus the results.
A few certifications are also recommended:
1. CPMM (certified plant maintenance manager). Go to www.afe.org for more information. This certification is an open book and can be given by your plant HR manager. This certification is a great education rather than a great certification. The book they send you is a very good reference book for the future.
2. RCM certified as an RCM facilitator. There are many sources for this training certification.
3. CMRP (certified maintenance and reliability profes-sional). Go to www.smrp.org for more information. This certification provides credibility to your posi-tion, and joining the Society for Maintenance and Reliability Professionals provides access to some great information.
4. Six Sigma black belt. This certification can be pro-vided by many sources.
1
Understanding Maintenance
and Reliability
1.1. THE MAINTENANCE FUNCTION The ultimate goal of maintenance is to provide optimal reliability that meets the business needs of the company, where reliability is defined as “the probability or dura-tion of failure-free performance under stated condi-tions.” Although many organizations view maintenance as adding little value to the firm, when properly devel-oped and managed, it preserves the company’s assets to meet the need for reliability at an optimal cost.
John Day, formerly the maintenance and engineering manager for Alumax Mt. Holly, was one of the best-known proactive maintenance management advocates and my mentor and manager for a number of years. John spoke all over the world about his model of proactive mainte-nance. His insight into what a successful plant considers “maintenance” provides us the section that follows.
1.2. STRATEGY TO ACHIEVE WORLD-CLASS PRODUCTION
THROUGH RELIABILITY*
Alumax of South Carolina is an aluminum smelter that produces in excess of 180,000 MT of primary alumi-num each year. It began operation in 1980 after a two-year construction phase. The plant is the last greenfield aluminum smelter constructed in the U.S. Alumax of
SC is a part of Alumax, Inc., which has headquarters in Norcross, Georgia; a suburb of Atlanta, Georgia. Alumax, Inc. is the third largest producer of primary aluminum in the U.S. and the fourth largest in North America.
The vision of general management was that the new smelter located on the Mt. Holly Plantation near Charleston, SC, would begin operations with a planned maintenance system that could be developed into a total proactive system. At the time in 1978–79, there were no maintenance computer systems available on the mar-ket with the capability to support and accomplish the desired objectives. Thus TSW of Atlanta, Georgia was brought on site to take not only the Alumax of SC main-tenance concepts and develop a computer system, but they were to integrate all the plant business functions into one on-line common data base system available to all employees in their normal performance of duties.
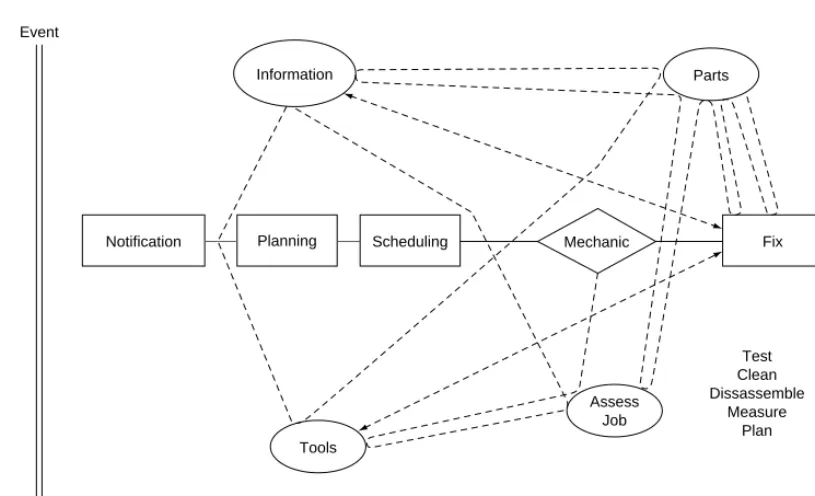
Since the development and initial operation of the Alumax of SC maintenance management system, it has matured and rendered impressive results. These results have received extensive recognition on a national and international level. The first major recognition came in 1984 when Plant Engineering magazine published a feature article about the system. Then in 1987 A. T. Kearney, an international management consultant headquartered in Chicago, performed a study to find the best maintenance operations in North America. Alumax of SC was selected as one of the seven “Best of the Best.” And in 1989, Maintenance Technology maga-zine recognized Alumax of SC as the best maintenance operation in the U.S. within its category and also as the best overall maintenance operation in any category. Mt. Holly’s proactive model is shown in Figure 1.1.
4 The Basics of Maintenance and Reliability
1.2.1. Maintenance Approaches
From a basic point of view there are two mainte-nance approaches. One approach is reactive and the other is proactive. In practice there are many com-binations of the basic approaches. The reactive sys-tem (see Figure 1.1) responds to a work request or identified need, usually production identified, and depends on rapid response measures if effective. The goals of this approach are to reduce response time to a minimum (the computer helps) and to reduce equipment down time to an acceptable level. This is the approach used by most operations today. It may well incorporate what is termed as a preven-tative maintenance program and may use proactive technologies.
The proactive approach (see Figure 1.2) responds primarily to equipment assessment and predictive procedures. The overwhelming majority of correc-tive, preventacorrec-tive, and modification work is gener-ated internally in the maintenance function as a result of inspections and predictive procedures. The goals of this method are continuous equipment performance to established specifications, maintenance of produc-tive capacity, and continuous improvement. Alumax of SC practices the proactive method. The comments which follow are based upon the experience and results of pursuing this vision of maintenance.
1.2.2. Maintenance Management Philosophy
Alumax of SC began development of the mainte-nance management concept with the idea that main-tenance would be planned and managed in a way that provides an efficient continuous operating facil-ity at all times. Add to this that maintenance would also be treated as an investment rather than a cost, and you have the comprehensive philosophy on which the maintenance management system was built. An in-vestment is expected to show a positive return, and so should maintenance be expected to improve the profit-ability of an operation. The management philosophy for maintenance is just as important as the philosophy established for any business operation. For most indus-try, maintenance is a supervised function at best, with little real cost control. But it must be a managed func-tion employing the best methods and systems avail-able to produce profitavail-able results that have a positive effect on profitability.
The development of a philosophy to support the concept of proactive planned maintenance is impor-tant. It is believed that many maintenance manage-ment deficiencies or failures have resulted from having poorly constructed philosophies or the reliance upon procedures, systems, or popular programs that have no real philosophical basis.
Time Tools
Assess Job
Fix
Test Clean Dissassemble
Measure Plan Parts
Complete
Information Event
Notification Planning Scheduling Mechanic
[image:10.684.103.511.66.314.2]1.2.3. The Function and Control System
Today there is little disagreement that the function and control system of a good maintenance manage-ment program must be computer based.
Using the philosophy that maintenance manage-ment is to be considered in the same way that all other business functions are considered, it is difficult to justify any other approach other than complete integration of maintenance management functions with total organizational management functions. The computer is the tool to use to accomplish this difficult and complex task.
The computer, in an integrated operation, must be available for use by every member of the maintenance organization as well as all other plant employees who have a need. It is an essential part of the maintenance employee’s resources for accomplishing his work. It is just as important to a mechanic or electrician as the tools in his toolbox or the analysis and measurement instruments that he uses daily.
The computer must supply meaningful and useful information to the user as opposed to normal computer data.
A successful integration of data systems will tie together maintenance, warehouse, purchasing, accounting, engineering, and production in such a way that all parties must work together and have the use of each other’s information. This is part of the answer to the question being asked almost universally, how do you break down the barriers between departments and get them to work as part of the whole or as a team?
The computer system must be on line, available, and time responsive. A batch system or semi-batch system will not provide the support needed for a dynamic, integrated, maintenance management system.
In the integrated system with a common data base, data is entered only once and immediately updates all other files so that its use is immediately available to all functional areas. This means that anyone in any functional area can use or look at data in any other area, unless it is restricted. Some have referred to this effect as the “fish bowl effect” since everything is vis-ible to all. This stimulates cooperation, in fact, it dictates cooperation.
1.2.4. What Is Maintenance?
Everyone knows what maintenance is; or at least they have their own customized definition of mainte-nance. If the question is asked, words like fix, restore, replace, recondition, patch, rebuild, and rejuvenate will be repeated. And to some extent there is a place for these words or functions in defining maintenance. However, to key the definition of maintenance to these words or functions is to miss the mark in understanding maintenance, especially if you wish to explore the philo-sophical nature of the subject. Maintenance is the act of maintaining. The basis for maintaining is to keep, pre-serve, and protect. That is to keep in an existing state or preserve from failure or decline. There is a lot of differ-ence between the thoughts contained in this definition and the words and functions normally recalled by most people who are “knowledgeable” of the maintenance function; i.e., fix restore, replace, recondition, etc. FIGURE 1.2. Mt. Holly’s proactive maintenance model.
Planned-Scheduled-Preventive Maintenance
Inspection Lubrication Predictive PM WO
Weekly Daily Schedule
PM Performance
Evaluation
Result
Time
Event Occurrence
Planning
Usually Production
Work Order
Results:
1. Performance to Specification 2. Maintain Capacity 3. Continuous Improvement Production
Coordination Meeting Problem Solving Team
Weekly Daily Schedule Work
Performance
History
Work Request
Materials Warehouse
Tools
Production Requested
Emergency Work Order Corrective
6 The Basics of Maintenance and Reliability
1.2.5. Specification
If we shift our defining thoughts to maintenance in the pure sense, we force ourselves to deal with keep-ing, preservkeep-ing, and protecting. But what are we to keep, protect, or preserve? You may think that it is the machine, equipment, or plant, and that is true. But how are you to define the level to which the machine, equipment, or plant is to be kept. One way would be to say—“keep it like new.” At face value the concept sounds good, but it is more subjective than objective. The answer to maintenance levels must be defined by a specification.
A specification is a detailed precise presentation of that which is required. We must have a specifi-cation for the maintenance of equipment and plant. In actual usage today the specification, if it exists, is not detailed or precise. A specification usually does exist informally in the mind of the mechanic or man-agement member even though they may be unable to recite it. This means that at best, it is a variable, general-type specification. This kind of specifica-tion is defined in terms of and is dependent upon time available, personnel training level, pressure to produce a current order now, money allocated or available, or management opinion. Obviously, a specification like this will not qualify as a true specification, nor will it qualify as a supporting component of the act of maintaining. The true main-tenance specification may be a vendor specification, a design specification, or an internally developed specifi-cation. The specification must be precise and objective in its requirements. The maintenance system and orga-nization must be designed to support a concept based on rational specifications. Detailed work plans and schedules may be constructed to provide the speci-fication requirement at the maintenance level. In the maintaining context, the specification is not a goal. It is a requirement that must be met. The maintenance system must be designed to meet this requirement. The specification must be accepted as the “floor” or minimum acceptable maintenance level. Variation that does occur should be above the specification level or floor. The specifications will probably be stated in terms of attributes and capacity.
In reference to maintenance specifications, included are individual equipment specifications, process speci-fications, and plant performance specifications.
1.2.6. The Maintenance Function
The maintenance department is responsible and
accountable for maintenance. It is responsible for the
way equipment runs and looks and for the costs to achieve the required level of performance. This is not to say that the operator has no responsibility for the use of equipment when in his hands—he does. The point is that responsibility and accountability must be assigned to a single function or person whether it be a mechanic or operator. To split responsibility between maintenance or any other department where overlap-ping responsibility occurs is to establish an operation where no one is accountable. Alumax of SC considers this a fundamental principle for effective operation of maintenance.
The maintenance function is responsible for the frequency and level of maintenance. They are responsible for the costs to maintain, which requires development of detailed budgets and control of costs to these budgets.
Just as the quality function in an organization should report to the top manager, so does the main-tenance function for the same obvious reasons. This allows maintenance problems to be dealt with in the best interest of the plant or company as a whole. Main-tenance efforts and costs must not be manipulated as a means for another department to achieve its desired costs results.
Where the maintenance department or group is held responsible and accountable for maintenance, the relationship with other departments takes on new meaning. The maintenance department can’t afford to have adversary relationships with others. They must have credibility and trust as the basis of interdepart-mental relationships. This is an essential element for the successful operation of a maintenance management system.
The organizational chart or better yet the organiza-tional graphic is constructed on the basis that the central functional element for core maintenance is the Techni-cal team. The relational (syntax) aspects of the organi-zation are shown with concentric bands of teams. The nearer band of teams represents the tighter relationship to the core teams. Radial connecting lines show a direct relationship to a team or band of teams. Concentric con-necting lines show a more indirect relationship between teams. The outer band of teams requires a Relational Organizational Chart similar to the maintenance teams chart to define their close relationships and full rela-tionship to other plant teams. This particular chart is predicated on the relationship of all teams to central core maintenance teams.
Technical Teams—Core Maintenance—These teams
technicians. The teams are assigned based on a func-tional requirement plant wide or on the basis of a geo-graphic area of responsibility. The focus, direction of the team, and individual team member needs are provided by an assigned member of the facilitator and directional control team.
Facilitator and Directional Control Team—Members of this team have been trained and qualified to provide team organizational dynamics and traditional super-visory functions as required. With the facilitator, the team must address work performance by categories, administrating, training/safety/housekeeping, bud-geting and cost control and information reporting as well as the technical requirements of the team. These members perform the necessary traditional supervi-sory functions, especially related to personnel func-tions, for the technical teams.
Work Distribution and Project Coordination Team— This team works with the Facilitator, Planning and Engineering teams to staff technical teams to meet work load requests, inventory requirements, contrac-tor support, and field superintendence of engineering projects.
Job Planning Team—This team works closely with
the Technical teams and the Facilitator team to plan and schedule maintenance, overhaul, and contractor work. Where operators are doing maintenance func-tions, the same applies. In addition, information and reports are prepared by this team for all other teams as required or requested. Quality control of the data input is a responsibility of this team. Coordination of production requirements must also be performed.
Technical Assistance Team—This team is a resource to the Technical teams and Facilitator team for continuous improvements, modifications, trouble shooting, and corrective action.
Materials Support Team—This team works with the
Planning team, Facilitator team, and the Technical teams to meet planned job requirements and emer-gency material requirements.
Maintenance Management Team—This team provides
overall coordination of maintenance and material func-tions to meet the plant capacity requirement. Overview of budget and cost control is also provided.
User/Operator Maintenance Team—This is a team
of designated operators who perform assigned and scheduled maintenance work. They must be selected, trained and qualified prior to being assigned to this team.
Plant Engineering Team—This team provides
jected management for the Plant capital budget pro-gram. They provide consulting and trouble shooting to the Technical Teams on an as requested basis.
Other teams in the outer band of the organiza-tional chart must be specifically defined by individual relational organization charts.
For each of the above teams, a detailed perfor-mance requirement document must be developed. Individual team members are guided by a specific job performance document. These documents detail the vision, mission, processes used, and strategies employed.
Does the maintenance function provide a service or produce a product? Again, definition is important in the development of this part of the philosophy. Service is defined as a useful labor that does not produce a tangible commodity. A product is something that is produced, usually tangible, but definitely measur-able. In the case of the maintenance function and the development of this philosophy, both a service and a product are considered as an output of maintenance. The current thinking which is related to traditional maintenance (reactive maintenance) suggests that the maintenance function is for the most part a service function. But the philosophy being developed here considers the maintenance function as the provider of a product with a small but limited service compo-nent. Consider the product produced by maintenance to be capacity (Production/Plant capacity). Writers on the subject of maintenance have suggested this con-cept in the past, but little has been made of developing the idea to date. A predominate service approach to maintenance, as is currently practiced, is a reactive mode of operation, and is typical of most maintenance operations today. React means response to stimulus. Most maintenance operations today are designed to respond to the stimulus of breakdown and the work order request, except for small efforts related to pre-ventative maintenance and predictive maintenance, usually less than 25% of work hours worked. This simply means that the maintenance function must be notified (stimulated) of a problem or service require-ment by some means, usually by someone outside of the maintenance organization, then maintenance reacts. Rapid response is the “score card” of this system.
8 The Basics of Maintenance and Reliability
equipment and facilities. The function must provide a facility and equipment that performs to specification and produces the product (capacity). Stated again, the maintenance function is a process that produces capacity which is the product.
The results of this model created a benchmark that hundreds of companies followed and many continue to adopt. Table 1.1 shows the “world-class benchmarks” of Alumax, Mt. Holly.
Companies that adopted John Day’s philoso-phy and strategy achieved results beyond what was known within the company. One company was a large manufacturing company. Once senior management understood and adopted Day’s philosophy and approach, it resulted in the following:
1. Plant capacity increased by $12 million in the first year.
2. A large capital project was deferred when the capac-ity it was to provide was found to exist already. 3. The need to hire a projected 12 additional
mainte-nance staff members was eliminated.
4. The plant maintenance staff was reduced by 20% over the following three years because of attrition.
The approach to proactive maintenance is not magic; implementing the process is very difficult but the results are worth the effort. To develop a true proactive maintenance process, a company must have commitment at all levels to follow known “best practices.”
1.3. WHAT IS RELIABILITY?
Most maintenance professionals are intimidated by the word reliability, because they associate reliability
with RCM (reliability centered maintenance) and are unclear on what it actually means. Reliability is the ability of an item to perform a required function under a stated set of conditions for a stated period of time. However, many companies focus on fixing equipment when it has already failed rather than ensuring reli-ability and avoiding failure.
A common reason for this finding is the lack of time to investigate what is needed to ensure the reliability of equipment. Yet, a growing awareness among these reactive maintenance organizations is that the conse-quences of poor equipment performance include higher maintenance costs, increased equipment failure, asset availability problems, and safety and environmental impacts. There is no simple solution to the complex problem of poor equipment performance. The tradi-tional lean manufacturing or world-class manufactur-ing is not the answer. These strategies do not address the true target; but if we focus on asset reliability, the results will follow.
1.3.1. Companies That Get It
Imagine a corporation fighting an uphill battle to survive despite foreign competition, an aging workshop, and many other issues. The chief execu-tive officer (CEO) decides to focus on reliability because maintenance is the largest controllable cost in an organization and, without sound asset reliabil-ity, losses multiply in many areas. Over a two year period, a dedicated team of over 50 key employees researched the world’s best maintenance organiza-tions, assimilating the “best practices” they found and implementing them in a disciplined, structured environment. Focusing on reliability was found to offer the biggest return with the longest lasting results.
Corporations that truly understand reliability typically have the best performing plants. Some common charac-teristics of a “reliability focused” organization are
● Their goal is optimal asset health at an optimal cost. ● They focus on processes—what people are doing to
achieve results.
● They measure the effectiveness of each step in the
process, in addition to the results.
● Their preventive maintenance programs focus
mainly on monitoring and managing asset health.
● Their preventive maintenance programs are
techni-cally sound, with each task linked to a specific failure mode. Formal practices and tools are used to identify the work required to ensure reliability.
TABLE 1.1. Benchmarks at Alumax, Mt. Holly
Mt . Holly Typical
Planned/scheduled 91.5% 30–50%
Breakdowns 1.8% 15–50%
Overtime 0.9% 10–25%
Inventory level ½ normal Normal
Call-ins 1/month Routine
Off-shift work 5 people Full crew
Backlog 5.5 weeks Unknown
Budget performance Varies, 1–3% Highly variable
Capital replacement Low High
1.3.2. Why Move Toward Proactive Work?
Many companies focus their entire maintenance efforts on a preventive maintenance (PM) program that does not meet the actual reliability needs of the equip-ment, often because “this is the way we’ve always done it.” Others use statistical analysis to improve reli-ability rather than statistical analysis techniques, such as Weibull analysis, to identify assets where reliabil-ity is a problem. Here are some sobering facts that will make you think twice about the effectiveness of a time-based PM program:
1. Less than 20% of asset failures are age related. How can you identify the frequency of their preventive maintenance activities? Do you have good data to determine this frequency? If you have, then most asset failures have been correctly documented and coded in the CMMS/EAM [computerized mainte-nance management system/enterprise asset man-agement]. We find that 98% of companies lack good failure history data.
2. Most reliability studies show that over 80% of asset failures are random. How do you prevent random failure? In many cases, it is possible to detect early signs of random failure by monitoring the right health indicators. In simple terms, how much has the asset degraded and how long before it no lon-ger functions? This approach allows time to take the corrective action, in a scheduled and proactive manner.
Let us take this statement a step further. Preven-tive maintenance for random failures usually focuses on the health of the asset (through monitoring indica-tors such as temperature, tolerance, and vibration) to determine where an asset is on the degradation or PF curve (Figure 1.3). Point P is the first point at which we can detect degradation. Point F, the new definition of failure, is the point at which the asset fails to perform at the required functional level.
The amount of time that elapses between the detec-tion of a potential failure (P) and its deterioration to functional failure (F) is known as the PF interval. A maintenance organization needs to know the PF curve on critical equipment to maintain reliability at the level required to meet the plant’s needs. An example of a potential (partial) failure is a conveyor that is supposed to operate at 200 meters per minute but, because of a problem, can run at only 160 meters per minute. Full functional failure occurs when the conveyor ceases to run.
However, a few barriers prevent a plant from obtain-ing a higher level of reliability of its assets :
● Most maintenance and production departments
con-sider failure only when the equipment is broken. A true failure occurs when an asset no longer meets the function required of it at some known rate of stan-dard. For example, if a conveyor is supposed to oper-ate at 200 meters per minute, when the conveyor’s speed no longer meets this requirement, it has failed functionally, causing an immediate loss of revenue for the company.
Failure Starts Here
Potential Failure
Equipment Not Performing Intended
Function
Functionally Failed
PF Interval
Equipment Broken
F P
Time Conditional
Probability of Failure
Today’s Definition of Failure
Old Definition of Failure
[image:15.684.142.504.490.696.2]10 The Basics of Maintenance and Reliability
● The maintenance department does not get involved
when quality or production rate issues arise in the plant. In most cases, when an asset has failed func-tionally in a plant, the maintenance department is not informed.
● Most maintenance departments do not know the
performance targets of the plant equipment and do not understand why it is important that they under-stand them. This not a failure of the maintenance department but a breakdown in communication of the company’s goals.
Overcoming these barriers is essential to rapid per-formance in reliability. If an understanding and focus on functional failure is applied by all plant personnel, higher asset reliability will rapidly follow. The focus must be on the alignment of the total plant in meeting performance targets of each asset. These performance targets and current performance rates need to be posted, so everyone is aware if a gap occurs in asset perfor-mance. The production and maintenance departments must know when an asset no longer meets the perfor-mance target. Both departments must accept responsi-bility for actions to mitigate the performance losses.
1.3.3. A New Way to View Failure
Inside every operation is the “hidden plant,” made up of all equipment operating below defined performance targets. These need immediate maintenance. By focusing on the equipment performance targets, asset reliability could be increased rapidly.
A plant must apply RCM methodology to meet the goal of “optimal reliability at optimal cost.” That RCM methodology could be RCM II, Streamlined RCM, failure modes and effects analysis (FMEA), or mainte-nance task analysis (MTA). Be careful which methodol-ogy you use if you want rapid performance.
To know what is needed, a company must review the way it manages equipment performance. If equip-ment continues to fail after preventive maintenance or overhauls, then clearly a change is needed. As a starting point, everyone in a plant should understand what is meant by reliability and what it means to the success of the company. Reliability should be the plant’s collective buzzword.
1.4. MAINTENANCE/RELIABILITY ASSESSMENT
The biggest challenge organizations face is know-ing the status of their current maintenance and
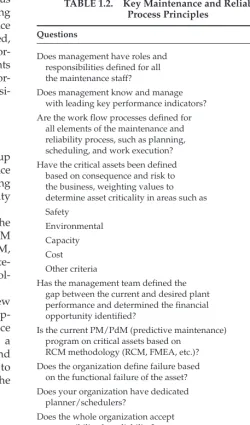
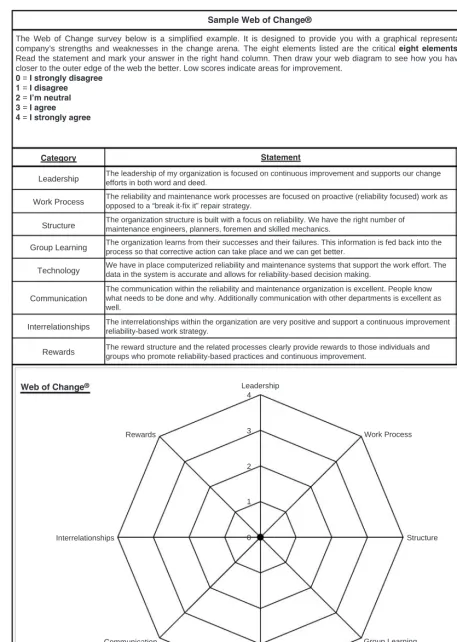
[image:16.684.318.568.270.695.2]reli-ability process and developing a plan to close the gap between current and desired performance. Tables 1.2–1.8 list specific questions to answer in order to define the gap between the current performance of maintenance and reliability processes and those considered “best practices.” All answers should be “yes”; if not, this area may need to be explored in more depth. If you are unsure about the question or answer, then the question answer is “no.” Remember this assessment is used only to help an organization determine the gaps between its current and desired
TABLE 1.2. Key Maintenance and Reliability Process Principles
Questions Yes/No
Does management have roles and responsibilities defined for all the maintenance staff?
Does management know and manage with leading key performance indicators? Are the work flow processes defined for all elements of the maintenance and reliability process, such as planning, scheduling, and work execution?
Have the critical assets been defined N/A
based on consequence and risk to the business, weighting values to determine asset criticality in areas such as Safety
Environmental Capacity Cost Other criteria
Has the management team defined the gap between the current and desired plant performance and determined the financial opportunity identified?
Is the current PM/PdM (predictive maintenance) program on critical assets based on
RCM methodology (RCM, FMEA, etc.)? Does the organization define failure based on the functional failure of the asset? Does your organization have dedicated planner/schedulers?
Does the whole organization accept responsibility for reliability? Does your organization use mean time between failure (MTBF ) to determine the reliability of your assets?
TABLE 1.3. Reliability
Questions Yes/No
Are PM/PdM results entered into reliability software to identify P on the P-F interval?
Does maintenance and production management understand the P-F interval and how it functions to manage asset failure?
Does maintenance and production management focus on a formal critical assets matrix when determining shutdowns and maintenance work?
Is a work order written for all functional failures (partial and total)?
Is a formal root cause failure analysis (RCFA) or root cause analysis (RCA) process defined and executed on major and multiple similar asset failures?
Is a maintenance or reliability engineer on staff?
Does the maintenance or reliability department focus strictly on reliability of the assets and not “project engineering” work?
Does your company apply the Six Sigma DMAIC process in its reliability engineering efforts?
Is an RCM methodology (RCM, RCM II, RCM Turbo, FMEA, etc.) used to determine the maintenance work strategy for your assets?
Do you know what percentage of your assets your maintenance strategy is RTF (run to failure), PdM, detective maintenance, PM (restorations, replacements, lubrication, etc.), and so forth?
[image:17.684.67.575.334.706.2]Total “yes” answers times 30 = (possible 300 points)
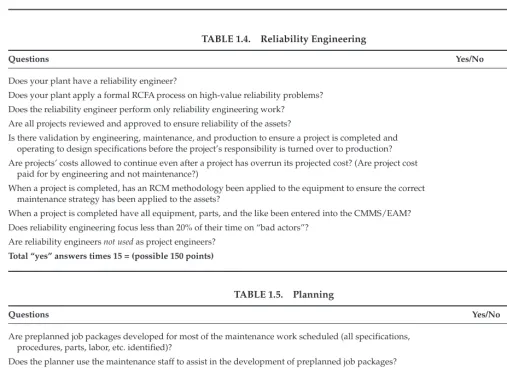
TABLE 1.4. Reliability Engineering
Questions Yes/No
Does your plant have a reliability engineer?
Does your plant apply a formal RCFA process on high-value reliability problems? Does the reliability engineer perform only reliability engineering work?
Are all projects reviewed and approved to ensure reliability of the assets?
Is there validation by engineering, maintenance, and production to ensure a project is completed and operating to design specifications before the project’s responsibility is turned over to production? Are projects’ costs allowed to continue even after a project has overrun its projected cost? (Are project cost paid for by engineering and not maintenance?)
When a project is completed, has an RCM methodology been applied to the equipment to ensure the correct maintenance strategy has been applied to the assets?
When a project is completed have all equipment, parts, and the like been entered into the CMMS/EAM? Does reliability engineering focus less than 20% of their time on “bad actors”?
Are reliability engineers not used as project engineers?
Total “yes” answers times 15 = (possible 150 points)
TABLE 1.5. Planning
Questions Yes/No
Are preplanned job packages developed for most of the maintenance work scheduled (all specifications, procedures, parts, labor, etc. identified)?
Does the planner use the maintenance staff to assist in the development of preplanned job packages?
Is a planner/scheduler (or just a planner) performing the day-to-day job ever called upon to rush in parts for a breakdown?
Does the planner identify backlog based on categories (e.g., ready to schedule, waiting on parts, waiting on engineering, waiting to be planned)?
Does the planner validate whether a work request is valid?
12 The Basics of Maintenance and Reliability
TABLE 1.6. Scheduling
Questions Yes/No
Is someone responsible for scheduling, either a full-time maintenance scheduler or full-time planner/scheduler? Do planner/schedulers or schedulers work closely with production to schedule maintenance work?
Is maintenance work scheduled one week ahead at least? Is maintenance work scheduled by day?
Is maintenance work scheduled with a maintenance person’s name assigned? On large outages do maintenance personnel provide input into the schedule?
Does the scheduler or planner/scheduler facilitate the maintenance scheduling meeting?
Does the scheduler or planner/scheduler not report to maintenance supervision? Reporting to a maintenance manager is acceptable.
Is next week’s schedule posted at least the prior Friday for all to view to include maintenance and production? Is schedule compliance above 80%?
Total “yes” answers times 10 = (possible 100 points)
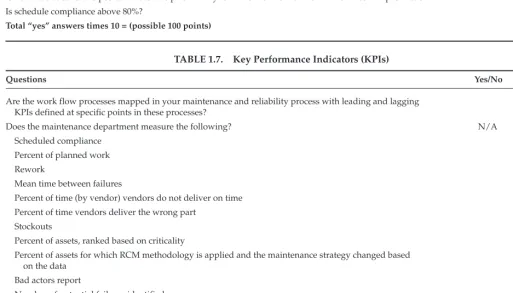
TABLE 1.7. Key Performance Indicators (KPIs)
Questions Yes/No
Are the work flow processes mapped in your maintenance and reliability process with leading and lagging KPIs defined at specific points in these processes?
Does the maintenance department measure the following? N/A
Scheduled compliance Percent of planned work Rework
Mean time between failures
Percent of time (by vendor) vendors do not deliver on time Percent of time vendors deliver the wrong part
Stockouts
Percent of assets, ranked based on criticality
Percent of assets for which RCM methodology is applied and the maintenance strategy changed based on the data
Bad actors report
Number of potential failures identified
Percent of assets for which functional targets are identified Percent of work proactive
Percent of work reactive
[image:18.684.60.573.420.712.2]Maintenance cost as a percent of return on asset value (RAV)
TABLE 1.5. (Continued)
Questions Yes/No
Does the planner provide feedback to the requester when a work request or notification has been entered into the CMMS/EAM system?
Does the planner visit the job sites of work to be planned on at least 30% of jobs?
Can the planner check status of planned work parts on the CMMS/EAM within five minutes of any job? Does the planner validate work request in three days or less?
Do you have at least one planner or planner/scheduler for every 7–25 maintenance personnel?
performance. We recommend this assessment to include representatives from all involved depart-ments: plant manager, maintenance and engineering manager, production management, operators, main-tenance personnel, mainmain-tenance planners, storeroom management, and so forth.
The final score totals are interpreted as follows:
0–500 = Total reactive (reliability principles are not understood or applied). The company needs to edu-cate all management and engineering personnel in reliability and develop a reliability strategy for serious change. It needs to develop a business case to define the opportunity immediately. Read the book.
501–700 = Emerging (long way to go). The company needs to develop a business case and reliability strat-egy with a timeline, targets, and objectives.
701–850 = Proactive (continue the journey, you are headed in the right direction). The company needs to ensure that a continuous improvement process is built into its asset reliability process. Identify gaps in the assessment and fill the gaps.
851–1000 = World Class. The company should hire an outside reliability consulting firm to assess its current status and make recommendations for any change required. Great job.
This next section was written by Steve Thomas (Changemgt.net), one of the leaders in change manage-ment in the world of reliability today. His book, Improv-ing Maintenance and Reliability through Cultural Change, is used by companies around the world to solve their change management problems. Below, he provides insight into this challenging issue (see Section 1.5). TABLE 1.8. Education and Training
Questions Yes/No
Have all management personnel been trained in the basics of reliability?
If all management personnel have been trained in the basics of reliability, do they demonstrate this knowledge in their job? Have all plant personnel been trained in the basics of reliability?
Have executive management personnel been trained in the basics of reliability? Have all maintenance personnel been trained in the basics of root cause failure analysis?
Does the plant have a skills training program for all maintenance personnel and is it based on a skills assessment? Does the company have an apprenticeship or entry-level training program for maintenance and production?
Are skilled maintenance personnel hired from inside and outside the company administered a written and “hands-on” test? Does the plant have a maintenance training budget that equals or exceeds 6% of the maintenance labor budget?
Do skilled maintenance workers use preplanned job packages with procedures over 90% of the time?
Total “yes” answers times 10 = (possible 100 points)
TABLE 1.7. (Continued)
Questions Yes/No
Maintenance material in stores as a percent of RAV Maintenance cost per unit produced
Are at least 50% of the KPIs just listed posted for all to see in the maintenance department? Are at least 25% of the KPIs just listed posted for all to see in the maintenance department? Are at least 10% of the KPIs just listed posted for all to see in the maintenance department? Are at least 10% of the KPIs just listed posted for all in production department to see? Are their targets and goals established for over 75% of the KPIs listed above? Are your KPIs listed as leading or lagging?
For each KPI the maintenance department uses, is a standard definition, objective, calculation, example calculation, roles, and responsibility assigned?
14 The Basics of Maintenance and Reliability
1.5. INTRODUCTION TO CHANGE MANAGEMENT*
One of the major areas of focus in industry today is improving equipment reliability. Why? To insure that production is always available to meet the demand of the marketplace. One of the worst nightmares of any company and those who man-age it is to have a demand for product but not be able to supply it because of equipment failure. Cer-tainly this scenario will reduce company profit-ability and could ultimately put a company out of business.
For some firms, poor reliability and its impact on production are far more serious than for others. For those that operate on a continuous basis—they run 24 hours per day seven days per week—there is no room for unplanned shutdowns of the production equipment; any loss of production is often difficult or even impossible to make up. For others that do not operate in a 24/7 mode, recovery can be easier, but nevertheless time consuming and expensive, reducing profits.
Many programs available in the industry are designed to help businesses improve reliability. They are identified in trade literature, promoted at con-ferences and over the web, and quite often they are in place within the plants in your own company. Most of these programs are “hard skill” programs. They deal with the application of resources and resource skills in the performance of a specific task aimed at reliability improvement. For example, to improve preventive maintenance, you train your workforce in preventive maintenance skills, purchase the necessary equip-ment, and roll out a PM program accompanied by corporate publicity, presentations of what you expect to accomplish, and other forms of hype to get buy-in from those who need to execute it. Then you con-gratulate your team for a job well done and move on to the next project. Often at this juncture, something very significant happens. The program you delivered starts strongly, but immediately things begin to go wrong. The work crews assigned to preventive main-tenance get diverted to other plant priorities; although promises are made to return them to their original PM assignments, this never seems to happen. Equipment scheduled to be out of service for preventive
main-tenance can’t be shut down due to the requirements of the production department; although promises are made to take the equipment off-line at a later time, this never seems to happen. Finally, the various key members of management who were active advocates and supporters at the outset are the very ones who permit the program interruptions, diminish its intent, and reduce the potential value. Often, these people do make attempts to get the program back on track, but these attempts are half-hearted. Although noth-ing is openly said, the organization recognizes what is important, and often this is not the preventive main-tenance program.
[Thomas simplifies the demise of the preventive maintenance program in an example.] Yet this is exactly as it happens, although much more subtle. In the end, the result is the same. Six months after the triumphant rollout of the program, it is gone. The operational status quo has returned and, if you look at the business process, you may not even be able to ascertain that a preventive maintenance program ever existed at all.
For those of us trying to improve reliability or implement any type of change in our business, the question we need to ask ourselves is Why does this happen? The intent of the program was sound. It was developed with a great deal of detail, time, and often money; the work plan was well executed. Yet in the end there is nothing to show for all of the work and effort.
Part of the answer is that change is a difficult process. [Note that he did not say program, because a program is something with a beginning and an end.] A process has a starting point—when you initially con-ceived the idea—but it has no specific ending and can go on forever.
Yet the difficulty of implementing change isn’t the root cause of the problem. You can force change. If you monitor and take proper corrective action, you may even be able over the short term to force the process to appear successful. Here, the operative word is you. What if you implement the previously mentioned pre-ventive maintenance program and then, in order to assure compliance, continually monitor the progress. Further suppose that you are a senior manager and have the ability to rapidly remove from the process change any roadblocks it encounters as it progresses. What then? Most likely the change will stick as long as you are providing care and feeding. But what do you think will happen if after one month into the program you are removed from the equation. If there are no other supporters to continue the oversight and correc-tive action efforts, the program will most likely lose
energy. Over a relatively short time, everything will likely return to the status quo.
The question we need to answer is Why does this happen to well-intentioned reliability-driven change process throughout industry? The answer is that the process of change is a victim of the organization’s culture and failure to address the “soft skills” of the change process.
The culture is the hidden force, which defines how an organization behaves, works behind the scenes to restore the status quo unless specific actions are taken to establish a new status quo for the organization. Without proper attention to organizational culture, long-term successful change is not possible.
Think of an organization’s culture as a rubber band. The more you try to stretch it, the harder it tries to return to its previously un-stretched state—the status quo. However if you stretch it in a way that it can’t return and leave it stretched for a long time, once released it will sustain the current stretch you gave it and not return to its original dimensions. That is going to be our goal—to figure out how to stretch the organization but in a way that when the driver of the process is out of the equation, the organizational rubber band won’t snap back.
Changing the organization’s culture in order to promote long-lasting change benefits everyone from the top of the organization to the bottom. It benefits the top by providing a solid foundation on which to build new concepts, behaviors, and ways of thinking about work. To accomplish radical changes in how we think about or execute our work requires that those who are part of the culture support it. Senior management can only take this so far. They can set and communi-cate the vision and they can visibly support the effort, but the most important thing they can do is empower those in the middle to make it happen.
As middle managers, we all know that we have many more initiatives on which to work than there is time in the day (or night). This spreads our focus. If we don’t collectively embrace the new change, then no threat, benefit or any other motivational tech-nique will make the change successful over the long term. Although this book can help educate senior management so that they can empower the rest of us, its real benefit is for middle managers. It will help them understand this very complex concept in a way that will enable them to deliver successful change initiatives.
There is also benefit for those at the bottom tier of the management hierarchy. The term bottom is not meant to demean this roll because this is where the “rubber meets the road.” All cultural change and their
related initiatives end here. This is where all of the plans, training, and actual work to implement end. If it doesn’t work here—failure is the outcome.
As with any effort, getting started is often difficult. However, the value in a successful effort is well worth the time, energy, and commitment required. The reason behind this is that you are not just changing the way a process is executed, or a procedure is followed. By changing the orga-nization’s culture, you are in essence changing the very nature of the company. This book addresses this change of culture in a general sense that can be applied across many disciplines. But more specifi-cally, it is targeted toward changing the culture as it pertains to reliability. If we are successful in this arena, the result will be a major shift in how work is performed. In addition, a culture that is focused on equipment reliability reaps other closely associated benefits. These include improved safety and envi-ronmental compliance. Both of these are tied closely to reliability in that reliable equipment doesn’t fail or expose a plant to potential safety and environ-mental issues.
Changing a culture to one focused on reliability also has spin-off benefits in many other areas. Reli-ability or the concept of things not breaking can eas-ily be applied to other processes that are not related to equipment efficiency and effectiveness. However, reliability or any other type of change is very diffi-cult. After all you are trying to alter basic beliefs and values of an organization. These are the behaviors that have been rewarded and praised in the past and may even be the reason that many in the organization were promoted to their current positions. Change may also seriously affect people’s jobs because things they did in the past may no longer be relevant in the future.
Improving Maintenance and Reliability through Cultural Change will prove to be a very beneficial book, not just as a place to start or as a test to pro-vide the initial information for your effort, but also as a book which will help you through all the phases of the process and into the future. The following quotation from Niccolo Machiavelli written over 500 years ago clearly describes the issues and hurdles that surround any change initiative which you are undertaking.