optimisation
.
White Rose Research Online URL for this paper:
http://eprints.whiterose.ac.uk/74690/
Monograph:
Adra, S.F., Griffin, I.A. and Fleming, P.J. (2007) A convergence acceleration operator for
multiobjective optimisation. Research Report. ACSE Research Report no. 950 . Automatic
Control and Systems Engineering, University of Sheffield
[email protected] https://eprints.whiterose.ac.uk/ Reuse
Unless indicated otherwise, fulltext items are protected by copyright with all rights reserved. The copyright exception in section 29 of the Copyright, Designs and Patents Act 1988 allows the making of a single copy solely for the purpose of non-commercial research or private study within the limits of fair dealing. The publisher or other rights-holder may allow further reproduction and re-use of this version - refer to the White Rose Research Online record for this item. Where records identify the publisher as the copyright holder, users can verify any specific terms of use on the publisher’s website.
Takedown
If you consider content in White Rose Research Online to be in breach of UK law, please notify us by
A Convergence Acceleration Operator for
Multiobjective Optimisation
Research Report No. 950
Salem F. Adra Ian A. Griffin Peter J. Fleming
Department of Automatic Control and Systems Engineering
University of Sheffield
Sheffield, S1 3JD
UK
Abstract— A novel multiobjective optimisation accelerator is introduced that uses direct manipulation in objective space together with neural network mappings from objective space to decision space. This operator is a portable component that can be hybridized with any multiobjective optimisation algorithm. The purpose of this Convergence Acceleration Operator (CAO) is to enhance the search capability and the speed of convergence of the host algorithm. The operator acts directly in objective space to suggest improvements to solutions obtained by a multiobjective evolutionary algorithm (MOEA). These suggested improved objective vectors are then mapped into decision variable space and tested. The CAO is incorporated with two leading MOEAs, the Non-Dominated Sorting Genetic Algorithm (NSGA-II) and the Strength Pareto Evolutionary Algorithm (SPEA2) and tested. Results show that the hybridized algorithms consistently improve the speed of convergence of the original algorithm whilst maintaining the desired distribution of solutions.
Index Terms—Evolutionary Multiobjective optimisation, Neural Networks.
I. INTRODUCTION
eal-world problems commonly require the simultaneous consideration of multiple, competing performance measures. Without loss of generality, a multiobjective optimisation problem can be formulated as a minimization of a function Z(X), where Z(X) = {Z1(X)...Zn(X)} is a vector of objective functions, n is the number of objectives to be optimised and X is a vector of decision variables. The optimisation problem consists of finding the decision vector, or set of vectors, that results in the best solution or set of solutions in objective space. For multiobjective problems in which objectives are competing, no single optimal solution exists, rather a set of candidate solutions known as the approximation set [1]. A subset of these decision vectors will
S. F. Adra is with the Automatic Control and Systems Engineering Department, University of Sheffield, Sheffield, S1 3JD (e-mail: s.adra@ Sheffield.ac.uk).
I. A. Griffin, is with the Automatic Control and Systems Engineering Department, University of Sheffield, Sheffield, S1 3JD (e-mail: i.griffin@ Sheffield.ac.uk).
P. J. Fleming is with the Automatic Control and Systems Engineering Department, University of Sheffield, Sheffield, S1 3JD (e-mail: p.fleming@ Sheffield.ac.uk).
be characterised by the fact that no other solution within the approximation set offers better objective function values across all objectives. This subset of candidate solutions is said to be non-dominated and is known as the Pareto optimal set, from which the decision maker ultimately selects an acceptable solution. The associated objective vectors form the trade-off surface (or Pareto front) in objective space. Figure 1 shows an optimisation problem where 3 decision variables are optimised with respect to 2 competing objectives, illustrating the mapping of a decision vector into objective space and showing the Pareto front for this idealised case.
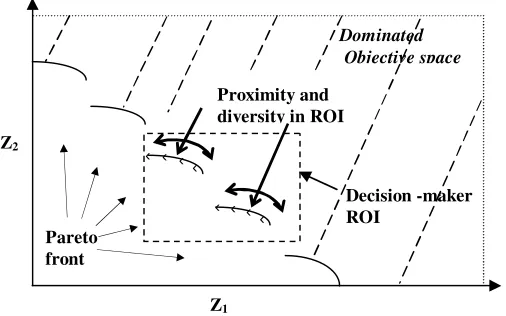
The approximation set offered to the decision maker, is required to be as close as possible to the true Pareto front. The approximation set is also required to be well spread across objective space, presenting the decision maker with a well distributed set of solutions within the region(s) of interest (ROI) [2]. These two characteristics of an approximation set are termed proximity and diversity, respectively, and are illustrated in Figure 2. To be of practical use, a multiobjective optimisation algorithm must produce an approximation set with acceptable proximity and diversity within acceptable computational resource and time limits. The time taken by an algorithm to perform a given number of search iterations for a particular problem is dependent upon the available computing power. The performance of a MOEA can then be determined by the proximity and diversity of the approximation sets produced from a given number of iterations over multiple runs of the algorithm [3].
In many application domains, calculating the true objective function may be computationally expensive. Given their generational, population-based approach, EAs require a significant number of objective function calculations to be performed. The use of approximated models using Neural Networks (NN), metamodelling techniques, such as Kriging-based approximations, or response surface models [4], [5] provides low computational burden alternatives to full objective function evaluation. [6], [7].
The population-based nature of Evolutionary Algorithms (EAs) makes them well suited to addressing non-commensurate multiobjective problems as they simultaneously explore a family of points in the search space. Traditional evolutionary computation (EC) techniques usually consist of
A Convergence Acceleration Operator for
Multiobjective Optimisation
Salem F. Adra, Member, IEEE, Ian A. Griffin, and Peter J. Fleming
an explorative set of procedures operating in decision variable space.
Fig. 1. The multiobjective problem domain.
The operators within these algorithms mimic Darwinian biological principles of stochastic selection followed by recombination and mutation [8] [9]. Starting either from a random population of candidate solutions or from a previously known set of solutions in decision variable space, EAs calculate the corresponding objective function values, assign them fitness scores reflecting their utility in the application domain and bias the search towards high-potential areas of the space by forcing the “survival-of-the-fittest” solutions. Given the stochastic nature of the operators, an evolutionary algorithm offers no guarantee of finding optimal solutions within a single run.
Fig. 2. A good set of solutions to a multiobjective optimisation problem in terms of proximity, diversity and relevance (i.e. location in ROI)
In this paper, a new convergence accelerator is introduced, which maps from objective space to decision variable space (in the reverse direction to a meta-modeling technique). This operator is a portable component that can be hybridized with any MOEA. The purpose of this Convergence Acceleration Operator (CAO) is to enhance the performance of the host MOEA in terms of the proximity of the approximation set for a given number of objective function calculations without
impeding the active diversification mechanisms of these search strategies. In this work, the CAO is hybridized with two widely used MOEAs, the Non-Dominated Sorting Genetic Algorithm (NSGA-II) [10] and the Strength Pareto Evolutionary Algorithm (SPEA2) [11]. EAs operate in decision space and perform decision space to objective space mapping but tend to fail to exploit direct use of the objective space – a lost opportunity. In contrast to this, the CAO features an innovative direct search in objective space and then uses predictions to map from objective space to decision space; in this study this mapping is realised by an artificial neural network (NN). Performing local search in the objective space was previously introduced in [6], and briefly suggested in [12] and [13]. In [12] and [13], the authors proposed two methods to accelerate the search of a MOEA by approximating the objective function using NN techniques. The first method consisted of introducing a metamodel of the objective function. A NN was trained with objective function data during the first k generations of the optimisation, and then used in place of the objective function for the remaining generations of the search. The second method suggested training a NN to map in the reverse direction (i.e. objective vectors as inputs and decision vectors as outputs) and using it in a simple local search around the non-dominated solutions arising from the previous generation.
This paper is organized as follows: In Section II, the proposed CAO operator is introduced and described. Section III describes the test procedures used in the comparative testing of the standard and CAO-enhanced algorithms. Section IV presents results of the tests described in Section III, and concluding remarks are provided in Section V.
II. THEPROPOSEDCONVERGENCEACCELERATIONOPERATOR
A. Overview
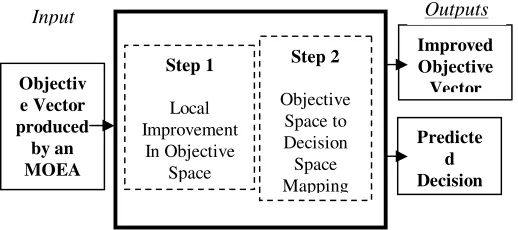
The CAO is a 2-step process, which is illustrated in Figure 3. When the CAO is launched, it starts by deterministically improving the best solutions achieved: these solutions are stored in the online archive of the host algorithm. This improvement takes place in objective space and produces an enhanced version of the archive. The CAO then uses a trained neural network mapping procedure to predict the corresponding decision vectors for the enhancements to the archive. A check of these new decision vectors is made, aimed at reflecting any out-of-bounds decision variables arising from the mapping back into their allowed domain. The true objective values corresponding to all of these new decision vectors are calculated. The enhanced and the original archive of solutions now compete to populate the new archive for the next generation, which will represent the pool from which solutions are selected and recombined. The two components of the CAO are described in detail in the following sections.
Z(X)
fl
Decision vector
X1 X2
X3
Pareto front Objective vector
Z1 Z2
Objective space Decision space
Z1 Z2
Pareto front
‹ ‹ ‹
‹
‹ ‹ ‹ ‹
Decision -maker ROI
Proximity and diversity in ROI
[image:4.612.45.298.429.587.2]Fig. 3. The Convergence Acceleration Operator in Context
B. Local Improvement in Objective Space
The first CAO step is a deterministic local improvement procedure in the objective space. This is the component responsible for speeding up convergence, thereby reducing computational effort. It achieves this by steering objective values obtained by the MOEA towards an improved Pareto front. The objective space local improvement process is implemented in this work for n objectives, and is illustrated in Figure 4 on a bi-objective problem (n = 2). Note that a minimization problem is assumed throughout this work, without any loss of generality.
In general, interior solutions, in terms of any specific objective (solutions B, C and D in Figure 4) will be improved in terms of all the performance measures by steering their objective values into a region of improved objective function values. The new “improved” values for the objectives are determined by linearly interpolating a new value for each objective, between its current value and the next best value achieved for that objective within the population. This is described by
)),
(
),
(
(
D D C D D CD
Z
x
h
x
x
y
h
y
y
Z
′=
+
−
+
−
(1)where Z(x,y) represents a point in the bi-objective space, ZD’ is the “improved” objective value and h is the interpolation step factor. This process is annotated for solution D in Figure 4. Compared to solution D, solution C has the next best value in terms of Objective 1 while solution E possesses the next best value in terms of Objective 2. The size of the step factor or objective space improvement in each dimension should be carefully chosen; ideally it should depend on the stage of the optimisation, the decision maker’s preferences, the regions of interests and the proximity of the population to the true Pareto front. A larger step factor is recommended for early generations of the optimisation, with its value gradually decreasing.
Boundary solutions in terms of a certain objective or axis of performance (points A and E in Figure 4) are improved in terms of the remaining objectives. In other words, solution A will be improved in the y-axis direction (Objective 2), thereby enhancing its overall quality by improving it in terms of
[image:5.612.313.562.63.243.2]Objective 2, and solution E will be improved in the x-axis direction (Objective 1), consequently improving its overall worth by enhancing it in terms of Objective 1.
Fig. 4. Deterministic improvement of the trade-off surface in objective space
C. Objective Space to Decision Space mapping
The second component of the CAO consists of a neural network trained to map the new solutions thus generated in objective space by the first phase of the convergence accelerator back to the corresponding decision variable vectors.
Hybridizing a NN with an EA is very useful for approximating expensive objective functions. This is the meta-modeling principle [14]. By contrast, in this work, a NN is deployed in the CAO to map the proposed objective vectors back to their estimated decision variable vectors. This is achieved by training a NN, using exact objective vectors as inputs and their corresponding decision variable vectors as outputs, to approximate a mapping function from the objective space to the decision space. The training data is the exact data resulting from the objective function values derived within the cycle of a MOEA such as NSGA-II [10] or SPEA2 [11]. The ability to map objective vectors to decision variables will make it possible to search directly in objective space for desired combinations of objective values or to devise points of attractions to guide the search.
The design of the architecture of the NN was based on a trial-and-error set of experiments. The standard backpropagation algorithm [15] was used for training the NN.
Two possible approaches to training the NN are proposed: online and offline training modes. Although the main focus of this paper is the online training mode, the offline training mode is described briefly.
Neural Network Training Modes
Predicte d Decision Improved Objective Vector Step 1 Local Improvement In Objective Space Step 2 Objective Space to Decision Space Mapping Objectiv e Vector produced by an MOEA
Input Outputs
Improvement of D in terms of
objective 1
C A
Objective 2, y
Current Front
Enhanced Front
Objective 1, x
E
Improvement of D in terms of objective 2
• Online Training Mode:
The online mode consists of concurrently training and validating the NN during the execution of the MOEA. Many strategies for controlling the use of the CAO in this mode might be devised. In this mode, the CAO is a performance accelerator that can be launched upon the request of the decision maker (DM) during the execution of the optimisation process.
• Offline Training Mode:
An alternative use of the NN is to train it with data resulting from evaluations of the objective functions arising from a single run of a MOEA and then to incorporate it in subsequent runs of a MOEA when used in conjunction with the CAO.
This training mode will produce an improved NN since it will have been trained on a richer data set. It can subsequently be hybridized with any optimiser attempting to solve the same problem. Thus, the CAO will benefit succeeding executions of the same or other optimisers solving the same problem by speeding up the search and has the potential to offer other benefits. This study will form the basis of future work.
D. Summary
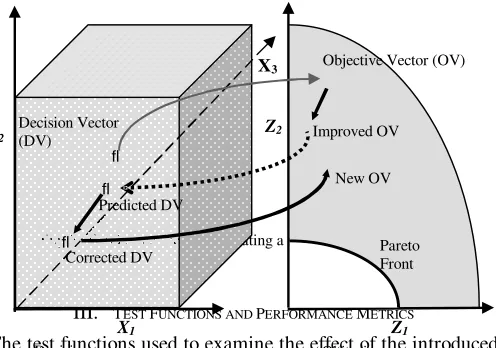
Figure 5 illustrates the actions of the hybridised MOEA which includes the CAO. Trajectories 2-5 describe the specific actions of the CAO.
Trajectory 1: the mapping between a decision variables vector realised by a MOEA and its corresponding computed objective values vector.
Trajectory 2: the resulting objective vector – a member of the approximation set at generation n - is improved in the objective space.
Trajectory 3: a prediction of the decision variables vector corresponding to the improved objective vector is made using the neural network trained with the exact data obtained during earlier evaluations of objective functions during the MOEA search.
Trajectory 4: any invalid decision variable vector introduced by the NN mapping is rectified by adjusting out-of-bounds values of the produced decision variables to their nearest values in their domain of definition.
[image:6.612.316.564.133.307.2]Trajectory 5: finally, the exact objective values vector for the proposed decision variables vector is calculated in the normal way. These candidate solutions will then compete for archive update and insertion with the best solutions currently stored in the online archive.
Fig. 5. CAO steps used in generating a single candidate solution
III. TEST FUNCTIONS AND PERFORMANCE METRICS
The test functions used to examine the effect of the introduced CAO scheme are:
The bi-objective functions: • ZDT1 (convex test function), • ZDT2 (non-convex test function) • ZDT3 (discontinuous test function).
(These test functions belong to a set of test functions [16] that are widely used in Evolutionary Multiobjective Optimisation (EMO) research for testing multiobjective optimisers.)
Further, 3- objective, 5-objective and 8-objective versions of DTLZ2, a scalable test function introduced in [17] to test the effectiveness of MOEAs in dealing with increasing number of objectives, are also used.
NSGA-II [10] and SPEA2 [11] are the comparison benchmark optimisers. Each is also hybridised - NSGA-II/CAO, SPEA2/CAO - with the introduction of the CAO into their cycles to test its effect. Optimiser configurations used in the experiments involving these four optimisers are given in Table 1.
TABLE1
OPTIMISER CONFIGURATIONS
Optimiser Configuration
Size of Population
NSGA-II: 135-200 NSGA-II/CAO: 90 SPEA2: 135-200 SPEA2/CAO: 90
Crossover operator Simulated Binary Crossover (SBX) [18]
Probability: 0.8
Mutation Operator Gaussian Mutation with Probability:
1/(number of Decision Variables)
Number of generations 50
Number of Runs 10
The number of individual objective function evaluations in NSGA-II/CAO and SPEA2/CAO increases from 1 to 2 evaluations per solution for each generation that the CAO is executed. In this study, the CAO is introduced from the 26th to
X2
fl
X1
X3
Z1
Z2
Objective space Decision space
fl
fl
Improved OV
New OV
Objective Vector (OV)
Pareto Front Predicted DV
the 50th (last) generation allowing the neural network to be trained during generations 1-25 of the optimisation process. Note that the training of the NN continues throughout the entire optimisation process.
In order to compare the algorithms for the same number of objective function evaluations, the population size of the CAO-hybridized optimisers is reduced to 90 individuals while SPEA2 and NSGAII operate on a population of 135 individuals. For fairness in the comparison, all algorithms are executed for the same number of generations (50), thus maintaining the same level of global search. It might be considered that the larger population size of NSGA-II and SPEA2 confers an advantage in their favour. In [19], for example, it was suggested that increasing the population size is a prospective technique for obtaining a good evolutionary
many-objective optimisation result.
The following methods are used to analyze the performance of the optimisers and their CAO-hybridized versions on the bi-objective functions:
• The Pareto fronts achieved by the investigated optimisers and the true Pareto fronts for all of the bi-objective functions used are visually inspected.
• The generational distance metric [20] is deployed to assess the degree of convergence of solutions by measuring the closeness of the achieved approximation sets to their corresponding true Pareto front.
• The spread metric [21] is used to assess the diversity of the approximation sets achieved by each optimiser. • The mean values for the generational distance and spread
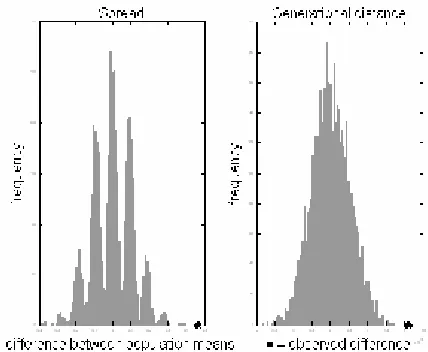
metrics are calculated for each of the 10 runs of each optimiser. The significance of the observed results is assessed using a randomization testing technique [22], described by Purshouse and Fleming [23], whose central concept is that an observed result which had arisen by chance would not appear unusual in a distribution of results obtained through many random relabellings of the samples (in this case, the generational distance and spread metric values).
The effectiveness of the CAO when tackling the DTLZ test functions with 3, 5 and 8 objectives is assessed by using two well-established binary metrics:
• The dominated distance metric (D-Metric), which computes the dominated distance between two sets of objective vectors [24].
• The “C-metric” of Zitzler et al. [16], which calculates the percentage of solutions in a certain approximation set that are dominated or equal to any solution in another competing approximation set.
In [1] it is shown that binary indicators such as these that compare the quality of one approximation set in terms of a certain criterion with another approximation set are suitable
metrics to use in order to conclude that a certain approximation set is better than another.
IV. RESULTS
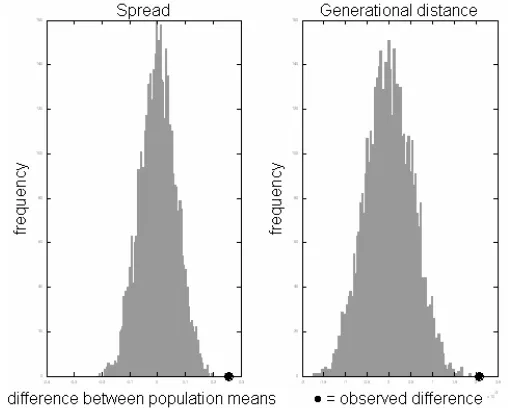
[image:7.612.319.562.328.527.2]The performance and utility of the CAO is investigated in this section. The effect of the introduced operator is examined by comparing the results achieved by NSGA-II and SPEA2 (operating on a population of 135 individuals) with the results achieved by their hybridised versions, NSGA-II/CAO and SPEA2/CAO (operating on a population of 90 individuals). The Pareto fronts achieved by NSGA-II and NSGA-II/CAO after a single run (50 generations) are illustrated for the test functions ZDT1 (Fig.6), ZDT2 (Fig. 8) and ZDT3 (Fig. 10), together with their true Pareto fronts. Figures 7, 9 and 11 show the results of the randomization testing technique which illustrates the significance of the spread metric values (diversity) and generational distance values (convergence) achieved over the 10 runs of the algorithms. It is clear from Figures 6, 8 and 10 that NSGA-II/CAO outperforms NSGA-II in approximating the true Pareto front of the convex, concave and discontinuous test function.
Fig. 6. Results achieved by NSGA-II and NSGA-II/CAO on ZDT1
metrics values was repeated 5000 times to test the significance of the observed results. A smaller spread metric value or generational distance value corresponds, respectively, to a better diversity and closeness to the true Pareto front. The real observations (black circles) lying to the right of the histograms denote a positive difference which favours the CAO hybridized optimiser.
(In this work, B is the CAO hybridized optimiser, in the
expressions: Mean (Spread_values (A)) - Mean
(Spread_values (B)) and Mean (GenerationlDistance_values
[image:8.612.308.562.108.312.2](A)) - Mean (GenerationlDistance_values (B)).
Fig. 7. Randomisation testing of the spread and generational distance metrics on ZDT1 (for NSGA-II and NSGA-II/CAO)
Fig. 8. Results achieved by NSGA-II and NSGA-II/CAO on ZDT2
The randomization testing method has demonstrated a significant and consistent improvement in the performance of the NSGA-II/CAO in terms of convergence towards the true
Pareto front and diversity over the 10 executions of the two algorithms. Note that NSGA-II/CAO consistently produces a more diversified approximation set compared to NSGA-II, which was operating on a larger population size.
[image:8.612.52.293.195.408.2]Fig. 9. Randomisation Testing of the spread and generational distance metrics on ZDT2 (for NSGA-II and NSGA-II/CAO)
Fig. 10. Results achieved by NSGA-II and NSGA-II/CAO on ZDT3
Similar observations are made when CAO is integrated in SPEA2. In fact, the CAO seemed to introduce even more benefits to the performance of SPEA2, which can be seen in Figures 12, 14 and 16 for the bi-objective scenarios. The results of the randomization testing are illustrated in Figures 13, 15, and 17, and, again, demonstrate the impact of the CAO on one of the best-performing MOEAs.
[image:8.612.313.552.358.584.2]objectives. The scalable test function DTLZ2, with 3, 5 and 8 objectives, was chosen to investigate the performance of the CAO.
[image:9.612.58.291.94.283.2]Fig. 11. Randomisation Testing of the spread and generational distance metrics on ZDT3 (for NSGA-II and NSGA-II/CAO)
[image:9.612.316.556.281.476.2]Fig. 12. Results achieved by SPEA2 and SPEA2/CAO on ZDT1
[image:9.612.57.292.325.518.2]Fig. 13. Randomisation Testing of the spread and generational distance metrics on ZDT1 (for SPEA2 and SPEA2/CAO)
Fig. 14. Results achieved by SPEA2 and SPEA2/CAO on ZDT2
[image:9.612.328.542.519.695.2]Fig. 16. Results achieved by SPEA2 and SPEA2/CAO on ZDT3
In a similar manner to the experimentations carried out on the bi-objective problems, the effect of the CAO is investigated by contrasting NSGA-II and SPEA2 with their CAO hybridized counterparts. In Tables 1 and 2, the dominated distance metric (D-Metric) and the C-metric are computed and the results are shown for each run of the algorithms. These metrics are binary metrics that highlight whether an approximation set resulting from an algorithm A is better than another approximation set resulting from an algorithm B. A negative D-metric (coverage difference of two sets) value denotes that the first input of the metric (e.g. Algorithm A in D-Metric (A, B)) is better than and dominates most or part of its second input (e.g. Algorithm B).
TABLE2
DD-METRIC AND C-METRIC RESULTS FOR DTLZ2(3)
A=NSGA-II/CAO AND B=NSGA-II
Run DTLZ2
(3 Objectives)
No: D-Metric
(A, B) .10-3
C-Metric (A, B)
C-Metric (B, A)
1 -3.823 8% 2.2%
2 -1.782 4% 2.2%
3 -4.436 10% 0%
4 -4.919 12% 2.2%
5 -3.156 7% 0%
6 -7.297 12% 0%
7 -5.791 13% 0%
8 -0.554 2% 2.2%
9 -9.837 16% 0%
10 -5.320 15% 0%
Mean
Value: -4.690 9.9% 0.88%
These experiments demonstrate that the fronts achieved by SPEA2 and NSGA-II are consistently outperformed by their counterparts deploying the CAO. In all cases, the DD-metric reveals results favoring NSGA-II/CAO and SPEA2/CAO over NSGA-II and SPEA2 for all dimensions of the problems investigated. Over the 10 executions of the algorithms, and despite operating on smaller population sizes, the solutions achieved by NSGA-II/CAO cover an average of 9.9% of the solutions achieved by NSGA-II for the 3-objectives problem.
TABLE3
DD-METRIC AND C-METRIC RESULTS FOR DTLZ2(5)
A=NSGA-II/CAO AND B=NSGA-II
DTLZ2 (5 Objectives) Run
No: D-Metric
(A, B) .10-3
C-Metric (A, B)
C-Metric (B, A)
1 -438.29 53% 4.4%
2 -347.56 47% 3.3%
3 -499.27 55% 2.2%
4 -965.20 83% 0%
5 -786.39 73% 1.1%
6 -535.95 56% 1.1%
7 -775.34 71% 2.2%
8 -295.53 42% 3.3%
9 -417.08 59% 3.3%
10 -473.30 62% 2.2%
Mean
Value: -553.39 60.1% 2.31%
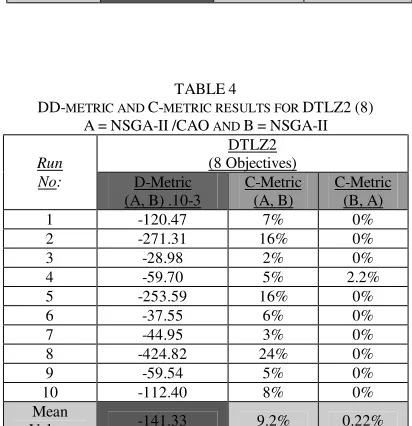
TABLE4
DD-METRIC AND C-METRIC RESULTS FOR DTLZ2(8)
A=NSGA-II/CAO AND B=NSGA-II
DTLZ2 (8 Objectives) Run
No: D-Metric
(A, B) .10-3
C-Metric (A, B)
C-Metric (B, A)
1 -120.47 7% 0%
2 -271.31 16% 0%
3 -28.98 2% 0%
4 -59.70 5% 2.2%
5 -253.59 16% 0%
6 -37.55 6% 0%
7 -44.95 3% 0%
8 -424.82 24% 0%
9 -59.54 5% 0%
10 -112.40 8% 0%
Mean
[image:10.612.59.286.54.252.2]Value: -141.33 9.2% 0.22%
[image:10.612.58.292.293.484.2] [image:10.612.335.542.333.537.2] [image:10.612.335.541.499.712.2]TABLE5
DD-METRIC AND C-METRIC RESULTS FOR DTLZ2(3)
A=SPEA2/CAO AND B=SPEA2
DTLZ2 (3 Objectives) Run
No: D-Metric
(A, B) .10-3
C-Metric (A, B)
C-Metric (B, A)
1 -3.376 7% 1.1%
2 -3.729 9% 0%
3 -3.067 3% 0%
4 -0.324 4% 1.1%
5 -2.992 15% 1.1%
6 -3.992 10% 0%
7 -1.714 6% 0%
8 -3.931 11% 1.1%
9 -1.144 3% 1.1%
10 -1.136 4% 1.1%
Mean
Value: -2.540 7.2% 0.66%
TABLE6
DD-METRIC AND C-METRIC RESULTS FOR DTLZ2(5)
A=SPEA2/CAO AND B=SPEA2
DTLZ2 (5 Objectives) Run
No: D-Metric
(A, B) .10-3
C-Metric (A, B)
C-Metric (B, A)
1 -12.91 22% 0%
2 -100.15 22% 0%
3 -39.58 16% 0%
4 -103.68 22% 1.1%
5 -186.58 34% 3.3%
6 -253.11 4% 0%
7 -198.26 31% 0%
8 -238.80 37% 0%
9 -6.31 9% 0%
10 -117.82 5% 3.3%
Mean
Value: -125.72 20.22% 0.77%
TABLE7
DD-METRIC AND C-METRIC RESULTS FOR DTLZ2(8)
A=SPEA2/CAO AND B=SPEA2
DTLZ2 (8 Objectives) Run
No: D-Metric
(A, B) .10-3
C-Metric (A, B)
C-Metric (B, A)
1 -28.92 2% 0%
2 -389.58 17% 0%
3 -243.64 11% 0%
4 -127.51 7% 1.1%
5 -8.10 1% 0%
6 -260.31 12% 0%
7 -246.03 13% 0%
8 -38.08 2% 0%
9 -76.08 4% 0%
10 -52.06 2% 1%
Mean
Value: -147.03 7.1% 0.21%
On the other hand, NSGA-II only scores an average of 0.88% coverage of the results achieved by NSGA-II/CAO, including several runs with 0% coverage. Similar C-metric observations are made for the 5- and 8-objectives versions of DTLZ2, with a remarkable average of 60.1% solutions coverage favouring NSGA-II/CAO over NSGA-II for the 5-objectives test
problem. SPEA2/CAO has out-performs SPEA2 on all three versions of DTLZ (Table 2). The highest coverage achieved by SPEA2 of the solutions obtained by SPEA2/CAO is 0.77%, while SPEA2/CAO covers at least an average of 7.1% of the approximation sets achieved by SPEA2. Again, in the 5-objectives version of DTLZ, SPEA2/CAO exhibits the most significant improvement in coverage over SPEA2. This feature deserves further study, using tools such as the heat maps of Pryke et al. [25], in order to understand why the performance on the 5-objectives version might be significant for this dimension of problem.
Further experiments were undertaken in an attempt to quantify the extent of superiority of the CAO hybridized optimisers. It was noted that, on average, the population size of NSGA-II and SPEA2 must be increased to a minimum of 200 individuals (more than twice the population size of NSGA-II/CAO and SPEA2/CAO) in order to match the quality of the fronts achieved by their hybridized counterparts. Thus, SPEA2 and NSGA-II require more objective function evaluations (around 750 more evaluations) to match the performance of their CAO hybridised equivalent optimiser. This conclusion holds for all the test functions used in this work.
The set of experiments conducted in this Section demonstrate the benefits of the CAO and the improvement it confers to two of the most established MOEAs.
V. CONCLUSIONSANDFUTUREWORK
A portable Convergence Accelerator Operator has been proposed for incorporation in existing algorithms for evolutionary multiobjective optimisation. This operator works by suggesting improved solutions in objective space and using neural network mapping schemes to predict the corresponding solution points in decision variable space. Two leading MOEAs have been hybridised through introduction of the CAO and tested on a variety of recognised test problems. These test problems consisted of convex, concave and discontinuous test functions, with numbers of objectives ranging from two to eight. In all cases introduction of the CAO led to improved convergence and solution diversity for comparable numbers of function evaluations. Indeed, for the bi-objective test problems, improved performance in diversity is achieved by the hybridised algorithms for smaller population sizes than those used by the standard algorithms.
functions. Clearly, one would not advocate use of CAO in such situations. However, in a real-world problem such as the ALSTOM gasifier problem [26], it was found that NN training time proved to be approximately one-hundredth of the time required to compute the ALSTOM gasifier problem objectives. Moreover, here we have not sought to optimise performance of the NN mapping methodology.
Thus, a portable operator has been described that can be incorporated into any MOEA to improve its convergence. Its value is in application to real-world problems where there is a substantial computational cost for objective function evaluation. Future work will focus on interactively executing the CAO on request by the DM and in the deployment of the operator in a progressive preference articulation technique, for example [27], to assist in guiding the search towards specific regions of interest (ROI). Further, the interpolation step factor used for objective space improvement is an application-dependent parameter and will be influenced by the landscape of the objective space. In the experiments undertaken here, step factors ranging from 0.01 up to 0.2 were tried before settling for h=0.1 as the step factor to be used for the tests. There is scope to explore the use of adaptive step factors as MOEAs explore the objective space.
REFERENCES
[1] Zitzler, E., Thiele, L., Laumanns, M., Fonseca, C., M., and Fonseca, V., G.,
d., Performance Assessment of Multiobjective Optimizers: An Analysis and Review. IEEE Trans. on Evolutionary Computation, 2003. 7(2): p. 117-132.
[2] Fleming, P., R.C. Purshouse, and R.J. Lygoe. Many-Objective
Optimization: An Engineering Design Perspective. in Evolutionary Multi-Criterion Optimization. Third International Conference, EMO 2005. 2005. Guanajuato, Mexico: Springer. Lecture Notes in Computer Science Vol. 3410.
[3] Purshouse, R.C., On the Evolutionary Optimisation of Many Objectives.
2003, Department of Automatic Control and Systems Engineering, The University of Sheffield: Sheffield, UK.
[4] Farina, M., A., A Neural Network Based Generalized Response Surface
Multiobjective Evolutionary Algorithm. in Congress on Evolutionary Computation (CEC'2002). Piscataway, New Jersey: IEEE Service Center.
[5] El-Beltagy, M.A., P.B. Nair, and A.J. Keane. Metamodeling Ttechniques
for Evolutionary Optimization of Computationally Expensive Problems: Promises and Limitations. in Proc. of the Genetic and Evolutionary Computation Conf. GECCO-99. 1999. San Francisco, CA: Morgan Kaufmann.
[6] Adra, S., F., Hamody, A., Griffin, I., and Fleming, P., J., A Hybrid
Multi-Objective Evolutionary Algorithm Using an Inverse Neural Network for Aircraft Control System Design. in 2005 IEEE Congress on Evolutionary Computation (CEC'2005). Edinburgh, Scotland: IEEE Service Center. [7] Nariman-Zadeh, N., Atashkari, A., Jamali, A., Pilechi, A., and Yao, X.,
Inverse modelling of multi-objective thermodynamically optimized turbojet engines using GMDH-type neural networks and evolutionary algorithms. Engineering Optimization. 37(5): p. 437-462.
[8] Darwin, C., The Origin of Species. 1859, London: John Murray.
[9] Holland, J.H., Adaptation in Natural and Artificial Systems. 1975, Ann Arbor: The University of Michigan Press.
[10] Deb, K., Agrawal, S., Pratap, A., and Meyarivan, T., A Fast Elitist Non-Dominated Sorting Genetic Algorithm for Multi-Objective Optimization: NSGA-II. in Parallel Problem Solving from Nature - PPSN VI. 2000. Berlin: Springer.
[11] Zitzler, E., M. Laumanns, and L. Thiele. SPEA2: Improving the Strength Pareto Evolutionary Algorithm. in EUROGEN 2001. Evolutionary Methods for Design, Optimization and Control with Applications to Industrial Problems. 2001. Athens, Greece.
[12] Gaspar-Cunha, A., and Vieira, A., S., A Hybrid Multi-Objective
Evolutionary Algorithm Using an Inverse Neural Network. in Hybrid Metaheuristics, First International Workshop, HM 2004. Valencia, Spain: IOS Press.
[13] Gaspar-Cunha, A., Vieira, A., S., and Fonseca, C., M., Multi-objective optimization: Hybridization of an evolutionary algorithm with artificial neural networks for fast convergence. in Fourth EU/ME Workshop on Design and Evaluation of Advanced Hybrid Meta-Heuristics. Nottingham, U.K.
[14] R. Jin, W.C., and T.W. Simpson, Comparative studies of metamodelling
techniques under multiple modelling criteria. Structural and
Multidisciplinary Optimization. 23(1): p. 1-13.
[15] Bishop, C.M., Neural Networks for Pattern Recognition. 1995, Oxford:
Oxford University Press.
[16] Zitzler, E., K. Deb, and L. Thiele, Comparison of Multiobjective
Evolutionary Algorithms: Empirical Results. Evolutionary Computation, 2000. 8(2): p. 173-195.
[17] Deb, K., Thiele, L., Laumanns, M., and Zitzler, E., Scalable
Multi-Objective Optimization Test Problems. in Proceedings of the 2002 Congress on Evolutionary Computation (CEC 2002). 2002. Piscataway, New Jersey: IEEE Service Center.
[18] Deb, K. and R.B. Agrawal, Simulated Binary Crossover for Continuous
Search Space. Complex Systems, 1995. 9: p. 115-148.
[19] Deb, K., Multi-Objective Optimization Using Evolutionary Algorithms.
2001, Chichester, UK: Wiley.
[20] Veldhuizen, D.A.V., Multiobjective Evolutionary Algorithms:
Classifications, Analyses, and New Innovations. 1999, Air Force Institute of Technology: Wright-Patterson AFB, OH.
[21] Deb, K., Pratap, A., Agrawal, S., and Meyarivan, T., A Fast and Elitist Multiobjective Genetic Algorithm: NSGA-II. IEEE Transactions on Evolutionary Computation, 2002. 6(2): p. 182-197.
[22] Manly, B.F.J., Randomization and Monte Carlo Methods in Biology. 1991,
London: Chapman and Hall.
[23] Purshouse, R.C. and P.J. Fleming. An Adaptive Divide-and-Conquer
Methodology for Evolutionary Multi-criterion Optimisation. in
Evolutionary Multi-Criterion Optimization. Second International
Conference, EMO 2003. 2003. Faro, Portugal: Springer. Lecture Notes in Computer Science. Volume 2632.
[24] Zitzler, E.: Evolutionary Algorithms for Multiobjective Optimization:
Methods and Applications, PhD thesis, Swiss Federal Institute of Technology (ETH), Zurich, Switzerland, 1999.
[25] Pryke A, Mostaghim S and Nazemi A: Heatmap Visualization of
Population Based Multi Objective Algorithms. to be published in
Evolutionary Multi-Criterion Optimization. Fourth International
Conference, EMO 2007. March 2007, Sendai, Japan
[26] Griffin IA, Schroder P, Chipperfield AJ and Fleming PJ: Multi-objective optimisation approach to the ALSTOM gasifier problem, Proc Inst Mech Engrs, Part I: J of Sys and Contr. Eng, vol 214, 2000, pp453-468
[27] Fonseca, C.M. and P.J. Fleming, Multiobjective Optimization and Multiple