Measuring student progress in school: a role for teacher judgement
366
0
0
Full text
(2) Measuring student progress in school: A role for teacher judgement. Thesis submitted by Martin Kennings CAUST BSc Adelaide, BSc (Hons) Qld September 2010. for the degree of Doctor of Philosophy in the School of Education James Cook University.
(3) Statement of access. I, the undersigned, the author of this thesis, understand that James Cook University will make it available for use within the University Library and, via the Australian Digital Theses Network for use elsewhere. I understand that as an unpublished work, a thesis has significant protection under the Copyright Act and I do not wish to place any restriction on access to this thesis.. 14/12/2010 Signature. Date. ii.
(4) Contribution of others Financial Support Financial support was gratefully received from the James Cook University School of Education, through Professor Trevor Bond, for the initial analysis of the data. A travel grant was provided by the School of Education to attend the 2005 Pacific Rim Objective Measurement Symposium in Kuala Lumpur to present a paper. Supervision Professor Trevor Bond was principal supervisor. Dr Helen Boon was second supervisor. Editorial Support Professor Bond and Dr Boon provided editorial advice as part of their supervision duties. Access to data The Department of Education and Children’s Services, South Australia agreed to the release of data for a re-analysis (see Appendix 1). Statistical Support Professor Bond provided detailed advice on the use of the Rasch model.. iii.
(5) Statement on sources. Declaration. I declare that this thesis is my own work and has not been submitted in any form for another degree or diploma at any university or other institution of tertiary education. Information derived from the published or unpublished work of others has been acknowledged in the text and a list of references is given.. 14/12/2010 Signature. Date. iv.
(6) Acknowledgements I am deeply grateful for the encouragement and support provided by my partner Margie Darcy over what turned out to be a longer period than expected. Without her positive approach in the face of a diminished social, family and work life, this document would not exist.. She very generously. accepted the limitations imposed by a student life. I am appreciative of the support from Alan Green, of the Department of Education and Children’s Services, in clearing the way for the release of data. The data are unique in South Australian education, and while parts were widely reported in the years of their creation, the opportunity to explore them for other messages has been rewarding and I believe tells us that the professional role of teachers as observers of learning is under-utilised. The assistance of Gary O’Neill in the creation of the data files is greatly appreciated. The data would not exist in the form analysed without the conceptual and software development of Ian Probyn who was able to create an intuitively simple data collection process. He has also provided a sympathetic ear to the ongoing summary of what his data seem to say. The writing project would not have commenced without personal references from John Ainley and Richard Jenkin, nor without an initial encouragement possibly now long forgotten, from Professor John Keeves. Articulating the concepts in the thesis was made possible through the strong support and ongoing reassurance of Professor Trevor Bond. He graciously agreed to supervise a complete stranger who tracked him down through the wonders of the internet. A more encouraging supervisor would be difficult to find. His openness to a less conventional approach and his non-pedantic and sensitive supervision are deeply appreciated. Dr Helen Boon came late to the supervisory challenge of helping a slow and ponderous writer complete a manuscript. I am grateful she was prepared to wade through the draft chapters to improve their logic and readability. Neither supervisor is responsible if any errors of logic or fact remain. Finally to our children, all four of them and their partners, my four sisters and my friends in Adelaide, Canberra and Sydney who suffered with or because of me, I acknowledge your support and regular inquiries about progress. To Sue Pender, a regular encourager and mentor, a particular thankyou. I dedicate the thesis to Tess Caust, who showed it is never too late to study and that a passion for something can make a difference.. v.
(7) Abstract The documentation of learning is a weakness of all schools and systems, leading to complaints about the lack of information and a press for teacher accountability.. Current solutions to increase. information about learning and improve accountability promote standardised (and national) testing of student cohorts and/or better use of often-archaic classroom assessment results. System-wide testing, while not without value for some purposes, is very limited in its contribution to improving classroom practice. In particular testing is a process detached from the needs of classroom teachers and given the time for results to be returned, unhelpful in timely decision making. Assessment of students by teacher judgement is a general feature of classroom teaching but its quality is often unknown. This thesis addresses the history and application of teacher judgement assessment and then analyses teacher and test assessments of the same populations of students (from South Australia in 1997 and 1998). The analyses establish the comparability of the assessment processes, and thus one basis for inferring the quality of teacher judgement. The purpose is to test the feasibility of using teacher judgement assessments, calibrated to scales of learning, as the prime data to record, manage and report learning and monitor its change over time. In curricula structured in levels, as apply in some Australian school systems, one possibility for recording assessments is in the form of the level judged to be most recently achieved. Over an extended time frame a general trajectory of learning for each student can be documented. If the progress made as a student learns new skills, knowledge and understandings could be assessed and recorded by a teacher in finer detail than a level, a basis might exist for documenting learning with utility for teachers, students and all other parties interested in being kept informed. These two broad ideas, the teacher’s concept of learning in a specific strand of the curriculum and the mandated test as one method to describing that learning, are brought together to appraise the feasibility of creating methods of assessing and recording learning, built upon the constructs rather than any particular test or assessment process. The data analysed are unique. They are limited to two calendar years (1997 and 1998) for two learning areas and are useful in estimating the potential for teacher and test assessments to track the learning development of students over time in the same fashion. Within the limitations of the data the potential of teachers to record the learning development of students directly, using broad scales to locate their current learning status is confirmed. Very strong similarities are found in the general characteristics of the data once the teacher scale is transformed to the scale of the test. Both assessment processes show increments in mean leaning for age cohorts grouped in 0.1 of year of age and smooth growth trajectories with age and Year level. Both processes show marked gender differences for English language, trivial gender differences for mathematics. Both processes show. vi.
(8) within Year level patterns by age and gender that are consistent with test data analyses found elsewhere. When case studies for individual schools are examined, it is clear that at some sites teachers assess with high correlation to the test scores, indicating the potential for easily recalibrating some teachers to increase the match of the assessments from the two processes. It appears potentially feasible to design classroom and school assessment systems on the basis of teacher judgement assessment data as the prime data source. Test data can be integrated readily and usefully into the scheme. The issues that need further consideration are outlined along with the general implications for support to teachers, training and re-training and some broader data management issues for classrooms, schools and systems. Subject to the resolution of a number of design issues, schools and school systems might then optimise the skills of teachers as both managers and documenters of learning.. This. would allow for the professional skills of teachers to be acknowledged and capitalised upon. Rather than the assessment skills of teachers being directly derided, or derided by implication as a consequence of externally imposed testing procedures, testing arrangements might be reconfigured to support and confirm the quality of teacher judgement assessments.. vii.
(9) Table of Contents Statement of access. ii. Contribution of others. iii. Statement on sources. iv. Acknowledgements. v. Abstract. vi. Table of Contents. viii. List of Tables. xii. List of Figures. xiii. CHAPTER 1: MAPPING THE TOPICS OF INTEREST. 1. Overview of this chapter. 1. Overview of subsequent chapters. 2. Elaborating the main character: Teacher Judgement Assessment. 3. Assessment as a support to learning. 7. Propositions considered. 9. Key questions considered. 10. Learning: an operational definition for this thesis. 11. Progression. 14. Personalised learning. 16. Understanding learning with student test data. 17. Strengths and limitations of the study. 17. Summary. 18. CHAPTER 2: EARLY APPROACHES TO QUANTIFICATION OF LEARNING AND SCALE DEVELOPMENT. 20. Timeline of the key examples considered. 21. 1845 Massachusetts: the first system wide examination process in the US. 22. 1850-1862 Fisher Scale Book and numerical approach. 23. 1892-1908 Rice’s educational surveys and Stone’s enhancements. 25. 1909-1911 Courtis and the influence of Stone. 27. 1910 Thorndike and the handwriting scale. 32. 1912 Thorndike’s concept of scaling. 34. 1912 Hillegas: judging the quality of prose. 35. 1913 Criticisms of scaled approaches from researchers of the period. 38. 1914-1916 Thorndike’s scaling for reading. 39. 1916 Trabue’s completion test. 40 viii.
(10) Item Difficulty and the key link to educational measurement. 41. 1916 A ‘level’ approach for composition. 42. 1950s - A new way forward.. 43. Summary. 44. CHAPTER 3: LEVELLED CURRICULA, LEARNING PROGRESS AND SKILLS TESTS 47 The development of ‘Profiles’ and ‘Levels’ for Australia. 47. Implementation in South Australia. 50. Confirmation of the value of profiles – application in studies and student assessment. 55. Criticisms of a level approach. 57. A Parallel Universe - the Testing Approach. 58. Summary. 59. CHAPTER 4: TEACHER JUDGEMENT ASSESSMENT– ISSUES, METHODS, AND CASE STUDIES. 61. Issues in comparing teacher judgement and test assessments. 62. Methods comparison. 65. Clarifying how teachers make judgement assessments.. 71. Studies/examples of the use of teacher judgement in research and classroom practice. 74. Do accurate teacher assessments influence learning?. 108. A summative overview of teacher judgement -Harlen. 110. Summary. 111. CHAPTER 5: THE TRAJECTORIES OF LEARNING, GROWTH AND GROWTH INDICATORS. 114. Establishing trajectories of learning growth with age and Year level. 115. Learning growth in cohorts - examples of growth trajectories for the test score means of groups of students 123 Patterns by age within Year level. 137. Case studies where further analysis of test data might provide scaled indicators of student development. 141. Comments on individual learning trajectories. 145. Summary. 147. CHAPTER 6: SOUTH AUSTRALIAN TEST DATA FOR 1997 AND 1998. 149. Literacy and Numeracy Tests. 149. Rasch model analysis of the Literacy and Numeracy tests. 150. ix.
(11) The trajectory of Literacy test scores. 153. The trajectory of Numeracy test scores. 165. Overview of the Literacy and Numeracy test models. 173. Summary. 175. CHAPTER 7: SOUTH AUSTRALIAN TEACHER JUDGEMENT ASSESSMENTS: 1997 AND 1998. 177. The data collection revisited. 177. The English Learning Area. 179. The Mathematics Learning Area. 186. Common findings across two data collection periods and learning areas. 194. Acceptability of teacher judgement assessment to teachers. 195. Concluding comments. 196. CHAPTER 8 TEACHER AND TEST ASSESSMENT COMPARED. 198. Equating Teacher and Test scales. 198. Comparing Teacher and Test Assessments for Common Students with Teacher Assessments Rescaled. 212 Extending the comparison of Teacher and Test assessments beyond Years 3 to 5. 224. Is the variability in assessment alignment a within-teacher or between-teacher effect?. 236. Summary. 237. CHAPTER 9 WEAVING THE THREADS TOGETHER. 241. Appraising the principal character. 241. The main findings from the data analysis. 241. The propositions: findings. 244. Responses to questions posed in Chapter 1. 245. Design elements for a teacher judgement assessment scheme. 250. Addressing the remaining questions from Chapter 1. 256. In conclusion - the fate of the principal character. 266. REFERENCES. 270. Appendix 1 Letter of approval for data access. 294. Appendix 2 Adult literacy trends with age. 295. Appendix 3 Adequacy of the Key Stage Test Assessments. 297. Appendix 4 Scale changes CSF to VELS in Victoria. 299. Appendix 5 NAPLAN data and model.. 301. Appendix 6 North West Evaluation Association -Data confirming learning trajectories. 312. x.
(12) Appendix 7 Mathematics Assessment for Learning and Teaching (MaLT) in England. 314. Appendix 8 Curriculum, Evaluation and Management (CEM) Centre-Consistency in the learning difficulty Scale for numerals as an example of potential tools to support teachers. 317 Appendix 9 Chicago-Strategic Teaching and Evaluation of Progress (STEP). 325. Appendix 10 Individual learning trajectories.. 330. Appendix 11- Summary of equating approaches and issues. 340. Appendix 12 Summary of Rasch analysis statistics for teacher judgement assessment data. 342. Appendix 13. Estimates of the proportions of teachers at various levels of correlation and match to the test scales. 349. xi.
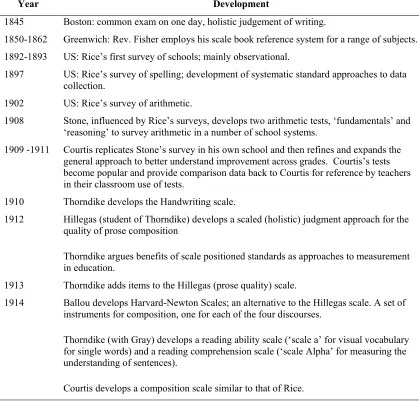
(13) List of Tables Table 2.1 Timeline of historical developments in assessment considered. 21. Table 4.1 Table of Kappa values. 67. Table 4.2 Summary of Matches of Teacher and Test Assessments -Worcestershire LEA; data for 1997 to 2001 combined, with level as unit of reporting. 86 Table 4.3 Matches of Grand Average Teacher and Test Assessments-Worcestershire LEA, 1997 to 2001, with 1/3 level as unit of reporting 87 Table 5.1 Estimated effect sizes for annual reading growth based on the model for NAPLAN trajectory –compared with US effect size estimates for Reading and Mathematics. 129 Table 6.1 Students in the Basic Skills Test Program (BSTP) included in data analysis. 150. Table 6.2 Summary of Winsteps Fit and Measurement Statistics, Literacy 1997. 151. Table 6.3 Summary of Winsteps Fit and Measurement Statistics, Numeracy 1998. 151. Table 6.4 Literacy – Mean scores by Year level and Testing Year. 155. Table 6.5 Literacy-Comparison of original records with subsets assigned dates of birth. 160. Table 6.6 Comparison of 2001, 2002 and 2004 Literacy score statistics - full cohorts. 161. Table 6.7 Literacy Model-main statistical characteristics. 162. Table 6.8 Numeracy – Mean scores by Year level and Testing Year. 166. Table 6.9 Numeracy-comparison of original records with subsets assigned dates of birth. 169. Table 6.10 Numeracy Model-main statistical characteristics. 169. Table 7.1 English Learning Area by Year level–1997: General Statistics. 181. Table 7.2 Mathematics Learning data by Year level –1998: General Statistics. 190. Table 7.3 Ratings by teachers of their confidence in the process and in their specific assessments. 196 Table 8.1 Correlations of English teacher assessments with Literacy test assessments – 1997. 200. Table 8.2 Correlations of Mathematics teacher assessments with Numeracy test assessments-1998200 Table 8.3 General Statistical Characteristics of common cases of Teacher assessments and Test assessments, 1997 and 1998 201 Table 8.4 1997 Comparison of Teacher and Test assessments of common students. 214. Table 8.5 1998 Comparison of Teacher and Test assessments of common students. 215. Table 8.6 1997 “Deming” Regression and Kappa values for Teacher and Test assessments of common students at selected sites 219 Table 8.7 1998 “Deming” Regression and Kappa values for Teacher and Test assessments of common students at selected sites 222 Table 8.8 Estimates of the percentage of teachers in categories of correlation with the tests crosstabulated with the rate of match to the test-1997 and 1998 data combined 236. xii.
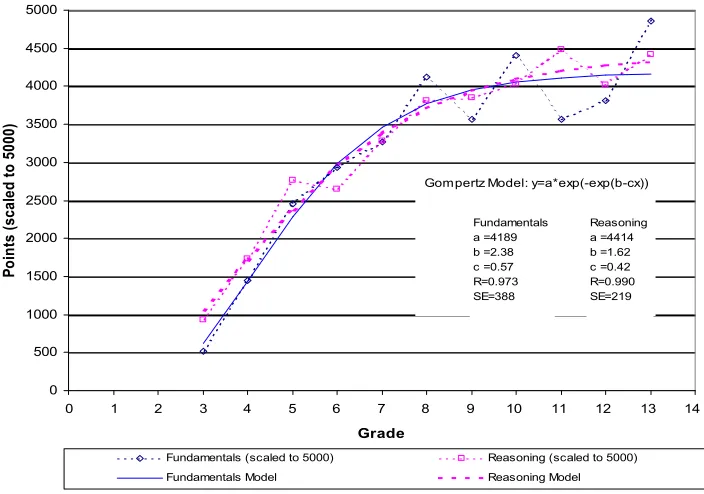
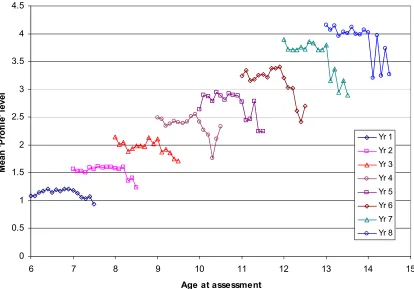
(14) List of Figures Figure 2.1 Points Scores for Correct Steps-Fundamentals v Reasoning. 29. Figure 2.2 Trabue’s Completion Test from Engelhard (1982). 42. Figure 4.1 Time Series of Teacher Assessments (TA) compared with Test Assessments. Percentage achieving at or above Level 4 for 11 year olds (Key Stage 2)-England 81 Figure 4.2 Teacher Assessments (TA) compared with Test Assessments. (2008), by Local Authority (LA). Percentages achieving at or above Level 4 and Level 5 for 11 year olds (Key Stage 2) England 83 Figure 4.3 Comparison of Times series of Year 3 Teacher and Tests Data (values estimated from original graphs in Victorian Auditor-General, 2009) 94 Figure 4.4 Comparison of Times series of Year 3, 5 and 7 Teacher and Test Data –Reading (values estimated from original graphs in Victorian Auditor-General, 2009) 95 Figure 4.5 Comparison of Times series of Years P-10 Teacher Assessment Data –Mathematics (Number 1-6/Chance and Data 7-10), by gender 97 Figure 4.6 Reading: All students-Mean Teacher Judgement Assessments 1999-2005 by Year level. 99 Figure 4.7 Reading: All students-Plot of regression parameters for each year 1999 to 2005.. 100. Figure 5.1 Physical Growth Curve of American Males-median curve.. 118. Figure 5.2 Model of NAPLAN Reading 2008 with indication of spread of data. 126. Figure 5.3 Comparison of effect sizes at each Year level-NAPLAN, US. 130. Figure 5.4 NWEA Reading Norms data (2002) with fitted curves. 132. Figure 5.5 Effect size estimates for NWEA, NAPLAN and general US norms for Reading. 133. Figure 5.6 Model of Mathematics Development - Mathematics Assessment for Learning and Teaching, (MaLT). 134. Figure 5.7 Effect sizes for Mathematics Assessment for Learning and Teaching compared with pooled US tests 135 Figure 5.8 SAT 9 Reading Scores Grade 2 (2002)- from Grissom (2004, p. 6). 138. Figure 5.9 Reading Test scores Early Childhood Longitudinal Study (ECLS) by age at testing 139 Figure 5.10 Numbers in Estimated Order of Difficulty to Say Aloud-all numbers to 20, samples from thereon (Difficulties relative to ‘1’) 143 Figure 5.11 Overview of STEP Letter Identification and Letter Sound Item Maps (from Figure 5 Kerbow & Bryk, 2005) 144 Figure 6.1 Literacy mean scores –Cross-sectional view with model trajectory. 158. Figure 6.2 Literacy mean scores –Longitudinal view with model trajectory. 159. Figure 6.3 Comparison of Literacy Model to the Framework Model. 163. Figure 6.4 Literacy Model by Year level. 164. Figure 6.5 Literacy Model by Year level and gender. 165. Figure 6.6 Numeracy mean scores-Cross-sectional view with model trajectory. 167. Figure 6.7 Numeracy mean scores –Longitudinal view with model trajectory. 168. Figure 6.8 Comparison of Numeracy Model with the Framework Model. 170. xiii.
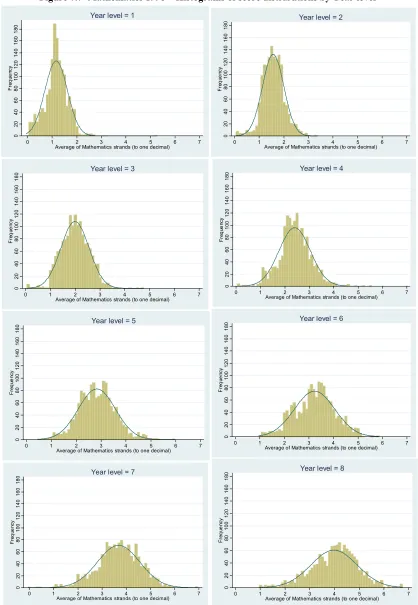
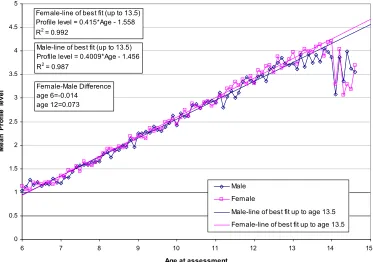
(15) Figure 6.9 Numeracy Model by gender. 171. Figure 6.10 Numeracy Model by Year level. 172. Figure 6.11 Numeracy Model by Year level and gender. 173. Figure 6.12 Summary of the Literacy Model and Numeracy Model by Year level and gender. 174. Figure 7.1 English 1997 – Histograms of score distributions by Year level. 180. Figure 7.2 Teacher Judgement assessments - English Learning Area 1997 by strand and Year level 182 Figure 7.3 Teacher Judgement assessments - English Learning Area 1997: means, medians, standard deviations and inter-quartile ranges, by Year level 183 Figure 7.4 Teacher Judgement assessments - English Learning Area 1997: Mean profile level of Reading and Writing strands combined, by age 183 Figure 7.5 Teacher Judgement assessments - English Learning Area 1997: Mean profile level of Reading and Writing strands combined, by gender of students 185 Figure 7.6 Teacher Judgement assessments - English Learning Area 1997: Mean profile level of Reading and Writing strands combined, by age within Year level 186 Figure 7.7 Mathematics 1998 – Histograms of score distributions by Year level. 188. Figure 7.8 Teacher Judgement assessments- Mathematics Learning Area 1998 by strand and Year level 189 Figure 7.9 Teacher Judgement assessments - Mathematics Learning Area 1998: means, medians, standard deviations and inter-quartile ranges by Year level 190 Figure 7.10 Teacher Judgement assessments - Mathematics Learning Area 1998 Mean profile level all strands combined, by age 191 Figure 7.11 Teacher Judgement assessments- Mathematics Learning Area 1998 – Mean profile level of all strands combined, by gender of students 192 Figure 7.12 Teacher Judgement assessments - Mathematics Learning Area 1998: Mean profile level of all strands combined by age within Year level 193 Figure 8.1 Comparison of Equi-percentile equating by separate Year levels 3 and 5 with the combined data set for Years 3 and 5 - 1997 English.. 204. Figure 8.2 1997 Profile to Test scale equating by equating method, Year 3 and 5 data combinedEnglish 206 Figure 8.3 1997 English Teacher assessments – Conversion of Profile to Test Scale result: Independent Rasch model.. 210. Figure 8.4 1998 Mathematics Teacher assessments – Conversion of Profile to Test Scale result: Independent Rasch model 211 Figure 8.5 A comparison of the final result of the unanchored conversion of the teacher scale to the test scale compared to the anchored result 212 Figure 8.6 1997 English/Literacy - Scatterplot of Teacher assessment and Test assessment invariance 213 Figure 8.7 1998 Mathematics/Numeracy - Scatterplot of Teacher Assessment and Test assessment invariance 215 Figure 8.8 Match rates 1997 - English/Literacy. 217. Figure 8.9 Match rates 1998 - Mathematics/Numeracy. 217. xiv.
(16) Figure 8.10 1997 English/Literacy: Comparison of Teacher assessments (Rasch model equated) and Test Model assessments at selected sites. 219 Figure 8.11 1998 Mathematics/Numeracy: Comparison of Teacher assessments (Rasch model equated) and Test Model assessments at selected sites 222 Figure 8.12 1997 English/Literacy-Mean of Teacher assessments (Rasch model equated) and Test Model assessments compared, by gender and Year level 224 Figure 8.13 1998 Mathematics/Numeracy-Mean of Teacher assessments (Rasch model equated) and Test Model assessments compared, by gender and Year level 225 Figure 8.14 1997 English/Literacy Test and Teacher mean scores at each Year level-Expression to equate means 227 Figure 8.15 1997 English/Literacy-Comparison of original teacher trajectory with the Year level mean re-scaled teacher trajectory and with the Test model trajectory 227 Figure 8.16 Effect of Alternative equating processes on Teacher Test assessment comparisons-using Mathematics/Numeracy 1998 228 Figure 8.17 1997 English-Mean of Teacher assessments (Year level means equated) and Test Model assessments compared by age 230 Figure 8.18 1997 English-Mean of Teacher assessments (Year level means equated) and Test Model assessments compared by gender by age 231 Figure 8.19 1997 English-Mean of Teacher assessments (Year level means equated) and Test Model assessments compared by age within Year level 231 Figure 8.20 Plots of points from Test and Teacher assessments from Figure 8.19 (Points are restricted to those within the appropriate range for each Year level). 232. Figure 8.21 1998 Mathematics-Mean of Teacher assessments (Year level means equated) and Test Model assessments compared by age within Year level 233 Figure 8.22 1998 Mathematics Plots of points from Test and Teacher assessments from Figure 8.21 (Points are restricted to those within the appropriate range for each Year level) 234 Figure 8.23 1998 Mathematics-Mean of Teacher assessments (Year level means equated) and Test Model assessments compared by age within Year level: Female students 235 Figure 8.24 1998 Mathematics - Mean of Teacher assessments (Year level means equated) and Test Model assessments compared by age within Year level: Male students 235. xv.
(17) Chapter 1: Mapping the topics of interest …when an author auditions his main character, he doesn’t really know if he’ll pull his weight in the novel until it’s too late to choose another one. Hilary Mantel, 2005. A vision for the future is that assessments at all levels—from classroom to state—will work together in a system that is comprehensive, coherent, and continuous. In such a system, assessments would provide a variety of evidence to support educational decision making. Assessment at all levels would be linked back to the same underlying model of student learning and would provide indications of student growth over time. Pellegrino, Chudowsky & Glaser (Eds.), 2001, p. 9. Overview of this chapter The purpose of this first chapter is to introduce the main character, teacher judgement assessments, and to outline a number of topics deemed relevant to understanding assessmentmanaged learning. The thesis is an evidence-based ‘thought experiment’. What if teacher judgement assessments could provide the critical data needed to optimise the learning growth of every student? To focus the character development two propositions are proposed. One is that teacher judgement assessment is already of such quality that classroom, school and system assessments could be based on teacher judgement alone. The second takes a less radical position, proposing that there is sufficient evidence to support the notion that assessment based on teacher judgement has the potential to provide most of the data needed to improve the effectiveness of teaching and learning in schools. To distinguish between these two propositions a range of issues relevant to teacher judgement as an instrument of student assessment and improved student learning are reviewed. This first chapter sets the general context. The propositions are detailed and the general questions to be addressed outlined.. An understanding of how ‘learning’ is understood in this thesis is. described. Approaches to the measurement of learning and diagnosis of the support required are outlined and consideration is given to the reasons why improvements in measuring learning within classrooms might improve student learning. The use of standardised and school system-wide tests as one approach to the measurement of learning, and as a reference for teacher judgement assessments is considered. Assessments based on teacher judgement, whatever their current quality, are ubiquitous classroom practice. Processes to understand and enhance their quality, along with how. 1.
(18) regular individual students assessments might increase the effectiveness and targeting of instruction, are considered. The three Ps of Fullan, Hill and Crevola (2006) required for a ‘breakthrough’ in improving classroom instruction; Personalisation, Precision and Professional Learning, help frame this exploration of assessment-managed learning. To these a fourth P, ‘Progressions’ (Critical Learning Instruction Paths [CLIPs] in Fullan et al. terms) is added. These progressions, this thesis speculates, might provide teachers with more than just reference maps to assist the observation and management of learning. Progressions may help address a key problem with level structured curricula, inadequate processes for recording progress within a level, making the level structure very limited as a scale of learning progress. More than a reference map however is required to assist teachers in easy understanding of what are the most effective options for support to students. Fullan et al. introduce the concept of a knowledge base (Fullan et al., 2006, p. 82). The knowledge base would provide access to relevant research and practical advice for teachers. Elements perceived to be relevant to the advocated knowledge base that would assist teachers in their assessments and the consequential management of learning are addressed in subsequent chapters. Overview of subsequent chapters Chapter 2 covers aspects of the early 20th century history of assessment. Scales for describing or recording learning were first developed in this period. The early scales (constructs) are examined to illustrate that their developers had already established techniques that might have enhanced the role of teachers as managers of individual learning through assessment, had these techniques developed differently. Chapter 3 covers more recent curriculum and assessment developments of the 1980s and 1990s. It documents how the general principles of teacher judgment were adopted in the unrealised 1990s Australian national curriculum, and then in South Australia. It further outlines how the data analysed later in the thesis came into existence. Chapter 4 reviews teacher judgement assessment and what studies have revealed about teachers’ skills in estimating learning status. How judgements are made, how they are recorded and how well they compare with other forms of assessment are all addressed. Chapter 5 illustrates how general learning trends are made more transparent by test data. Cross-sectional and longitudinal views of grouped and individual student data identify the understanding of learning that time series data provide. Elements of this analysis typify the information that might be part of the Fullan et al. advocated knowledge base. Models of test. 2.
(19) data with age and Year level1 are developed to estimate how test scores change with Year level. Test results for Year levels not tested can then be imputed from the models. Case studies, where information from psychometric analyses provide a refined appreciation of the challenges to students in learning specific skills, are identified as examples of ways to create observational tools for teachers. Chapter 6 summarises data from tests for South Australia and estimates test data for Year levels where students were not actually tested. The findings from Chapter 5 relating to trajectories of learning are applied to support the development of the model to impute missing data. Chapter 7 summarises teacher judgement assessment data for cohorts from Year levels 1 to 8. These assessments use the implied scale of each strand of the level curricula applying in South Australia in 1997 and 1998 in English and mathematics, to provide a level achieved for each student and the teacher’s estimate of the student’s progress towards meeting the criteria for the next level. Chapter 8 draws the two perspectives together to establish how well one matches the other. The historical development, the teacher judgement review and the data analyses are then used to provide, in the concluding chapter, a basis for speculating about the role of teacher judgement assessment into the future. Elaborating the main character: Teacher Judgement Assessment Schools and classrooms are full of data but not often in forms that provide an understanding of individual student learning development. The prime data that should be of interest are those that will indicate how each student is progressing, how his or her learning is growing. For all the current data available, in the form of grades, marks or outcomes achieved, it is rare that data can be provided in a form that illustrates, particularly to an individual student, that the student’s learning is growing. An alternative source of data can be considered: the principal character of the thesis, ‘assessment through holistic teacher judgement’ regularly referred to in brief, as ‘teacher judgement assessment’. Teacher judgement assessment is rather elderly, already over 100 years old. The history presented in Chapter 2 and the deeper analysis of some data from the 1990s raise some possibilities for using data from teacher assessments in a similar way to standardised test assessments, but allowing greater flexibility in how the data are obtained.. 1. Throughout ‘Year level’ is capitalised to avoid confusion with calendar year and/or (curriculum). level. On occasions Year level and Grade are used interchangeably.. 3.
(20) It is argued that teacher judgement assessment is ubiquitous; it is entangled in all classroom assessments. In its usual current form teacher judgement assessment does not conform to standards that provide data adequate for students to self-reference their development or for classrooms and schools to have data for longitudinal purposes. The thesis is concerned with whether it is feasible to adapt teacher judgements in such a way that they can be considered to be consistent across teachers through linking the judgements to common criteria organised as development scales. Teacher judgements might then provide the student self-referenced data which can indicate, in general terms, skills2 under development as a standardised test might, be easily recorded in an longitudinal student record system and be able to be used to make the learning visible. Teacher judgement assessment presumes that a teacher, provided with appropriate background information about likely sequences of skill development and with the opportunity to observe students daily, using whatever observation tools they choose to apply (observation, conversations, teacher designed tests, standardised tests and myriad other possibilities), can posit a hypothesis about where each student is placed in their learning status. It is assumed that many teachers already hold conscious (or subconscious) hypotheses, but that the language for expressing these hypotheses is limited and ambiguous. Under processes proposed later the teacher would refine any hypothesis about a student by integrating all the observations into a single judged learning status estimate for any given strand of learning and record the value in a database of student records. A strand is a cohesive set of skills within a learning area that can be seen as having developmental order and dependence relationships. Prior skills are required to be consolidated before later skills in the set are established. Based on the time-series of assessments for a student, the teacher would reconsider the form of support required through reviewing the trajectory of data points to that time point. Reviewing the trajectory could be as simple as the teacher looking at the graph of learning status over time. Reviewing might also draw upon more sophisticated analyses using learning models built from a range of statistical models drawing on teacher judgement and test data. These analyses might draw on artificial intelligence approaches to. 2. For convenience and ease of writing (and reading) the term ‘skills’ is used generically here to cover a. wide range of similar and approximately similar terms such as knowledge, comprehension, skill, thinking strategy or behavioural disposition. While the distinctions in meaning are important in many circumstances, and might have significantly different connotations, for the purpose of most of the arguments in this thesis the use of the generic term will simplify the expression of the ideas. This process is consistent with the approach adopted by Rupp and Templin (2008) for a similar purpose in their review of diagnostic classification models (see Rupp & Templin, p. 228).. 4.
(21) offer suggestions to teachers about particular students, an implied feature of the Fullan et al. knowledge base. Thus the essence of the thesis is: Could teacher judgement data meet the requirements needed for the longitudinal recording of individual student learning?. Can teacher judgement. assessments provide the critical data needed to manage and optimise the learning growth of every student? One technical approach to establishing learning status is the use of well-designed tests, aligned to the outcomes to be attained. Based on the Rasch model of test analysis, the scale of difficulty of test items provides a scale for measuring the learning status of the students. The unit of the Rasch scale is the logit, the log odds unit, with items spaced in terms of their relative difficulties. This thesis considers the feasibility of using the test scales to report learning status, as distinct from requiring the use of specific tests. These scales might be able to be used more broadly for formative purposes. The scales provide a numerical language to record a student’s learning status at any time. The value recorded has meaning in terms of skills likely to have been mastered and those under development. If test scores and the test scales to which they relate are to be seen as the currency of learning as implied by National Assessment Program Literacy and Numeracy (NAPLAN) in Australia and No Child Left Behind (NCLB) in the US, is it possible that teachers can use the same currency by using the test scale in their own assessment processes?3 This approach emphasises the construct rather than the particular assessment (Wiliam, 2010; Wright, 2001) and derives its usefulness from the positions of specific skills on the construct scale. It is the locations of these increasingly complex skills that then give meaning to the scale. The changing locations of students as their learning progresses along the scale indicate skill sets achieved and skills under development. The freeing of the construct from particular 3. It is not critical at this stage to be concerned about which of a wide range of possible options for the. numbering convention for a given scale might be used. The principle of teacher assessments and test assessments using the same scale convention is all that is required to be considered. The language of the test scale (the numerals and their meanings) could be used by teachers, or the language of the teacher scale could be used in reporting test scores. For the consideration of the principle either is possible. In practice the teacher scale has already been used to report test scores and teacher judgement assessments in Victoria and in the UK national curriculum. Should the reader consider that the feasibility of teachers using the test scale must have been established already by the existence these two examples, the published evidence is limited (covered in Chapter 4) and the use by teachers effectively limited to summative assessments.. 5.
(22) tests and specific forms of assessment enables higher-level skills, unable to be assessed by bulk testing (deep understanding of an idea as an example) to be incorporated into the assessment scheme. Wright (2001) argues the feasibility of a notional general construct, a scale of Academic Achievement Units, based of a broad combination of unspecified assessment processes whereby a scale of 1000 units (based on a transformation of the logit unit) might run from 0 for first grade to 1000 for college entry. Immediately test practitioners, teachers, parents and students know accurately where the student stands; how much the student has advanced; how much is yet to go; and the difficulty level of the material to teach next. (Wright, 2001, p 784) This description is from the boldest of all the advocates of the Rasch Model. Such a unitary scale, assuming a single underlying dimension of learning, is less likely to be practical for individual teachers as might be separate scales for each broad aspect of the school curriculum e.g. strands as raised earlier. A more practical set of vertically aligned scales for specific skills is advocated by Jorgensen (2004). Supporting the broadness of the possible approaches to assessment, Griffin (2007) explains that the Rasch model can be applied very generally, particularly the Linacre (2006) expression of the model, which has very few restrictions on scoring procedures. Accordingly the nature of the tasks used to establish the likely range of a student’s skill development is very wide: The task could be a test question, a set of multiple choice items, an essay, a performance, a speech, a product, an artistic rendition, a folio, a driving test, the dismantling and reassembling of a motor car engine, building a brick wall, giving a haircut to a client, or whatever was related to some attribute of interest. The attribute could be an ability, an attitude, a physical performance, a procedure, an interest, a set of values or a generalised competence in an area of learning. (Griffin, 2007, p.89) This description of the interaction of construct scales and approaches to assessing students highlights the importance of observation and the integration of expressed behaviours in the assessment of students at any time. The prime agent for doing this would seem to be the teacher. Assuming it were possible for teachers to estimate student locations on the construct scales directly, a range of pedagogical options flow from knowing the current position. This thesis does not deal with the specific pedagogical consequences for any given location on the scale, this being the domain of teachers and a wider range of support experts. Teacher judged locations on the construct scales, however, provide a possible basis for the simple and regular. 6.
(23) recording of the longitudinal progress of students, totally compatible with tests designed for the same constructs. The keeping of meaningful records without wasting the time of teachers is one perceived benefit. Optimising teachers’ professional roles using their observation and expert judgement skills is another benefit. The practicality of the process depends upon, among other factors, the extent to which teachers can make their judgements consistently, using the test construct scale and whether the test scale itself reflects an adequate model of the actual learning development. Alternative methods of recording learning progress using checklists of skills achieved or using rubrics within levels or sublevels may be adequate for some purposes but do not provide the utility of the construct score. The benefits of the scale approach to learning are developed throughout the thesis. The essence of the Rasch model in test analysis is that student scores and test item difficulties can be aligned on the same scale. The student receives a score that has meaning in terms of what it estimates the student can do, give or take an error of estimation in the score. In principle, subsequent tests aligned to the same scale provide student scores with which earlier scores can be compared to reveal growth. The distance between scores indicates the amount of growth, subject once again to the impact of measurement error. Points along the scale have meaning in terms of indicating the extent to which specific skills are likely to have been developed. The test process is however limited, expensive and constrained in the range of skills and behaviours that can be assessed. Even with increased frequency of tests, reduced time-lag in score provision and improved estimation processes through computer managed custom tests built in real time for each student, the amount of data provided to classrooms is likely to be small relative to that able to be provided directly by teachers. Assessment as a support to learning There is strong evidence that the use of assessment data can improve the effectiveness of teaching (Black & William, 1998; Crooks, 1988; Hattie & Timperley, 2007). The evidence also suggests that improved teacher effectiveness requires professional development in the understanding and use of assessment data (Timperley, 2009). As considered above, the wide range of observations made by teachers provide a rich source for them to continuously hold hypotheses about the learning status of each student. These observations can be systematically planned - in the form of teacher developed tests, projects, assignments, probes, listening to reading aloud, student reports, standardised tests, conversations with individual students or any other planned observations. Also likely to play. 7.
(24) a part in hypothesis development are unplanned observations of class events, casual conversations, general student interactions and other spontaneous behaviours. Can a process be anticipated where teachers are assisted in the integration of their observations such that their observations, and those of colleague teachers, can be recorded in a consistent way? This is considered as theoretically possible through the combined use of holistic teacher judgements, empirically developed learning progressions (average learning orders), acrossteacher moderation and some simple processes to record the current hypothesis on learning status of each student. One option for simplifying recording, as raised earlier, is the scales of tests adapted for teacher assessment without the need to necessarily use the tests themselves. An anticipated result is a radically altered language for consistently documenting and monitoring learning. These thoughts are not new. Fisher (1862) and Thorndike (1912) outlined views consistent with this approach and a range of approaches has developed since then. The current national curriculum in England, and the 1990s approach to a national curriculum framework in Australia, provide some ingredients for the thesis considerations. Teachers in England and Victoria have already been required to use teacher judgement assessments in parallel with test assessments. How well these assessments match tests assessments is revealed in Chapter 4. Teachers in Scotland and more recently in Wales, along with teachers in Queensland and the Australian Capital Territory, have used teacher judgement assessment (with moderation processes) for all assessment purposes including summative school graduation assessments. While these latter Australian examples are discussed briefly in Chapter 4 the thesis concentrates of cases where parallel assessment by teacher judgement and testing have occurred. The works of Fullan, Hill and Crevola (2006), Griffin (2004, 2007), Forster and Masters (2004), Masters and Forster (1996), and Wilson (2004) on sequences of likely learning orders, leading to scaled learning progressions or maps, provide a basis for monitoring learning development. The judgement assessments of many teachers in the 1997 and 1998 in South Australia (see Chapters 7 and 8) provide an insight into whether teachers can judge the learning status of students with similar results to tests. Teachers alone, as the prime resource for each student, have the potential to integrate and manage learning development. Unsurprisingly, effective schools research indicates it is the teacher that is the most critical resource in enhancing learning (Hattie, 2003; McKinsey & Company, 2007; Rowe & Hill, 1996). If teacher judgements were used to provide time ordered (longitudinal) learning data for each student, a rich basis for reflection on and 8.
(25) reconsideration of instructional or learning approaches would be available. In the manner similar to that of the medical professions, diagnosis and treatment would be integrated through their interaction over time. As for medical assessments some laboratory test data are available in the form of standardised, online and statewide test results. The integration of that data to resolve what to do next with each student is a professional judgement of each teacher. No other educational agent can both integrate the data and apply the appropriate treatment. The unfolding of the issues in the thesis expands on what the general benefits might be. The longitudinal view of individual students should contribute to the breakthrough in instruction hoped for by Fullan et al. (2006). A breakthrough defined by Ellmore, in the foreword to Fullan et al., is “a sudden, dramatic and important discovery or development…[and/or] a significant …overcoming of a perceived obstacle, allowing the completion of a process.” (Fullan et al., 2006. p. xi) Teacher judgement assessment with the right support is seen as potential key contributor to the breakthrough. In the process, the professional role of the teacher can be markedly enhanced. Propositions considered The thesis proposes two propositions to be examined. The first proposition The principal proposition is that teachers’ judgements of students’ learning status (scale values), in school systems where they have been applied, are valid indicators of student learning status for all students and for all teachers, and are already of such quality and reliability that classroom, school and system assessments can be based on teacher judgement alone. The second proposition The second proposition is that teacher judgement assessment can be enhanced to the point where it can provide valid indicators of student learning status, in the form of scale values. As a metaphor of the general continua of learning, the first proposition is at the extreme positive end. The second proposition can be placed at varied positions on the continuum based on the evidence and speculation about potential. One possibility is the extreme of ‘not feasible to enhance’ (zero). Many other placements are possible. Evidence to examine these propositions is obtained from the degree to which teacher judgements a) are internally consistent and b) can consistently match independent test assessments such as those obtained from statewide or national tests.. 9. As a methods.
(26) comparison problem, it is postulated that tests and teacher judgements are alternative methods of assessing the same learning dimensions. Key questions considered To explore the propositions a number of related questions are addressed regarding the relationships of tests and teacher judgement. These are: 1. What is the history of student assessment using scales to establish learning status? In particular what is the history of teachers using observer judgement? 2. What does the research literature on teacher judgement say about what teachers do and how well they do it? 3. What does analysis of the 1990s data from the South Australian adoption of national profiles (Curriculum Corporation, 1994a) reveal about the ability of teachers to estimate the position of students on scales described by increasingly complex learning behaviours? 4. What proportion of SA teachers were effective on-balance assessors of students? 5. What do teacher-generated and test-generated data reveal about the learning development of students throughout their 12 or more years at school? 6. Assuming some teachers are relatively effective on-balance assessors, what tools and processes might be required to maintain and enhance their skills and to develop the skills of less effective assessors? 7. How might the design of classroom and school processes be changed to optimise the use of teacher judgements? 8. What options might need to be considered for those teachers who have limited abilities in on balance judgement unimproved by practice? 9. What would be the implications of greater use of teacher judgement assessment to preservice teacher education? Evidence establishing the effectiveness of teacher judgement and thus which of the two propositions is supported is considered. Understanding the abilities of teachers as on-balance assessors leads to the consideration of practices to support teachers to develop and maintain the quality of their assessments. A number of other issues are considered. Can scales of teacher and test assessment be regarded as equal interval, an attribute that would be fundamental to the application of statistical and arithmetic processes to student scores? How can teacher-generated data be used to track individual student development over time and across year levels?. How might subsets of these data be used for school management. 10.
(27) purposes? What policies and processes might be developed to take advantage of teachers’ judgement skills? An important consequence of the acceptance of either of the two teacher judgement assessment propositions will be the enhanced recognition of teachers as professional, trustworthy managers of learning. A negative finding would have significant implications for all assessment and teaching polices independent of method. The scope of the topic is very broad. As a result a wide range of sources have been scanned for relevance. The task of selecting those to explore and cite has been difficult and clearly many sources and examples, deemed relevant in the view of any particular reader, may have been ignored. It is a reflection on the range of material potentially available that there are some bodies of work, ostensibly on the same issues, that do not reference each other. The treatment in this thesis makes no claims to being inclusive of all possible sources. Learning: an operational definition for this thesis Fundamental to this study is an operational definition of learning. Dictionary definitions are brief and inadequate. Example dictionary definitions are: Knowledge got by study. (Concise Oxford, 5th Edition) The cognitive process of acquiring skill or knowledge. (Princeton University WordNet 3.0, 2006) Knowledge or skill gained through schooling or study. (The American Heritage Stedman's Medical Dictionary) The act, process, or experience of gaining knowledge or skill. (The American Heritage, Stedman's Medical Dictionary) None of these definitions is adequate in conveying the full understanding of learning as applied in this thesis. Even the comprehensive Knowing What Students Know (Pellegrino, Chudowsky, & Glaser, 2001) in its recent significant treatment of learning, cognition and assessment, addresses learning without a clear initial definition of the concept, notwithstanding the recognised need to describe other important terms; cognition, cognitive sciences, educational measurement, assessment, and testing are all defined. An understanding of the use of the term is developed over many pages in that text. Based on a text analysis of cases of the use of ‘learn’ it can be inferred that learning as understood by Knowing What Students Know has some of the following elements.. 11.
(28) Learning is a process that leads to a “transformation of naive understanding into more complete and accurate comprehension (p. 4). Learners construct their “understanding by trying to connect new information with their prior knowledge” (p. 62). Learning leads to “increasingly well-structured and qualitatively different organizations” (p. 71) as knowledge develops. Development and learning are differentiated. Some forms of knowledge are acquired by all or most individuals “in the course of normal development, while other types are learned only with the intervention of deliberate teaching” (p. 80). Studies of learning “show that in a responsive social setting, learners can adopt the criteria for competence they see in others and then use this information to judge and perfect the adequacy of their own performance” (p. 89). Expertise is developed by “practice and feedback” (p. 91). Learning is not just “a matter of acquiring more knowledge and skills, but as progressing toward higher levels of competence as new knowledge is linked to existing knowledge” (p. 115). Deeper understandings replace earlier understandings and “ordered levels of understanding and direction are fundamental: in any given area, it is assumed that learning can be described and mapped as progress in the direction of qualitatively richer knowledge, higher-order skills, and deeper understandings” (p. 115). The understanding of the concept of learning adopted in this thesis is consistent with the elements above except in one respect. Apparent developmental (maturational) changes in performance are included as part of the understanding of learning. This is done for a practical reason, the inability in this study and in educational practice generally, to partition them out. Explorations of time related effects on student learning in school (Cahan & Davis, 1987; Hattie, 1999; Kissane, 1982) identify an underlying small but important effect of the passage of time (or small increases in age) on learning improvement. Within-Year level effects are shown with age (Cahan & Davis, 1987; Grissom, 2004; Tourangeau, Nord, Lê, Pollack, & Atkins-Burnett, 2006; Williams, Wo & Lewis, 2007). For each 0.1 of a year increase in the mean age of cohorts grouped in these fine age categories, the mean scores on tests increase consistently until the mean age exceeds the normal age range for the cohort for that grade or Year level (see Chapter 5). For some subsets of students (the lower socio-economic status groups) the effect of a period of no instruction (summer break) is to go backwards (Alexander, Entwisle & Olson, 2001; Cooper, Nye, Charlton, Lindsay & Greathouse, 1996). However for many students the positive age/time learning trend appears to be maintained with time (Cahan & Davis, 1987; Tourangeau, Nord, Lê, Pollack, & Atkins-Burnett, 2006 shown later in Chapter 5, Figure 5.9). There are indications. 12.
(29) in Adult Literacy surveys4 that this positive maturational element combined with experience and ongoing skill refinement continues for many people into their early 30s, well after they cease formal institutional learning. After age 35 mean literacy and numeracy skills appear to reduce slowly with age, signifying an average negative impact of maturation from this age. Thus reading or mathematics performance, on average, can improve for many students with time even when instruction is not occurring. The cause may be practice or maturation. Assessments of learning improvement over time for individuals or groups may therefore include a maturational element and it makes sense to make this clear in the definition of learning. In assessments related to scales of learning, analogous to rulers as considered in this thesis, the apparent maturational contribution to measured learning, whatever its cause, will be included automatically and unidentifiably in the assessments. An analogy with height is that the height measurement is not discounted for interactions between genes, maturation and nutrition. Together they lead to particular heights and rates of growth at phases of an individual’s development. The inclusion of maturation (development in some descriptions) is not to imply a direct genetic influence in the differential learning rates of individuals, only that across individuals similar general trends with age/time apply. Thus learning is defined for the purpose of this research to be an increase in knowledge, comprehension, skill, thinking strategy or behavioural disposition (generically called ‘skills’), through experience, direct study or through some natural developmental change in cognitive functioning. The increase is seen as having greater complexity than just acquiring more skills, but rather, moving through ordered levels of understanding, progressing in the direction of qualitatively richer knowledge, higher-order skills, and deeper understandings. The definition of learning proposed is strongly influenced by the vision of Wilson and Sloane (2000) and other advocates of the Rasch model for measurement. The proposed definition implies learning is an increase in the repertoire of behaviours. The increase can only be inferred from some externalisation of the behaviour or performance of the learner. What led to the increase and how it is managed within the mind is unknowable from external, nonintrusive, observation.. Conclusions about causes for various rates of learning growth. (treatments, forms of teacher intervention, maturation), while often plausible, are also ambiguous, inferential and probabilistic.. 4. Appendix 2 shows simple analyses of Australian and US data that suggest the literacy skills of the. average population increase generally until age 30 to 35, even though only small proportions remain involved with formal education programs in schools, TAFE and universities.. 13.
(30) It seems reasonable to assume that learning is most likely stored through a change in brain function but that understanding the storage mechanisms is not necessary for the observation and measurement of learning from a teacher’s perspective. This is not to imply that the understanding of cognitive / memory processes is not useful for teachers, only that learning should be observable without an understanding of detailed brain function, provided the teacher is aware of what behaviours to be looking for. Learning, whether active, induced or maturative, cannot be disaggregated readily into these component contributions, certainly not in the classroom. Experience (somewhat passive accommodation of external activity) or study (more active participation and interaction with information and individuals) are indistinguishable in their relative contribution to a changed state. They are not mutually exclusive categories. Whether any learning has occurred must be inferred through some external manifestation of the internal state of the learner, making knowing that state difficult. In summary, learning is a dynamic process of the individual, for which a state value can be estimated at any point in time. A reading of that state can be taken by a specific standard interaction (some form of standardised pencil and paper or computerised test) or through a series of observations by, and interactions with, a teacher; or even self-assessed by the student. It is assumed that multiple processes can be used to estimate the quantum of learning at any time and that varied processes will arrive at essentially the same result. To know if the results by different processes are essentially the same requires the use of a scale that is common to all processes, or a process of transformation between scales such as that in Fahrenheit to Celsius temperature scale conversions. This requirement must be met whether different assessment processes are applied to an individual at a single point in time, or the same processes are applied over different points of time. Progression Complementary to the concept of a scale to quantify learning growth is the understanding of the likely order of development of particular skills and higher-level behaviours. One concept that comes out of the empirical analysis of learning growth is the progress map (Forster & Masters, 2004). The progress map is also known as a Critical Learning Instruction Path (CLIP) (Fullan et al., 2006) or more generally a learning progression (Popham, 2007; Heritage, 2008). These progressions can be traced back, in a form, to the handwriting and prose scales of Thorndike (1910) and Hillegas (1912) or even to Fisher (1862) discussed in depth in Chapter 2. The exploration of item orders in a graphical form by Thurstone (1925) provides another view of progression. Progressions offer a context for teachers as they make. 14.
(31) personalised assessments. In principle they should help teachers make decisions about what support is appropriate for the student. The Statements and Profiles for Australian Schools (SPFAS) (Curriculum Corporation, 1994a) approximated a form of progression. The profiles described criteria for achieving each particular level within any strand within a designated learning area. The specific criteria for a level, however, did not have a likely order of achievement. For this reason it was hard for teachers to record the progress of learning within a level. The teacher could report that some, all or most of the criteria had been met. Had some criteria been provided with empirically confirmed probabilities of being met earlier than others, the criteria themselves could have been seen as spaced along the dimension as useful indicators of progress. Progress maps have been refined through applying Rasch model approaches to place skills, as distinct from test items, in empirically derived orders. The maps/scales are used in some school systems, through teacher observations, to support classroom based teacher-assessments and curriculum development.. The classroom applications take the form of ordered. descriptions, appropriately spaced, of what students can do at particular points on a described spectrum of tasks, skills and items (Forster & Masters, 2004; Heritage, 2008; Popham, 2007). These scales (or maps) are, in principle, independent of the particular testing or observation practices that have led to their creation. That is, a variety of methods can be used to estimate the learning status for any student.. The scales illustrate a most likely order in which. understanding (or learning) develops. As well, what might be demonstrated by a student at a particular point on the spectrum, and the relative learning distance between skills, can be described.. The order is quite likely to represent a dependency relationship between. successive skills.. The learning distance is an estimate of the relative difficulty of any. particular skill compared with an easier skill. Learning distance is then a likely correlate of time to learn as well as the probability of success. The Rasch model can be seen as a tool to assist in the scaling of a set of ordered skills in a way that might assist teachers in monitoring how a student is progressing. Progress maps are taken up in later chapters as one technique to assist assessment precision and to help understand progress in learning. The map or progression need not be an ordering of particular skills but an ordering of tasks of known difficulty. Learning progressions equivalents for reading can be created by the use of tools that establish a difficulty level for a text. The Lexile Framework (Stenner, Burdick, Sanford & Burdick, 2007; Stenner & Stone, 2004) uses the Rasch model to establish the difficulty of texts on the basis of word frequency and sentence length. Observing the quality of the interaction of a student with a text of known difficulty provides a basis for a teacher to estimate the reading learning status. A complementary tool to estimate the difficulty of. 15.
(32) mathematics tasks (Quantile Framework for Mathematics, 2010) provides a parallel process in mathematics that could be used for direct teacher estimation of learning status. Both processes provide the equivalent of learning progressions based on task difficulty, to assist teachers in their observation and management of learning. More than progressions, however, are required to assist teachers in an understanding of what are the most effective options for support to students. Fullan et al. (2006) introduce the concept of a knowledge base of “integrated … expert instructional systems in which the hard work is taken out of the task of collecting and using the data.” (p. 82). Among a number of elements, the knowledge base would include links to “updated information on students, their progress and other relevant classroom, school and system characteristics.” (p. 82). The proposition of this thesis is that much of the progress data may be able to be obtained from teacher judgement assessments. Held in the knowledge base would be the progressions (CLIPs), advice on teaching strategies, appropriate resources, research evidence and a range of other information useful to the teacher. Access to relevant research and practical advice would be at a teacher’s fingertips along with the opportunity for teachers to report their own success with particular intervention strategies. Elements perceived to be relevant to the proposed knowledge base are addressed in subsequent chapters. Personalised learning Fullan et al. (2006) argue that instruction should be personalised, as should assessment. For assessment to be personal it must be seen as a personal event rather than a group event. The student needs to perceive the teacher as considering and responding to him or her alone. This needs the teacher to show interest in the student personally through conversations, sensitive questioning and taking account of personal products and behaviours. To make a personal approach practical the teacher needs techniques for assessment and recording that are easily carried out. One element that might influence that ease is the map for the general journey and the progress the students makes along the likely learning continuum for particular curriculum areas. The more understanding the teachers has of what to expect, based on the general empirical observation of student development, the more prepared the teacher is for the task of relating the personal to the likely patterns of development.. The better understood the. framework, the easier it is to see where each student seems to fit at any time. Insights into the richer context for learning development are available to teachers from empirical research on student learning. The general patterns from system wide and international testing provide some of those insights but the path of each student is likely to be unique and not necessarily related to the group patterns. The complex issue of individual growth is addressed briefly in Chapter 5.. 16.
(33) Understanding learning with student test data Data from the application of tests to large cohorts of students have helped researchers understand some features of learning in school populations. It is unlikely that teachers, in general, are aware of the subtleties of these findings relating to learning within Year level by age, rates of learning development and gender patterns. Thus it is unlikely that teachers have the knowledge and ability to manipulate their assessments based on what is known to be obtained from tests, so that their assessments will reflect the same subtleties by intention. If teacher assessments of students do reflect these subtleties it is likely to be confirming of the validity of teachers observations. Chapters 5 and 6 provide an understanding of what test data show about rates of improvement with Year level and by age within Year level and learning area specific gender patterns. Chapter 8 explores whether teacher assessments show the same patterns. Strengths and limitations of the study One of the strengths of the study is its uniqueness. Assessment data from South Australian teachers in 1997 and 1998 are compared with tests for the same student populations. The author is unaware of any comparable data set that provides insights into the skill of teachers’ on-balance judgements of student learning status when compared to test measures, although similar data may be available in Victoria and England. Furthermore the number of cases included is large and a number of convenient replications are included (two calendar years, two grades of actual test data, 8 Year levels of teacher assessments). The data provide insights into the skills of teachers as assessors using a curriculum framework for making their assessments. One limitation of the study is the lack of information about multiple judgements from individual teachers. It was a deliberate design requirement of the data collection that teachers not be identified. A few cases of anonymous individual teacher patterns can be established in smaller schools, where only one class in a Year level is offered. Since the assessments cannot be grouped by individual teacher and because of the low number of cases per teacher, it is not possible to establish the variability within the assessments of individual teachers with confidence. This makes the size of the professional development task difficult to estimate for policy purposes, if say the second proposition of the thesis is accepted. A further limitation is the inability of the study to track individual students over an extended period, to see how teacher judgements (or test scores) track learning status with time. The literature review considers a small number of cases where the variability in the patterns of individual student development is considered. These longitudinal studies make clear the wide range of patterns likely to be encountered by teachers observing the learning growth of 17.
(34) students. The data analyses in Chapters 6, 7 and 8 provide no information on these individual student learning trends. An implication of the consideration here is that all teachers should be seen as longitudinal researchers using regular on balance judgements through observation and other techniques including standardised testing where feasible, to document and manage the learning of individual students. Summary This thesis is a speculative search addressing what might be required to adjust assessment practices in classrooms so that student-learning growth can be made visible to, and by, teachers. Specifically, the ways in which the observations of teachers can be converted into scale values representing student learning status are considered. The thesis is concerned with examining possibilities rather than proving or disproving the validity of new ways to manage student learning. The data analyses are important in providing evidence to judge the relative acceptability of the two main propositions. However, the bigger picture issue of how calibrated teacher judgement assessments might be developed to underpin student assessment processes, and thus the learning processes in schools and school systems, is of prime concern. Teacher judgement assessments, whatever their current quality, are ubiquitous classroom practice. Thus there is a need to make them of as a high a quality as possible. The three Ps of Fullan et al. (2006), Personalisation, Precision and Professional Learning, required for a breakthrough in classroom instruction to a “more precise, validated, data-driven expert activity that can respond to the learning needs of individual students” (Fullan et al., p. xv), help set the scene for framing the exploration of assessment-managed learning in the classroom. To these a fourth P, Progressions (Critical Learning Instruction Paths in Fullan et al. terms), can be added. These progressions, it is speculated, might provide teachers with a reference map to assist the observation and management of learning and address a key problem of learning scales within level curricula, the lack of detail for progress within a level. As a consequence of the wide gradation increments inherent in level structures, teachers’ judgement assessments are restricted to a small range of values. Alternative scaling processes might allow a range of values where scale increments could relate to days or weeks of learning rather than to months. Summaries of changes in the means of learning status as Year level and age increase are considered through the research literature and particular school system records. This research assists in the development of a hypothetical model to estimate test data for untested SA Year levels as part of the data analyses. It also establishes patterns of cohort development as shown in longitudinal studies. Since the trajectories of individual learning appear to vary 18.
(35) markedly from the trajectories of the means of cohorts, individual pathways of learning development over time are addressed briefly. The degree of comparability of teacher and test assessments is then described, drawing on data from the South Australia school system. The final chapter draws together the key findings of the thesis into general conclusions about the acceptability of the main propositions and addresses the questions raised earlier in this introductory chapter. The issue of quality and consistency in teacher judgement assessment is not new. The next chapter establishes that approaches to the consistency of classroom teachers’ assessment have been considered for more than a century. Some of these approaches had the unrealised potential to build on teachers’ judgements as the prime source of consistent classroom derived data documenting student learning.. 19.
Figure

+7


Outline
Early approaches to quantification of learning and scale development
Levelled curricula, learning progress and skills tests
Teacher judgement assessment– issues, methods, and case studies
That the data meet criterion 1 and 2 and that the data points for each student are at exactly the same point on both scales, that is on the identity line subject to joint SEs of the
Test (+0.27) compared with Teacher 2006, 2007 adjusted
The trajectories of learning, growth and growth indicators
NAPLAN Reading model
South Australian test data for 1997 and
Related documents
The impact of the tower blockage during the constant inflow conditions at t min and t max is visible in the radial distribution of rotor thrust and rotor torque (Fig.. 5 the
The review aimed at assessing the osteopromotive potential as well as soft tissue and temporomandibular joint (TMJ) cartilage healing properties of simvastatin by summarizing
in addition, some universities offer specialized pharmaceutical biotechnology courses in PharmD programs during the professional years (Medical University of South
In this context, the paper aimed to analyze the dynamics of the EU-27 wine production, consumption, export and import, identifying the main trends and aspects
Two major reasons induced the proposal of this second frame format: the support for multiple data rates and performance. The three proposed frame formats for the IR PHY.. c) The
Our model depicts the hierarchical relationship between state performance- based funding policy; decisions by institutional leadership and senior administration,
As the US building industry continues its recovery throughout 2008, and as housing starts continue their climb back to levels reflecting the underlying need for new homes,
