White Rose Research Online URL for this paper: http://eprints.whiterose.ac.uk/148023/
Version: Published Version
Monograph:
Mazzone, P. orcid.org/0000-0003-0944-8031, Carlton, J. orcid.org/0000-0002-9373-7663 and Griffiths, H. orcid.org/0000-0003-4286-5371 (2019) Summary vision screening data : Israel. Report. Vision Screening Country Reports . EUScreen
©2019 EUScreen. For reuse permissions, please contact the publisher.
[email protected] https://eprints.whiterose.ac.uk/
Reuse
Items deposited in White Rose Research Online are protected by copyright, with all rights reserved unless indicated otherwise. They may be downloaded and/or printed for private study, or other acts as permitted by national copyright laws. The publisher or other rights holders may allow further reproduction and re-use of the full text version. This is indicated by the licence information on the White Rose Research Online record for the item.
Takedown
If you consider content in White Rose Research Online to be in breach of UK law, please notify us by
Summary Vision Screening Data: Israel
Produced as part of Work Package 3
Paolo Mazzone1, Dr Jill Carlton2, Dr Helen Griffiths3
1. Research Assistant, School of Health and Related Research, University of Sheffield, United Kingdom (UK) 2. Senior Research Fellow, School of Health and Related Research, University of Sheffield, United Kingdom
(UK)
3. Senior Lecturer, Academic Unit of Ophthalmology and Orthoptics, University of Sheffield, United Kingdom (UK)
Information provided by Dr Lisa Rubin, Paediatrician,Head of the Department of Community
Health, School of Public Health, University of Haifa & Professor Yair Morad,Ophthalmologist, Sackler Faculty of Medicine, Tel Aviv University
23rd January 2019
Disclaimer: This is a summary report representing the responses from a country representative working within eye care services of the country reported. This report does not represent conclusions made by the authors, and is the product of professional research conducted for the EUSCREEN study. It is not meant to represent the position or opinions of the EUSCREEN study or its Partners. The information cannot be fully verified by the
authors and represent only the information supplied by the country representatives.
T E U H
Summary Vision Screening Data: Israel
ii
Contents
1 Glossary of Terms: Vision Screening iii
2 Abbreviations vi
3 Population and Healthcare Overview 1
4. Vision Screening Commissioning and Guidance 3
5. Screening programme 5
5.1 Vision screening - Preterm babies 5
5.2 Vision screening - Birth to 3 months 5
5.3 Vision screening - 3 months to 36 months 5
5.4 Vision screening - 36 months to 7 years 5
6. Automated Screening 10
7. Provision for Visually Impaired 11
8. Knowledge of existing screening programme 12
8.1 Prevalence/Diagnosis 12
8.2 Coverage 12
8.3 Screening evaluation 13
8.4 Treatment success 13
9. Costs of vision screening in children 14
9.1 Cost of vision screening 14
9.2 Cost of treatment for amblyopia 14
9.3 Cost of Treatment for strabismus 14
9.4 Cost of treatment for cataract 14
Summary Vision Screening Data: Israel
iii
1 Glossary of Terms: Vision Screening
Abnormal test result A
detected under good conditions. The result on screening
Attendance rate The proportion of all those invited for screening that are tested and receive a result:
Invited for screening includes all those that are offered
the screening test.
T
Attendance rate provides information on the willingness of families to participate in screening.
Compliance with referral (percentage)
The percentage of those who are referred from screening to a diagnostic assessment that actually attend the diagnostic assessment.
Percentage of compliance provides information on the
willingness of families to attend the diagnostic assessment after referral from screening.
Coverage The proportion of those eligible for screening that are tested and receive a result:
Eligible for screening includes those within the population
that are covered under the screening or health care programme.
Tested and
Factors such as being offered screening, willingness to
participate, missed screening, ability to complete the screen, and ability to document the screening results will influence the coverage.
Summary Vision Screening Data: Israel
iv
Example: If 100 children with visual deficit are screened, and 1 child passes the screening, the percentage of false negatives is 1%.
False positives The percentage of children with normal vision that are referred from screening to a diagnostic assessment.
Guidelines Recommendations or instructions provided by an authoritative body on the practice of screening in the country or region.
Vision screening professional
A person qualified to perform vision screening, according to the practice in the country or region.
Inconclusive test result
A not be
detected due to poor test conditions or poor cooperation of the child.
Invited for screening Infants/children and their families who are offered screening.
Outcome of vision screening
An indication of the effectiveness or performance of screening, such as a measurement of coverage rate, referral rate, number of children detected, etc.
Untreated amblyopia Those children who have not received treatment for amblyopia due to missed screening or missed follow-up appointment.
Persistent amblyopia Amblyopia that is missed by screening, or present after the child has received treatment.
Positive predictive value
The percentage of children referred from screening who have a confirmed vision loss.
For example, if 100 babies are referred from screening for diagnostic assessment and 10 have normal vision and 90 have a confirmed visual defect, the positive predictive value would be 90%.
Prevalence The percentage or number of individuals with a specific disease or condition. Prevalence can either be expressed as a percentage or as a number out of 1000 individuals within the same
demographic.
Programme An organised system for screening, which could be based nationally, regionally or locally.
Protocol Documented procedure or sequence for screening, which could include which tests are performed, when tests are performed, procedures for passing and referring, and so forth.
Summary Vision Screening Data: Israel
v
Referral criteria A pre-determined cut-off boundary for when a child should be re-tested or seen for a diagnostic assessment.
Risk babies / Babies at-risk
All infants that are considered to be at-risk or have risk-factors for vision defects/ophthalmic pathology according to the screening programme.
Two common risk factors are admission to the neonatal-intensive care unit (NICU) or born prematurely. However, other risk factors for visual defects may also be indicated in the screening
programme.
Sensitivity The percentage of children with visual defects that are identified via the screening programme.
For example, if 100 babies with visual defects are tested, and 98 of these babies are referred for diagnostic assessment and 2 pass the screening, the sensitivity is 98%.
Specificity The percentage of children with normal vision that pass the screening.
For example, if 100 babies with normal vision are tested, and 10 of these babies are referred for diagnostic assessment and 90 pass the screening, the specificity is 90%.
Target condition The visual defect you are aiming to detect via the screening programme.
Summary Vision Screening Data: Israel
vi
2 Abbreviations
ACT Alternating Cover Test
AR Autorefraction
AS Automated Screening
CT Cover Test
CV Colour Vision
EI Eye Inspection
EM Eye Motility
Fix Fixation
GDP Gross Domestic Product
GP General Practitioner
Hir Hirschberg
NICU Neonatal-intensive care unit
NGOs Non-Governmental Organisations
PM Pursuit Movements
PPP Purchasing Power Parity
PPV Positive Predictive Value
PR Pupillary Reflexes
RE Retinal Examination
ROP Retinopathy of Prematurity
RR Red Reflex Testing
SV Stereopsis
VA Visual Acuity
Summary Vision Screening Data: Israel
1
3 Population and Healthcare Overview
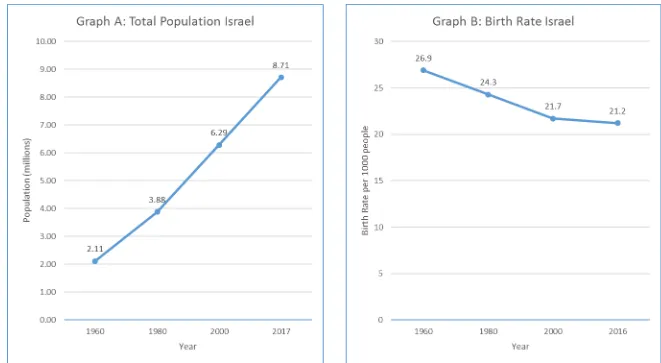
The population of Israel is 8,712,400 (World Bank, 2018a) and birth rate is estimated at 21.2 births/1,000 population in 2016 (World Bank, 2018b). The change in population and birth rate from 1960 to 2017 is shown in Figure 1, graphs A and B respectively.
Israel has a reported population density of 403 people per square kilometre in 2017 and this has risen from 101 people per square kilometre in 1961 (World Bank, 2018c). In terms of healthcare facilities, the total density of hospitals in 2013 was 0.56 per 100,000 population (WHO, 2016a). Infant mortality in 2017 is estimated at 2.9 deaths/1,000 live births in total (World Bank, 2018d).
The average life expectancy in Israel is estimated at 82.4 years (World Bank, 2018e), with a death rate of 5.1 deaths/1,000 population in 2016 (World Bank, 2018f). Israel has a gross national income per capita (PPP int. $, 2013) of $32,000 (WHO, 2016b) however,
information provided by the country representative states that this is $40,272. The
Summary Vision Screening Data: Israel
[image:9.842.65.726.117.480.2]2
Figure 1: Change in the Total Population and Birth Rate in Israel between 1960 and 2017
Summary Vision Screening Data: Israel
3
4. Vision Screening Commissioning and Guidance
In Israel, vision screening is conducted either regionally or nationally depending on the age group and target condition. All regions provide some type of vision screening, but there are differences between protocols. Funding differs between regions and is provided through charity, health insurance, municipalities and the state.
National vision screening is embedded into a general preventative child healthcare screening system. Decisions on what is provided are made with input from a professional advisory board. In the case of national screening there is also input from public health experts. The vision screening programme is only reviewed when a change is needed; any revisions are decided upon by the Public Health Service within the Israel Ministry of Health, based on discussions and expert opinion. Vision screening was implemented in 1983 and has changed since then; there has been update to the pass/fail criteria.
Nationally organised vision screening consists of:
In first grade there is nationally organised visual acuity screening.
Developmental vision screening is nationally organised and funded by the government as general preventive childcare.
Regionally organised screening consists of:
There are regional initiatives by both non-governmental organisations (NGOs), such as the Lions Club, in collaboration with municipalities, as well as the two large municipalities who run preventive child services to provide vision screening.
National red reflex screening in neonates is performed in all hospitals and paid for by National Insurance Institute; this pays for all birth related hospitalisations.
Tel Aviv and Jerusalem municipalities that run preventive child care clinics have vision screening for amblyogenic risk factors in 2-year-old children. These are funded by the municipalities.
Recently vision screening for amblyogenic risk factors in 2-year-old children that was provided in the Haifa sub-district was discontinued due to a lack of funding; this was originally funded by discretionary governmental funds.
One health fund (Maccabi) provides ophthalmologic examinations for all 1-year-olds covered by their insurance.
Two NGOs run photoscreening programs in 20 municipalities. These are funded through a charity.
Summary Vision Screening Data: Israel
4
Orthoptists, ophthalmologists, paediatricians, nurses, lay screeners and optometrists conduct vision screening. For the red reflex screen in the hospital, it is the paediatrician or paediatric resident who does the first and discharge neonatal exam. Public health nurses conduct behavioural screen in Well Child Clinics. Either public health nurses or optometrists conduct visual acuity screening in schools. In the Lions clubs, lay personnel conduct vision screening. It is not known how many there are per million population. Some nurses, optometrists, paediatricians do not screen but could do so with additional training; this is also true for general practitioners (GP) and family doctors. Currently, there is no specific or accredited course that provides training for vision screening professionals.
Summary Vision Screening Data: Israel
5
5. Screening programme
The target conditions screened for by vision screening include cataract and other opacities at birth, reduced strabismus, visual acuity caused by either amblyopia or refractive error. The health care professionals delivering vision screening, venue for screening and tests used vary depending on the age of the child. Specific details of the screening offered within each age group are described more fully in sections 5.1 to 5.4 below.
5.1 Vision screening - Preterm babies
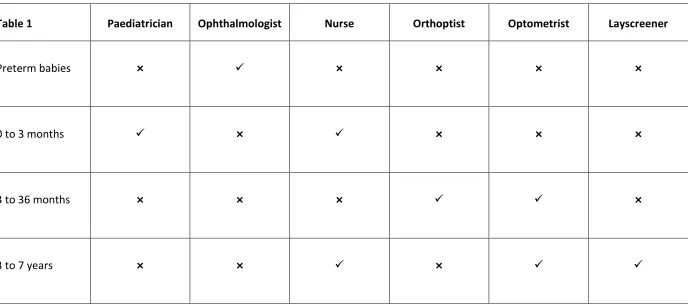
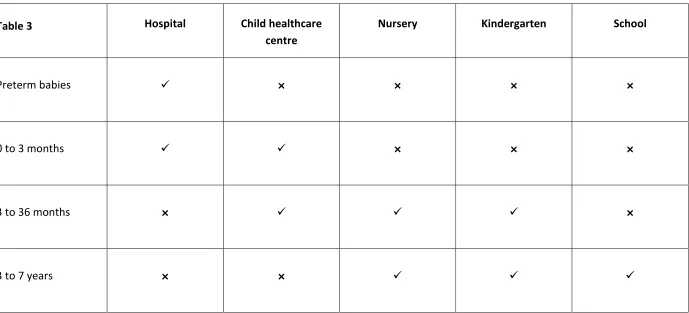
Preterm babies up to the age of 3 months are screened before discharge by an ophthalmologist in a neonatal intensive care unit (NICU) in a hospital. Preterm infants treated in NICU undergo an ROP exam. Criteria are less than 32 gestational weeks or less than 1500 grams birth weight, and they are examined at 6 weeks of age.
5.2 Vision screening - Birth to 3 months
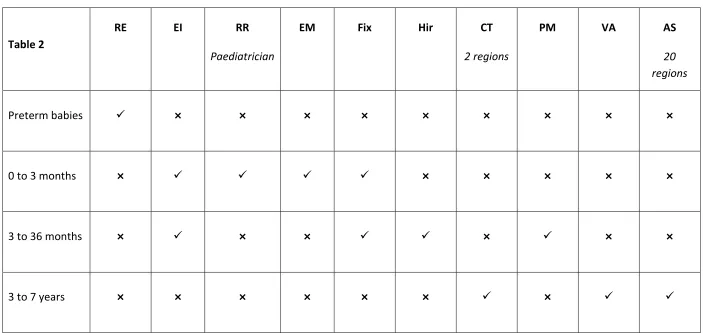
Well, healthy babies up to the age of 3 months are screened by a paediatrician or a nurse in a hospital or a child healthcare centre. The tests conducted at this age include eye inspection, fixation, red reflex testing (paediatrician), eye motility and pursuit movement. Eye inspection and red reflex are conducted at the neonatal exam following birth. A developmental exam is conducted by nurses in well child clinics, this includes: fixation at 1 and 2 months of age, horizontal pursuit movements at 2 months. After one abnormal or one inconclusive test result babies are referred to an ophthalmologist if there is no red reflex or no fixation.
5.3 Vision screening - 3 months to 36 months
Children aged 3 to 36 months are screened by either an orthoptist or an optometrist in a child healthcare centre, nursery or kindergarten. The tests conducted include eye inspection, fixation, Hirschberg test and pursuit movements. After one abnormal or one inconclusive test result children are referred to an ophthalmologist if there is evidence of strabismus, or no following of a moving target.
5.4 Vision screening - 36 months to 7 years
Summary Vision Screening Data: Israel
6
visual acuity include Numbers and Tumbling E at child healthcare centres, and Snellen numbers in schools. These charts are Snellen based, linear format.
Referral criteria at age 3 years are:
VA less than 6/9 or 2-lines difference presence of strabismus
Referral criteria at age 4 years is:
VA less than 6/12.5 or 2-lines difference
Referral criteria at age 6 are:
VA of less than 6/9 or 2-lines difference presence of strabismus
Referral criteria at age 7 years is:
Summary Vision Screening Data: Israel
[image:14.842.82.770.118.423.2]7
[image:14.842.174.772.118.424.2]Table 1: Healthcare professionals who conduct vision screening in each age group
Table 1 Paediatrician Ophthalmologist Nurse Orthoptist Optometrist Layscreener
Preterm babies
×
×
×
×
×
0 to 3 months
×
×
×
×
3 to 36 months
×
×
×
×
Summary Vision Screening Data: Israel
8
[image:15.842.70.773.112.445.2]Table 2: Vision screening tests used in vision screening for each age group
Table 2
RE EI RR
Paediatrician
EM Fix Hir CT
2 regions
PM VA AS
20 regions
Preterm babies
×
×
×
×
×
×
×
×
×
0 to 3 months
×
×
×
×
×
×
3 to 36 months
×
×
×
×
×
×
3 to 7 years
×
×
×
×
×
×
×
Summary Vision Screening Data: Israel
[image:16.842.82.771.116.429.2]9
[image:16.842.102.770.116.430.2]Table 3: Location of vision screening for each age group
Table 3 Hospital Child healthcare centre
Nursery Kindergarten School
Preterm babies
×
×
×
×
0 to 3 months
×
×
×
3 to 36 months
×
×
Summary Vision Screening Data: Israel
10
6. Automated Screening
Automated vision screening is achieved using handheld, portable devices designed to detect presence of refractive error from 6 months of age. It provides objective results and is used to detect amblyopic risk factors. This differs from other methods used to screen children for amblyopia which focus on detection of the actual condition and the resulting visual loss.
PlusOptix is used in Israel, the cost of these devices is approximately $10,000 (approximately 8700 Euros, 19/11/2018). The maintenance costs per year and the number of years before the device is scheduled to be replaced are not known.
A total of 20 municipalities are using automated screening. These are used to test children aged between 3-5 years of age in nursery schools. These are used as stand-alone tests, and are used on all children within these areas. Referral criteria are stated as:
PlusOptix:
o Hypermetropia of 3 Dioptres and above
o Anisometropia of 0.75 Dioptres or above
o Astigmatism of 1.5 Dioptres or above
Summary Vision Screening Data: Israel
11
7. Provision for Visually Impaired
Summary Vision Screening Data: Israel
12
8. Knowledge of existing screening programme
8.1 Prevalence/Diagnosis
There is no data available concerning the prevalence of treated or untreated amblyopia at the age of 7 years. However, a study by Morad et al. (2007) found that at 16 years of age it is 0.98% irrespective of whether or not the individual had been screened or not. This study also found that in a sample of 260,186 Israelis, the prevalence of:
A D ,226 (6.3%)
Strabismus = 2,321 (0.89%)
Strabismus and anisometropia = 442 (0.16%)
B D
B D
B D
Cataract 233 (0.09%) Ptosis 125 (0.05%)
The prevalence of strabismus was similarly reported as 0.6% at age 17 years (Shapira et al., 2016). These results are based on a population of 107,608 young adults born between 1971 and 1994 from a computerised database of the northern recruitment centre of Israel.
8.2 Coverage
All neonates born in a hospital are screened. In the first year of life 95% of infants attend preventative child clinics and receive behavioural visual screening. Approximately 50% of the children invited to the visual screening for toddlers (questionnaires, cover/uncover test, rapid manual retinoscopy) in the cities of Tel Aviv and Jerusalem attend. Public health nurses send invitation letters, appointments can also be self-initiated. In summary coverage rates are:
At birth - Red reflex in hospital: approximately 99%
First year of life - Behavioural vision screen in preventive care clinics: approximately 95%
Age 3 to 5 years - VA screen: reported to be very low, no actual data available. First grade (6 years of age) - Visual acuity screen: 97%
In a 2014 audit of national data from hospital neonatal discharge records, it was found that at discharge after birth:
Summary Vision Screening Data: Israel
13
8.3 Screening evaluation
There is no data available concerning the percentage of false positive, false negative, the positive predictive value (PPV), sensitivity or specificity of screening in Israel. Professional estimates are 1/150 (0.67%) false negatives, 1/150 (0.67%) false positives and 70% PPV for first grade age children.
8.4 Treatment success
Summary Vision Screening Data: Israel
14
9. Costs of vision screening in children
9.1 Cost of vision screening
No data is available cornering the salary per year for each professional for vision screening, the costs to train vision screening professionals, the total screening costs per year for vision screening, or the total costs per child per year for vision screening.
9.2 Cost of treatment for amblyopia
The estimated costs for treatment of typical patients, with refractive amblyopia and strabismic amblyopia including follow-up:
6 clinic visits at 50 Euros each =300 Euros Glasses = 150 Euros
Strabismus surgery = 1000 Euros
9.3 Cost of Treatment for strabismus
The estimated costs for strabismus surgery including follow-up: Surgery = 1000 Euro
6 Visits = 300 Euro
9.4 Cost of treatment for cataract
The estimated costs for congenital cataract surgery including follow-up of deprivation amblyopia:
20 visits = 1000 Euros Glasses = 250 Euros (bifocal) Surgery = 1500 Euro
Summary Vision Screening Data: Israel
15
10. References
Eibschitz-Tsimhoni, M., Friedman, T., Naor, J., Eibschitz, N. and Friedman, Z. (2000). Early screening for amblyogenic risk factors lowers the prevalence and severity of amblyopia. Journal of American Association for Pediatric Ophthalmology and Strabismus, 4(4), pp.194-199.
Morad, Y., Bakshi, E., Levin, A., Binyamini, O., Zadok, D., Avni, I. and Dayan, Y. (2007). Screening and Treating Amblyopia: Are We Making a Difference? Investigative Ophthalmology & Visual Science, 48(5), p.2084.
Ore, L., Tamir, A., Stein, N. and Cohen-Dar, M. (2009). Reliability of Vision Screening Tests for School Children. Journal of Nursing Scholarship, 41(3), pp.250-259.
Shapira, Y., Machluf, Y., Mimouni, M., Chaiter, Y. and Mezer, E. (2017). Amblyopia and strabismus: trends in prevalence and risk factors among young adults in Israel. British Journal of Ophthalmology, 102(5), pp.659-666.
The World Bank (2018a). Population, total | Data. [online] Available at: https://data.worldbank.org/indicator/SP.POP.TOTL?locations=IL [Accessed 14 December 2018].
The World Bank. (2018b). Birth rate, crude (per 1,000 people) | Data. [online] Available at: https://data.worldbank.org/indicator/SP.DYN.CBRT.IN?locations=IL [Accessed 14 December 2018].
The World Bank. (2018c). Population density (people per sq. km of land area) | Data. [online] Available at: https://data.worldbank.org/indicator/EN.POP.DNST?locations=IL [Accessed 14 December 2018].
The World Bank. (2018d). Mortality rate, infant (per 1,000 live births) | Data. [online] Available at: https://data.worldbank.org/indicator/SP.DYN.IMRT.IN?locations=IL [Accessed 14 December 2018].
The World Bank. (2018e). Life expectancy at birth, total (years) | Data. [online] Available at: https://data.worldbank.org/indicator/SP.DYN.LE00.IN?locations=IL [Accessed 14 December 2018].
The World Bank. (2018f). Death rate, crude (per 1,000 people) | Data. [online] Available at: https://data.worldbank.org/indicator/SP.DYN.CDRT.IN?locations=IL [Accessed 14 December 2018].
Summary Vision Screening Data: Israel
16