Int. J. Electrochem. Sci., 7 (2012) 11497 - 11511
International Journal of
ELECTROCHEMICAL
SCIENCE
www.electrochemsci.org
A Chemical Conversion Hydroxyapatite Coating on AZ60
Magnesium Alloy and Its Electrochemical Corrosion Behaviour
Yingchao Su, Guangyu Li* , Jianshe Lian
The Key Lab of Automobile Materials, Ministry of Education, College of Materials Science and Engineering, Jilin University, Nanling Campus, Changchun 130025, China
*E-mail: [email protected]
Received: 17 September 2012 / Accepted: 11 October 2012 / Published: 1 November 2012
In order to improve the biodegradation properties of the magnesium alloy, a bioactive hydroxyapatite (HA) coating was deposited on AZ60 magnesium alloy by a two-step chemical method, i.e., dicalcium phosphate dihydrate (DCPD) coating was formed through a phosphating process, and then transformed to hydroxyapatite coating via alkali-heat treatment. SEM micrographs show that the HA coating is compact with the thickness of about 6μm. Electrochemical tests were used to examine the corrosion performance in NaCl solution and simulated body fluid (SBF) and the results reveal that the HA coating significantly retards the corrosion rate of AZ60 alloy in both solutions.
Keywords: Magnesium alloy; Hydroxyapatite (HA) coating; Electrochemical corrosion.
1. INTRODUCTION
Magnesium and its alloys have attracted considerable attention as potential implant materials in recent years [1-5]. Compared with ceramics, polymeric materials and other metal implants, magnesium alloys exhibit a combination of good mechanical properties, attractive biocompatibilities and biodegradation properties [1, 4, 6]. Thus, magnesium and its alloys could be good candidates as lightweight, degradable and load bearing orthopaedic implants [4, 7].
the biocompatibility and appropriate corrosion resistance for implant materials. In the aspect of biocompatible protective coatings, hydroxyapatite (HA, Ca10(PO4)6(OH)2) is a preferential coating
material, which has similar chemical and structural resemblance to natural bones and can accelerate bone concrescence [13]. There has been some research works about HA coatings on magnesium and its alloys with different methods, including biomimetic techniques [14, 15], chemical deposition [16, 17] and electrodeposition [18-20]. In most studies, pre-treatments in either alkaline solutions like NaOH [14] or acidic solutions of phosphoric acid [15] or HNO3 [16] are required in order to modify
the surface reactivity of the magnesium alloy substrate. Among the various surface treatments, chemical conversion deposition is conveniently and simply operated to produce a uniform and well adhered coating, especially for the complex-shaped components of the orthopaedic implant. A calcium phosphate conversion coating was carried out on the Mg–8.8Li alloy by Song et. al. [21], but the coating was not transformed to the biocompatible HA coating. Additionally, the Mg–Li alloy is not a good potential implant material, but commonly used in aerospace and military applications, and the formation mechanism of conversion film on Mg–Li alloy may be different from that on the conventional magnesium alloys.
So in the present study, we describe a simple two-step chemical method without external electrical circuit or any pre-treatment, to deposit a compact and well adhered HA coating on AZ60 alloy. The deposition mechanism of the coating was analysed; and the corrosion behaviour was investigated by the polarisation measurements in 3.5wt% NaCl solution and simulated body fluid (SBF).
2. EXPERIMENTAL PROCEDURE
Table 1. The composition of AZ60 magnesium alloy (wt. %).
Al Zn Mn Si Cu Ni Fe Mg
5.8~7.2 <1.0 0.15~0.5 ≤0.10 ≤0.05 ≤0.005 ≤0.005 Balance
AZ60 die cast magnesium alloy was used as the substrate material; its composition is given in Table l. The sample size was 12 mm×12 mm×5 mm. The sample surface was polished with up to 2000 grit SiC paper followed by sonication cleanout in acetone. The cleaned samples were immersed into a phosphating solution at 37±2°C for 30 min and were then dried in an attemperator at 60°C. The composition of the phosphating solution is given in Table 2, and its pH was adjusted by adding NaOH to 2.8-3.0. The dried samples were then alkali treated in 1M NaOH solution at 80°C for 2h to form the final coating.
[image:3.596.176.405.546.722.2]
kV and 200 mA with the scanning rate and step being 4°/min and 0.02°, respectively. The morphologies and the composition of the coatings were identified by scanning electron microscopy (SEM, ZEISS EV018, Germany) equipped with energy dispersive ray spectrometer (EDS, X-Max, Oxford Instruments).
Table 2. The composition of the phosphating solution.
Composition Concentration
H3PO4(85% V/V)
CaO Ca(NO3)2•4H2O
Na2MoO4•2H2O
8 mL/L 1.2 g/L 11 g/L 0.5 g/L
The corrosion resistances were evaluated by the electrochemical tests in 3.5wt% NaCl solution (20°C) and SBF (37°C), respectively. SBF is composed of 8.0 g/L NaCl, 0.4 g/L KCl, 0.14 g/L CaCl2,
0.35 g/L NaHCO3, 1.0 g/L C6H6O6 (glucose), 0.2 g/L MgSO4∙H2O, 0.1 g/L KH2PO4∙H2O, 0.06 g/L
Na2HPO4∙H2O and pH=7.4 [6]. Electrochemical tests were performed on an Electrochemical Analyser
(Versa STAT3, Princeton Applied Research) using a classical three electrodes cell with platinum as counter electrode, saturated calomel electrode SCE (+0.242 V vs. SHE) as reference electrode and the samples as working electrode (0.5 cm2 exposed area). The scanning rate was 5 mV/s for all measurements. The data for potentiodynamic polarisation curves were analysed using the CorrView software developed by Scribner Associates, Inc. The surface morphologies of the three kinds of samples after the polarisation measurements were observed with SEM.
3. RESULTS AND DISCUSSION
3.1 Microstructure and phase composition
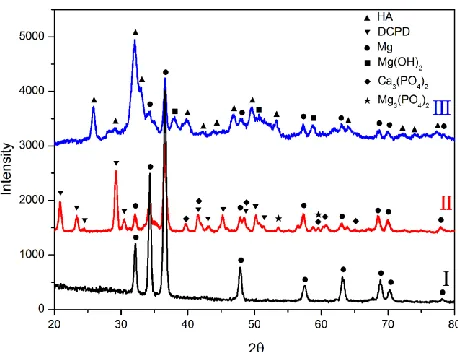
Figure 1. XRD patterns of (Ⅰ) untreated, (Ⅱ) phosphate treated, and (Ⅲ) alkali treated surfaces of
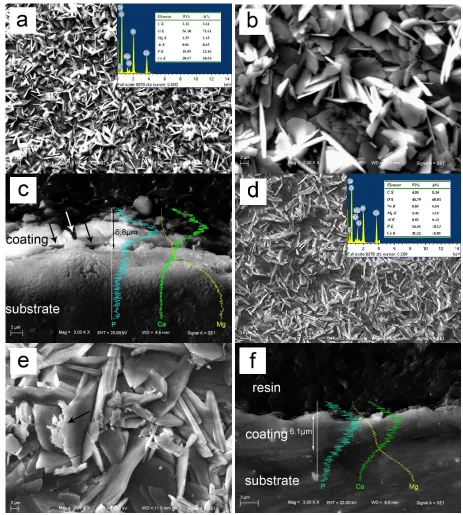
Figure 2. The surface and cross-sectional morphologies of (a-c) phosphate coating and (d-f) HA coating. (Insets) EDS results.
Fig. 1 shows the XRD patterns of the untreated, phosphate treated and alkali treated surfaces of the magnesium alloy. AZ60 magnesium alloy substrate mainly consists of -Mg solid solution, and without corrosion or pre-treatment the β phase was generally less detectable due to its small quantity [22]. After phosphating, the magnesium alloy substrate was covered mainly by dicalcium phosphate dihydrate (CaHPO4∙2H2O, DCPD) and a small quantity of tricalcium phosphate (Ca3(PO4)2) and
[image:4.596.65.528.67.582.2]
treatment, HA became the main phase with a certain quantity of magnesium hydroxide (Mg(OH)2) in
the coating.
The surface and cross-sectional morphologies as well as the EDS results of the phosphate coating and HA coating, are shown in Fig. 2 a, b c and d, e, f, respectively. A flake-like microstructure with flakes of 10-15μm in length appears on the surface of the phosphate coating (Fig. 2a). The line scanning of elements distribution across the coating and the substrate are depicted in Fig. 2c. The layer with significantly high Ca and P contents corresponds to the phosphate coating with an average thickness of about 6μm. The coating is not complete, with some caves or micro-pores between the flakes and beneath the coating surface (marked by arrows in Fig. 2c) being visible in the cross-sectional morphology.
As a precursor to HA, DCPD in the phosphate coating is unstable in environments with pH greater than 6~7 [8], hence the alkali-heat treatment was necessary to transform DCPD to HA, and meanwhile to make some flakes break off or dissolved (marked by an arrow in Fig. 2e), and then micro-pores disappeared (shown in the cross-sectional morphology of Fig. 2f). However, the average coating thickness is about 6μm and didn’t change much after the alkali-heat treatment, as shown in Fig. 2f. This flake-like coating structure should be helpful for the bone tissue to infiltrate into the implants then to accelerate the healing of damaged bone [23]. The EDS results shown as insets in Fig. 2a and 2d indicate that the atomic percentage of Ca/P is 0.845 and 1.667 for the coating before and after the alkali-heat treatment, respectively, which are in agreement with the corresponding stoichiometric proportions of DCPD and HA, respectively.
3.2 Coating deposition process
In the phosphating process, both CaO and Ca(NO3)2∙4H2Owere added in the bath, which is
different from the previous studies [21]. CaO reacted with H3PO4:
CaO +2H3 PO4 →Ca2++2H2PO4−+H2O (1)
to form H2PO4−, which is the major ion at pH<3[24]. The formation of phosphate coating on
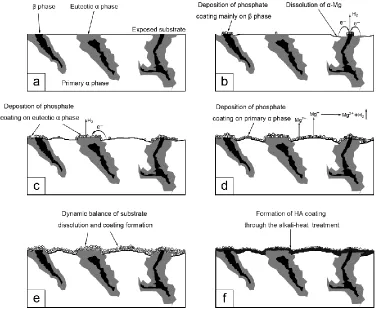
AZ60 alloy is related with the heterogeneity of magnesium alloy substrate. The sketch map of coating deposition is shown in Fig. 3. When the alloy was immersed into the phosphate bath, the substrate surface was divided into micro anodic sites and micro cathodic sites and the reactions on the surface should be thought to take place on different local polarisation sites correspondingly. Therefore, the following reaction can occur at micro anodic sites:
Mg→Mg2+
+2e− (2)
At the micro cathodic sites hydrogen evolution reaction occurred simultaneously:
Figure 3. The sketch map of coating deposition on AZ60 alloy.
The hydrogen generation reaction promoted the concentration of OH− at the interface of metal and solution. Then OH− reacted with H2PO4− to form HPO42−:
H2PO4−+OH−→HPO42−+H2O (4)
In the acidic phosphate bath, most HPO42- preferentially bonded with Ca2+ to form insoluble
CaHPO4 ∙2H2O:
Ca2++HPO42−+2H2O→CaHPO4 ∙2H2O (5)
The reaction product CaHPO4 ∙2H2O deposited on the magnesium alloy substrate to form the
main ingredient of the phosphate coating. Some HPO4− continued to react with OH− to form PO4−,
which would react with Ca2+ from the bulk solution and Mg2+ dissolved from the substrate (micro anodic sites) [21]:
HPO4−+OH−→PO42−+H2O (6)
3Mg2++2PO4−→Mg3(PO4)2 (8)
The content of Mg3(PO4)2 in the phosphate coating was low due to the slow corrosive rate of
AZ60 alloy in the phosphate solution.
Since the electrochemical potentials of α phase (α-Mg) and β phase (Mg17Al12) are different,
and the hydrogen evolution on β phase is easier than that on α phase [25], β phase is regarded as micro cathodic sites primitively. Thus, the coating was mainly deposited on β phase and only a spot of them was deposited on α phase, as shown in Fig. 3b. When β phase was covered by phosphate coating, the hydrogen evolution on β phase became difficult. It is known that α phase consists of magnesium and aluminium. Due to the solute redistribution in the dendritic solidification process and the segregation, aluminium content in primary α-Mg and eutectic α-Mg is different [26, 27]. So, it was electrochemically inhomogeneous at the interior of α phase and micro-anodes and micro-cathodes could be identified. The sites containing more magnesium (e. g., primary α-Mg) were the microanodes and the sites containing more aluminium (e. g., eutectic α-Mg) were the microcathodes. In the case that β phase was probably covered by phosphate coating, the depositing process would continue at the micro cathodic sites of α phase, as shown in Fig. 3c.
Additionally, the hydrogen gas was also generated from micro anode sites accompanying with the dissolution of magnesium at corroding area as proposed by Song [27, 28].
Mg→Mg+
+e− (9)
Mg++H2O→Mg2++OH−+1/2H2 (10)
So the coating continued to deposit at the corroding area following the reactions (4)–(8). Finally, the alloy was totally covered with phosphate coating as shown in Fig. 3d.
But the phosphate coating was still thin and the phosphating solution was easy to penetrate the incompact coating at some weak sites to slowly corrode the substrate, hence the coating grew continuously until the dynamic balance between substrate dissolution and coating formation was established, as shown in Fig. 3e.
In the present study, both Ca(NO3)2∙4H2O and Na2MoO4∙2H2Owere used as accelerators. In the
bath, NO3 −
and MoO4 2−
ions reacted with H+ in the solution-substrate boundary [21, 24,29]:
NO3 −
+2H++2e−→NO2 −
+H2O (11)
MoO42−+8H++3e− →Mo3++4H2O (12)
These reactions also consumed H+ to promote the local pH value, which was beneficial to the formation of phosphate coating. Molybdate could also bond with Mg2+, promoting formation of the coating [29, 30]:
Mg2++MoO4
2−→MgMoO
10CaHPO4 ∙2H2O +12NaOH→Ca10(PO4)6(OH)2+4Na3PO4+12H2O (14)
The minor ingredient of the phosphate coating reacted with the alkali solution as well:
10Ca3(PO4)2+6NaOH→3Ca10(PO4)6(OH)2+2Na3PO4 (15)
Mg3(PO4)2+6NaOH→3Mg(OH)2+2Na3PO4 (16)
In the process of alkali-heat treatment, there was no bubble produced, which was different from the phosphating process. The alkali solution penetrated the incompact phosphate coating to dissolve some flakes and then most caves and micro-pores would be filled with the reaction products. Therefore, the coating became more compact and better adhered onto the substrate, as shown in Fig. 3f.
[image:8.596.76.526.396.571.2]3.3 Measured polarisation behaviour
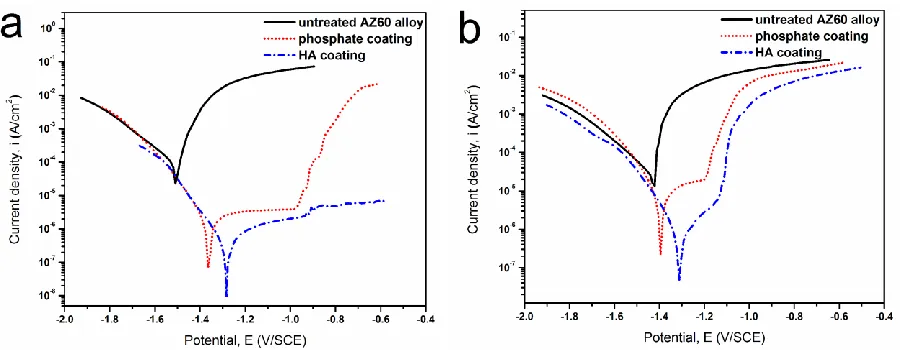
Figure 4. Potentiodynamic polarisation curves in (a) 3.5wt% NaCl solution and (b) SBF, respectively.
Fig. 4(a) and (b) show the potentiodynamic polarisation curves of the untreated AZ60 alloy, phosphate coating and HA coating in 3.5wt% NaCl solution (20°C) and SBF (37°C), respectively. The corrosion current density (Icorr), and the anodic and cathodic Tafel slope (βa and βc, respectively) are
simultaneously derived by curve fitting method using Corrview software based on the Butler and Volmer equation [31]:
corr corr corr
a c
2.303 2.303
exp exp
I I E E E E
where Ecorr is the corrosion potential. The polarisation resistance (Rp) can be evaluated from the
Stern and Geary relationship [32]:
a c p
corr a c 2.303
R
I
[image:9.596.51.547.180.433.2] (18)
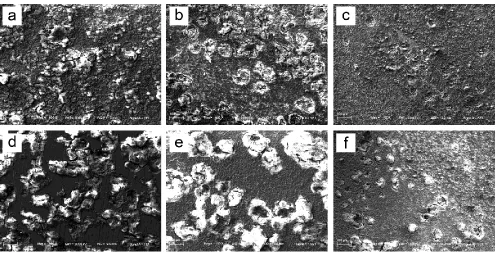
Figure 5. The surface morphologies of (a, d) untreated AZ60 alloy, (b, e) phosphate coating and (c, f) HA coating after the potentiodynamic polarisation measurements in (a-c) 3.5wt% NaCl solution and (d-f) SBF, respectively.
The pitting potential Ept is equal to the inflexion potential on polarisation curves. When the
polarisation potential exceeds Ept, the corresponding current density has an abrupt drop in the cathodic
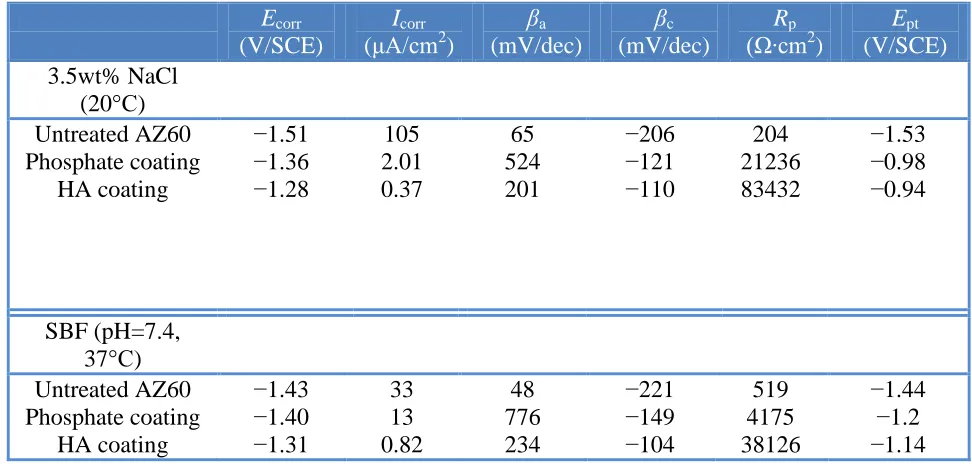
branch or an abrupt increase in the anodic branch, which indicates the breakdown of the surface coating and the initiation of pitting corrosion. The values of all the electrochemical parameters obtained from the polarisation curves are listed in Table 3. The surface SEM morphologies of the samples after the potentiodynamic polarisation measurements are shown in Fig. 5. For the untreated alloy immersed in either NaCl or SBF solution, numerous bubbles were formed at the sample surface during the recording of the polarisation curve. The cathodic Tafel slope βc is –206 mV/dec in NaCl
with those obtained in the previous studies where the value varies from 30 mv/dec to 320 mv/dec [33, 35, 36].The untreated alloy was attacked and dissolved, and the attack morphology changed from pitting corrosion to overall corrosion with the increase of applied potential without passivation. The surface was totally covered with big cracks, concave pits and the corrosion products (Fig.5 (a) and (d)), implying that severe corrosion occurred on the surface and corrosion products in pits were detached away into solution. This anodic behaviour at high potentials is partially controlled by mass transport, in agreement with previous studies [33-36].
Table 3. (i) Corrosion potential (Ecorr), (ii) corrosion current density (Icorr), (iii) anodic and cathodic
Tafel slope (βa and βc), (iv) polarisation resistance (Rp), and (v) pitting potential (Ept), derived
from the polarisation curves (Fig. 4). Ecorr
(V/SCE)
Icorr (μA/cm2)
βa (mV/dec) βc (mV/dec) Rp (Ω∙cm2 ) Ept (V/SCE) 3.5wt% NaCl (20°C) Untreated AZ60 Phosphate coating HA coating −1.51 −1.36 −1.28 105 2.01 0.37 65 524 201 −206 −121 −110 204 21236 83432 −1.53 −0.98 −0.94 SBF (pH=7.4, 37°C) Untreated AZ60 Phosphate coating HA coating −1.43 −1.40 −1.31 33 13 0.82 48 776 234 −221 −149 −104 519 4175 38126 −1.44 −1.2 −1.14
For the phosphate coating, the corrosion potential Ecorr shows a significant shift to the positive
direction, the polarisation current density Icorr decreases largely, and the polarisation resistance Rp
increases significantly, compared with the untreated samples. Bubbles formation was reduced at the sample surface during the recording of the polarisation curve. An obvious passivation occurred in the anodic branch. The passivation range reached to 300 mV in NaCl solution and 120mV in SBF, respectively. Below the pitting potential the anodic plot has a very high slope, and then the anodic Tafel slope decreases abruptly, probably revealing the pitting of the substrate in parallel with the Mg oxidation. The corroded surface morphologies (Fig. 5(b) and (e)) show the characteristics of pitting corrosion, but only when the applied anodic potential exceeds the pitting potential Ept to break the
passive coating, did pitting corrosion occur.
For the HA coating, more evident protective effects are observed: the corrosion potentials Ecorr
[image:10.596.54.540.295.527.2]
as much as two decades lower, the polarisation resistance Rp is about two decades higher, and the
pitting potentials Ept show significant shifts of about 600mV in the NaCl solution and 300 mV in SBF,
respectively, compared with the values of the untreated alloy. The cathodic Tafel slope βc increases to
about –100 mV/dec, resulting in few bubbles formation at the sample surface during the polarisation measurements. Although the anodic Tafel slope βa is lower than that of the phosphate coating, the
increased values of pitting potential Ept indicate the HA coating can provide protection for the
[image:11.596.60.543.307.487.2]magnesium alloy in a large potential range, which was confirmed by corrosion morphologies in Fig. 5c and f. Only a few pits were observed with increasing anodic potential, especially in the NaCl solution (Fig. 5c). So the alkali-heat treatment for the phosphate coating leads to the formation of a well protective HA coating.
Table 4. The electrochemical parameters values of several HA coatings in the present study and Ref.
[16-19].
Coating /Substrate Corrosive mediums Ecorr (V/SCE)
Icorr (μA/cm2
)
HA on AZ60 [present] HA on AZ60 [present]
3.5wt% NaCl SBF −1.28 −1.31 0.37 0.82
HA on Mg [16] HA on Mg [17] HA on Mg-Zn-Ca [18]
HA on AZ91D[19]
3.5wt% NaCl MEM SBF SBF −1.65 −1.54 −1.41 −1.5 0.28 2.7 25 30
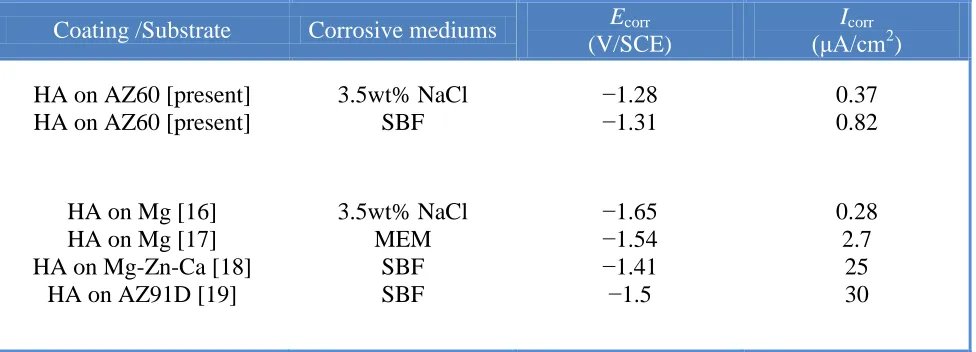
Different approaches have been explored to generate the HA coating on the magnesium alloys as well as pure magnesium in the previous studies [14-19]. The electrochemical parameters values of several HA coatings are summarized and compared with that of present study in Table 4. In spite of the different coating substrates, the corrosion potential Ecorr is in the −1.4 to –1.65 V/SCE range and the
corrosion current density Icorr varies from 0.28 to 30μA/cm2 in the previous studies [16-19]. By
comparison, the corrosion potential (Ecorr ) of the present study is the most positive one in both
solutions and the corrosion current densities (Icorr) are in the better range of less than 1μA/cm2. Thus it
can be confirmed that the present compact coating exhibits the better electrochemical corrosion resistance to protect the substrate in both NaCl and SBF solutions.
3.4 Theoretical polarisation behaviour
[image:11.596.57.545.310.486.2]combination of the theoretically decomposed anodic and cathodic polarisation currents:
a c
I I I (19)
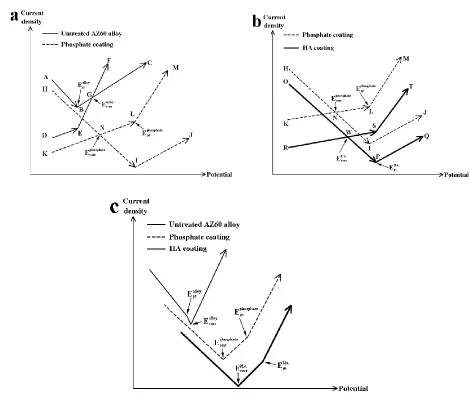
For the untreated alloy (Fig. 6a), the surface is not corroded at first, so the hydrogen evolution and magnesium dissolution processes proceed in normal electrode behaviour. The magnesium dissolution increases (D–E) and the hydrogen evolution decreases (A–B) with the increasing polarisation potential [37].
[image:12.596.56.526.271.668.2]
As a result, the composed polarisation current decreases as polarisation potential becomes more positive before Eptalloy according to Eq. (19). A film containing mainly Mg(OH)2 and MgO could
formed soon after the immersion in the corrosive medium due to the low rate of the magnesium dissolution processes [38]. This thin film breaks down at a potential more negative than the corrosion potential. This normal phenomenon for Mg alloys indicates that the hydroxide/oxide layer is not a real passive film. When the polarisation potential is higher than Eptalloy, pitting corrosion occurs, which can be characterised by the dramatic increase of the rates of magnesium dissolution (E–F) and hydrogen evolution (B–C). The increasing rate of hydrogen evolution with potential is an important feature of the negative difference effect, which is always accompanied by dramatic dissolution of magnesium [39]. Thus, on the corroding surface both Ia and Ic increase with the increase of applied potential,
resulting in suddenly decreasing I at a faster rate (Fig. 6c). This explains the abrupt drop in the cathodic polarisation curves of the untreated alloy in Fig. 4. The intersecting point G between the curves A–B and D–E represents the corrosion potential Ecorralloy. It should be noted that A–B and D–E actually represent hydrogen evolution and magnesium dissolution from the uncorroded surface, while B–C and E–F mainly represent hydrogen evolution and magnesium dissolution from the corroding area of the sample [37].
For the phosphate coating (Fig. 6a), only a relatively small area of the substrate can be attacked by corrosive medium due to the barrier function of the coating. So, the rates of the magnesium dissolution (K–L) and the hydrogen evolution (H–I) in the uncorroded area should be lower than that of the untreated AZ60 alloy. The stable corrosion resistant of the coating leads to a more positive pitting corrosion potential Eptphosphate (point L or I), which is even more positive than its corrosion potential Ecorrphosphate (the intersecting point N). While the polarisation potential is higher than Eptphosphate (point L or I), the rates of the magnesium dissolution (L–M) and the hydrogen evolution (I–J) in the corroding area increase dramatically. However, both the rates are lower than that of the untreated alloy due to the smaller corroding area. Both Ia and Ic increase with potential on the corroding surface,
resulting in suddenly increasing I at a faster rate (Fig. 6c). This explains the abrupt increase in the anodic polarisation curves of the phosphate coating in Fig. 4.
For the HA coating (Fig. 6b), the relative positions of O–P, P–Q, R–S and S–T are slightly different from those of the phosphate coating. Micro-pores and gaps between flakes of the phosphate coating were buried after the alkali-heat treatment (Fig.2(c) and (f)). Compared with the phosphate coating, the more compact and better adhered HA coating makes less area of the substrate exposed to corrosive medium, which leads to the lower rates of the hydrogen evolution (H–I–J) and the magnesium dissolution (K–L–M) in the uncorroded area and the corroding area. As a result, the corrosion potential EcorrHA (point W) and the pitting corrosion potential EptHA(point S or P) are positive to these of the the phosphate coating, respectively.
4. CONCLUSIONS
1) The compact and well adhered HA coating of about 6μm thick was deposited on the surface of AZ60 alloy by a two-step chemical method without external electrical circuit or any pre-treatment. The phosphate coating mainly consisted of DCPD was transformed into HA coating after the alkali-heat treatment.
2) The coating can serve as a physical barrier between the substrate and the aggressive environment, resulting in the low rates of magnesium dissolution and hydrogen evolution at different polarisation potential.
3) The present coating exhibits a better electrochemical corrosion resistance in comparison with the previous HA coatings.
4) The corrosion morphology observation after the potentiodynamic polarisation measurements also indicates that the HA coating can efficiently protect magnesium substrate from corrosion attack.
ACKNOWLEDGEMENTS
This work was supported by National Nature Science Foundation (Grant No. 31070841), the Foundation of National Key Basic Research and Development Program (No.2010CB631001).
References
1. Y. Xin, T. Hu, P.K. Chu, Acta Biomater. 7 (2011) 1452. 2. M.B. Kannan, R.K. Raman, Biomaterials, 29 (2008) 2306.
3. Y. Li, C. Wen, D. Mushahary, R. Sravanthi, N. Harishankar, G. Pande, P. Hodgson, Acta Biomater. 8 (2012) 3177.
4. M.P. Staiger, A.M. Pietak, J. Huadmai, G. Dias, Biomaterials, 27 (2006) 1728. 5. S. Shadanbaz, G.J. Dias, Acta Biomater. 8 (2012) 20.
6. G. L. Song, Corros. Sci. 49 (2007) 1696.
7. C.E. Wen, M. Mabuchi, Y. Yamada, K. Shimojima, Y. Chino, T. Asahina, Scripta. Mater. 45 (2001) 1147.
8. G.J. Levinskas, W.F. Neuman, J. Phys. Chem. 59 (1955) 164. 9. W.S. Pietrzak, Tissue Eng. 6 (2000) 425.
10.T. Lei, C. Ouyang, W. Tang, L.F. Li, L.S. Zhou, Corros. Sci. 52 (2010) 3504.
11.M.A. Gonzalez-Nunez, C.A. Nunez-Lopez, P. Skeldon, G.E. Thompson, H. Karimzadeh, P. Lyon, T.E. Wilks, Corros. Sci. 37 (1995) 1763.
12.W.F. Ng, M.H. Wong, F.T. Cheng, Surf. Coat. Tech. 204 (2010) 1823. 13.K.J.L. Burg, S. Porter, J.F. Kellam, Biomaterials, 21 (2000) 2347. 14.J.E. Gray Munro, M. Strong, J. Biomed. Mater. Res. A. 90 (2009) 339.
15.J.E. Gray-Munro, C. Seguin, M. Strong, J. Biomed. Mater. Res. A. 91 (2009) 221. 16.M. Tomozawa, S. Hiromoto, Acta Mater. 59 (2011) 355.
17.X.B. Chen, N. Birbilis, T.B. Abbott, Corros. Sci. 53 (2011) 2263.
19.Y.W. Song, D.Y. Shan, E.H. Han, Mater. Lett. 62 (2008) 3276.
20.M. Jamesh, S. Kumar, T. Sankara Narayanan, J. Coat. Technol. Res. 9(2012) 495. 21.Y. Song, D. Shan, R. Chen, F. Zhang, E.H. Han, Corros. Sci. 51 (2009) 62.
22.C.D. Gu, J.S. Lian, G.Y. Li, L.Y. Niu, Z.H. Jiang, J. Alloys Compd. 391 (2005) 104. 23.J. Park, Y. Lee, K. Kim, K. Kim, Surf. Coat. Tech. 195 (2005) 252.
24.L. Kouisni, M. Azzi, M. Zertoubi, F. Dalard, S. Maximovitch, Surf. Coat. Tech. 185 (2004) 58. 25.G. Song, A. Atrens, X. Wu, B. Zhang, Corros. Sci. 40 (1998) 1769.
26.G. Song, A. Atrens, M. Dargusch, Corros. Sci. 41 (1999) 249. 27.G. L. Song, A. Atrens, Adv. Eng. Mater. 1 (1999) 11.
28.G. Song, A. Atrens, D.S. John, X. Wu, J. Nairn, Corros. Sci. 39 (1997) 1981. 29.K.C. Emregül, A.A. Aksüt, Corros. Sci. 45 (2003) 2415.
30.X. Yu, J. Wang, M. Zhang, L. Yang, J. Li, P. Yang, D. Cao, Surf. Coat. Tech. 203 (2008) 250. 31.J.A.V. Butler, Trans. Faraday Soc. 19 (1924) 729.
32.M. Stern, A.L. Geary, J. Electrochem. Soc. 104 (1957) 56.
33.F.E. Heakal, A.M. Fekry, M.Z. Fatayerji, J. Appl. Electrochem. 39 (2009) 583. 34.G. Baril, N. Pébère, Corros. Sci. 43 (2001) 471.
35.H. Duan, K. Du, C. Yan and F. Wang, Electrochim. Acta. 51 (2006) 2898. 36.N. Pebere, C. Riera and F. Dabosi, Electrochim. Acta. 35 (1990) 555. 37.G. Song, D. StJohn, J. Light Met. 2 (2002) 1.
38.M. Santamaria, F. Di Quarto, S. Zanna, P. Marcus, Electrochim. Acta. 53 (2007) 1314. 39.G. Song, A. Atrens, D. Stjohn, J. Nairn, Y. Li, Corros. Sci. 39 (1997) 855.