Int. J. Electrochem. Sci., 10 (2015) 2812 - 2824
International Journal of
ELECTROCHEMICAL
SCIENCE
www.electrochemsci.org
The Study of a Phosphate Conversion Coating on Magnesium
Alloy AZ91D: I. Formation, Morphology and Composition
Yong Zhou, Qing yun Xiong, Jin ping Xiong*
Beijing Key Laboratory of Electrochemical Process and Technology for Materials, Beijing University of Chemical Technology, Beijing 100029, China
Key Laboratory of Carbon Fiber and Functional Polymer of Education Ministry, Beijing University of Chemical Technology, Beijing 100029, China
*
E-mail: [email protected]
Received: 18 December 2014 / Accepted: 3 February 2015 / Published: 24 February 2015
This paper involved a phosphate conversion coating on magnesium alloy AZ91D. The formation of the phosphate conversion coating was studied with potential-time curve and electrochemical impedance spectroscopy (EIS), and the morphology and composition of the phosphate conversion coating were analyzed with scanning electron microscope (SEM), X-ray diffraction (XRD) and X-ray photoelectron spectroscopy (XPS). The results showed that the growth process of the phosphate conversion coating could be divided into three steps. In the first step (0-40 s) the potential fluctuated sharply due to the alternate presence and absence of the metastable crystal nucleuses and the formation of the stable crystal nucleuses composed of the elements of Zn, P and O. In the second step (40-200 s) the potential moved to the negative direction because of the electrochemical inhomogeneity attributed to the growth of the stable crystal nucleuses until the magnesium alloy surface was covered by the slab-like phosphate crystals completely. In the finally step (200-1200 s) the potential move to the positive direction slowly until it leveled off because the thickness of the phosphate conversion coating increased gradually from the slab-like phosphate crystals initially. The magnesium alloy substrate was isolated from the acidic and corrosive phosphating bath by the phosphate conversion coating, which was formed completely at 1200s. The phosphate conversion coating showed a uniform, compact and integral crystal clusters and was composed of Zn3(PO4)2, Zn2Mg(PO4)2 and Zn.
Keywords: magnesium alloy AZ91D; phosphate conversion coating; SEM; EIS; XRD; XPS
1. INTRODUCTION
magnesium alloys substrate [2], resulting that the corrosion susceptibility of magnesium alloys is higher than that of other alloys, which limits the wide application of magnesium alloys [3]. Phosphate conversion coatings are one of the common surface protective methods to strengthen the corrosion resistance of magnesium alloys, which have some advantages such as easy operation, low cost and little size limitation [4].
At present, phosphate conversion coatings on magnesium alloys have been studied widely, which mainly focus on the preparation and protection of phosphate conversion coatings. Lian et al. [5] prepared a zinc phosphate conversion coating on magnesium alloy AZ91D in a phosphating bath containing H3PO4, ZnO and NaF mainly. The zinc phosphate conversion coating had typical phosphate microstructure, and the composition analyzed by XRD were Zn3(PO4)2·4H2O, Zn, AlPO4 and Zn2Mg(PO4)2. SEM had shown that very fine zinc particles surrounded phosphate crystals and filled in the interstice of the insoluble phosphate. Liu et al. [6] prepared a new molybdate-phosphate conversion coating on magnesium alloy AM60. The molybdate-phosphate coating contained composite phases, which were consisted of metaphosphate as well as molybdate oxide with an “alveolate-crystallized” structure. The composite coating had better corrosion resistance performance than molybdate coating, and even had almost comparable corrosion protection for the magnesium alloy to the traditional chromate-based coating. Zeng et al. [7] prepared a zinc phosphate conversion coating and a zinc-calcium phosphate conversion coating on magnesium alloy AZ31D. The flowerlike zinc-zinc-calcium coating was mainly composed of Zn3(PO4)2·4H2O. They had a quite different morphology from the dry-revered-like zinc coating that consisted of MgO, MgF2, Zn and Zn3(PO4)2·4H2O. Both of the zinc and zinc-calcium coating could remarkably reduce the corrosion current density of the magnesium alloy substrate. The zinc-calcium coating showed better corrosion resistance than the zinc coating.
However, the studies involving the formation of phosphate conversion coatings on magnesium alloys are relatively less [8,9]. In this paper, the formation of a phosphate conversion coating on magnesium alloy AZ91D was studied with potential-time curve, scanning electron microscope (SEM) and electrochemical impedance spectroscopy (EIS), and the composition of the phosphate conversion coating was analyzed with X-ray diffraction (XRD) and X-ray photoelectron spectroscopy (XPS).
2. EXPERIMENTAL 2.1 Material and preparation
2.2 Preparation of the phosphate conversion coating on the magnesium alloy sample
The phosphate conversion coating was formed on the sample surface at 45 ℃ by immersing the sample into the phosphating bath with the composition as follows: ZnO, 2.0 g/L; H3PO4, 12.0 g/L; NaF, 1.0 g/L; C4H6O6Na2, 4.0 g/L; NaNO3, 6.0 g/L; Na4P2O7, 0.5 g/L.
2.3 Electrochemical measuremnts
The potential-time curve was carried out using a CS350 electrochemical workstation (China) in the phosphating bath, and the potential recording frequency was 5 Hz. In this test, the working electrode was a magnesium alloy sample with 1.0 cm2 exposed to the phosphating bath, and the reference electrode was a saturated calomel electrode (SCE). EIS plots were performed using a Princeton 2273 instrument (USA). During the EIS test, a perturbation potential of 10 mV amplitude was applied with the frequency range from 105 to 10-2 Hz. A typical three electrode system was used for the EIS test. The system was composed of a saturated calomel electrode (SCE) as reference electrode, a platinum sheet as counter electrode, and the magnesium alloy sample with 1.0 cm2 as working electrode exposed to 3.5 % (wt%) NaCl solution. The test temperatures of the potential-time curve and the EIS plots were 45 ℃ and 25 ℃, respectively.
2.4 Scanning electron microscope (SEM) observation
The surface morphology of the magnesium alloy samples was observed with a LEO-1450 SEM (USA).
2.5 X-ray diffraction (XRD) and X-ray photoelectron spectroscopy (XPS) analysis
The surface composition of the magnesium alloy samples was analyzed with a 2500VB2+PC XRD (Japan) and an ESCALAB-250 XPS (USA).
3. RESULTS AND DISCISSION 3.1 Potential-time curve test
0 200 400 600 800 1000 1200 1400 1600 1800 2000 -0.61
-0.60 -0.59 -0.58 -0.57 -0.56 -0.55 -0.54
0 5 10 15 20 25 30 35 40 45 50 -0.610
-0.605 -0.600 -0.595 -0.590 -0.585 -0.580
time (s)
E
(
VS
C
E
)
3
time (s)
E
(
VS
C
E
)
1
2
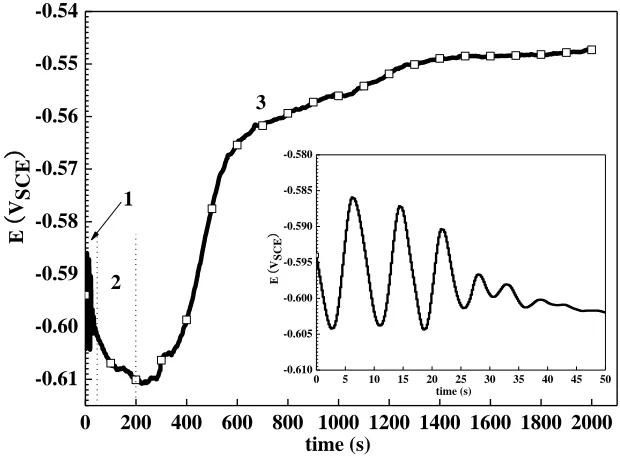
Figure 1. Potential-time curve of magnesium alloy AZ91D immersed in the phosphating bath at 45 ℃.
3.2 SEM observations
(a) (b)
[image:4.596.140.450.90.319.2]
(e) (f)
(g) (h)
(i) (j)
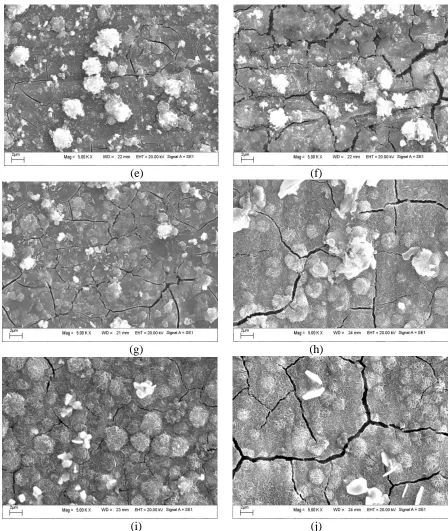
Figure 2. Surface SEM morphologies of the magnesium alloy sample immersed in the phosphating bath with different time: (a) 0 s, (b) 10 s, (c) 30 s, (d) 40 s, (e) 100 s, (f) 200 s, (g) 5 min, (h) 10 min, (i) 20 min and (j) 30 min.
[image:5.596.72.520.66.597.2]
composed of MgO and Mg(OH)2, and the EDS result is consistent with Song et al.’s studies. Fig. 2b shows the surface SEM morphology of the sample immersed in the phosphating bath for 10 s. Many “white flowers” structures can be observed, and EDS analysis revealed that the elements of Zn, P and O were present in the “white flowers” structure marked by red circle in Fig. 2b, indicating that “white flowers” structures may be the metastable crystal nucleuses of Zn3(PO4)2. From Fig. 2b, many small metastable crystal nucleuses form uniformly on the sample surface, which has an average size of 1-2 µm. There are about 2.0×10⁴
crystal nucleuses calculated per square centimeter. Such a great number of metastable crystal nucleuses distributed equably on the sample surface indicates that the formation of the phosphate conversion coating should occur uniformly on each phases of magnesium alloy AZ91D. Fig. 2c and 2d show the surface SEM morphologies of the sample immersed in the phosphating bath for 30 s and 40 s. From 10 s to 40 s the quantity of crystal nucleuses decrease, but the bulk of crystal nucleuses increase. During this period (10-40 s) only a small amount of metastable crystal nucleuses grow up or join together to form some bigger “white flowers” structure with the size about 3-5 µm, and EDS analysis revealed that the relative atom ratios of Zn, P and O were approximately 3∶2∶8, indicating the stable crystal nucleuses of Zn3(PO4)2. However, a majority of metastable crystal nucleuses cannot grow and disappear at last. The alternate presence and absence of the metastable crystal nucleuses on the sample surface caused the potential fluctuated in the period of 0-40 s, as showed in the embedded figure in Fig. 1. Fig. 2e and 2f show the surface SEM morphologies of the sample immersed in the phosphating bath for 100 s and 200 s. The stable crystal nucleuses grow gradually, and the slab-like phosphate crystals with cracks and porous can be observed on the sample surface when the immersion time is 200 s. The electrochemical homogeneity of the magnesium alloy surface was damaged during the growth process from stable crystal nucleuses to slab-like phosphate crystals, which leaded to the negative movement of potential. Fig. 2g shows the surface SEM morphology of the sample immersed in the phosphating bath for 5 min. The sample surface was fully covered by the phosphate conversion coating, but there are some cracks observed as the result of the hydrogen evolution reaction. With the increase of immersion time, from Fig. 2h and 2i the width of cracks decreases gradually with the immersion time in the range from 10 min to 20 min. Fig. 2i shows the surface SEM morphology of the sample immersed in the phosphating bath for 20 min. The width of cracks is least, and the phosphate conversion coating shows a uniform, compact and integral crystal clusters structure. However, the surface SEM morphology of the phosphate conversion coating with the immersion time of 30 min is similar to that with the immersion time of 10 min, as showed in Fig. 2j. The reason may be as follows: the phosphate conversion coating has been formed completely when the immersion time is 20 min, after that, the coating was dissolved partly in the acidic and corrosive phosphating bath. The thickness of the phosphate conversion coating increased gradually from the slab-like phosphate crystals initially until the phosphate conversion coating formed completely, which lead to the positive movement of potential.
3.3 EIS plots
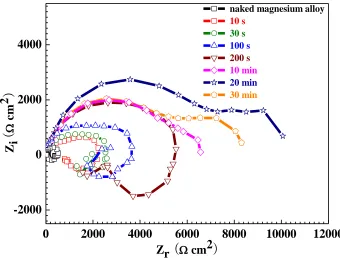
alloy and the phosphated magnesium alloys with the immersion time of 10 s, 30 s, 100 s and 200 s are composed of a capacitive loop at high frequency and an inductive loop at low frequency.
0 2000 4000 6000 8000 10000 12000
-2000 0 2000 4000
naked magnesium alloy 10 s
30 s
100 s
200 s
10 min
20 min
30 min
Z i
(
c
m
2
)
Zr
(
cm2)
0
Figure 3. Nyquist plots of the naked magnesium alloy and the phosphated magnesium alloys immersed in the phosphating bath with different time.
[image:7.596.129.469.139.397.2]
bath consistent with the SEM results showed in Fig. 2i and 2j. Further, inductive loops can be observed with immersion time of 10 s, 30 s, 100 s and 200 s, which is attributed the occurrence of pitting corrosion induced by chloride anions in NaCl solution because the magnesium alloy surface cannot be covered by the phosphate conversion coating completely at this time. The similar result was reported by Cheng et al. [16] that there would be an inductive loop in the low frequency region of EIS.
However, the radius of capacitive loops of the phosphated magnesium alloys is larger than that of the naked magnesium alloy, indicating that the phosphate conversion coating provided a degree of protection for the magnesium alloy substrate.
From the above results, the formation of the phosphate conversion coating can be divided three steps: 0-40 s, 40-200 s and 200 s-20 min. The electrode potential, SEM morphology and impedance are closely related with the immersion time, and the phosphate conversion coating shows compact and integral structure and provides good protection for the magnesium alloy substrate when the immersion time is 20 min.
3.4 XRD analysis
10 20 30 40 50 60
A
C A
2
C
o
u
n
t
(a
.u
.)
A Zn3(PO4)2
B Zn2Mg(PO4)2
C Zn
A
B
A
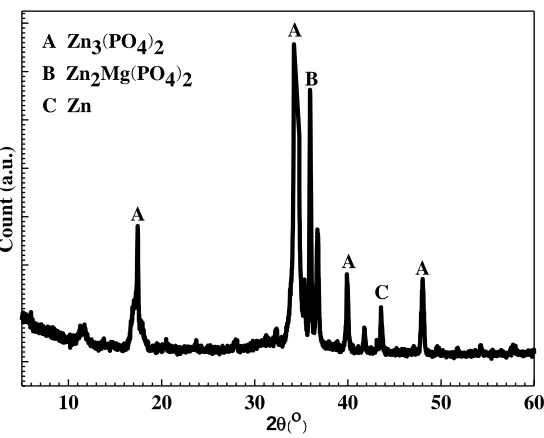
Figure 4. XRD spectrum of the phosphate conversion coating formed in the phosphating bath at 45 ℃ for 20 min.
[image:8.596.160.432.375.594.2]
3.5 XPS analysis
1000 800 600 400 200 0
F e 2 s P 2 p
Binding Engergy (eV)
C o u n t (a .u .) O 1 s P 2 s C 1 s M g 2 p A l 2 p Z n 2 p M g 1 s O L M M F e 2 p
Figure 5. Wide-scan XPS spectrum of the phosphate conversion coating formed in the phosphating bath at 45 ℃ for 20 min.
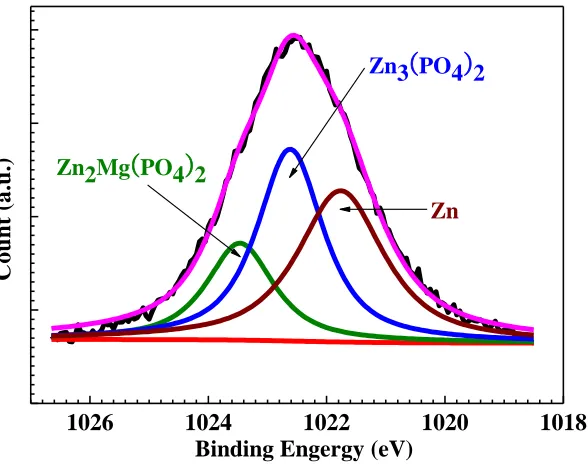
1026 1024 1022 1020 1018
Zn2Mg(PO4)2
C o u n t (a .u .)
Binding Engergy (eV) Zn
Zn3(PO4)2
[image:9.596.144.442.136.377.2] [image:9.596.152.446.465.698.2]
Fig. 5 shows the wide-scan XPS spectrum of the phosphate conversion coating formed in the phosphating bath at 45 ℃ for 20 min. The XPS results provide evidence for the presence of Mg, Zn, Fe, O, C, P and Al, consistent with the EDS result. Fig. 6 shows the high-resolution XPS spectrum of Zn 2p of the phosphate conversion coating. The Zn 2p spectrum reveals three peaks at 1023.50 eV, 1022.60 eV and 1021.75 eV, which correspond to Zn element in Zn2Mg(PO4)2, Zn3(PO4)2 and Zn, respectively.
138 136 134 132 130
Zn2Mg
(
PO4)
2Zn3
(
PO4)
2C
o
u
n
t
(a
.u
.)
Binding Engergy (eV)
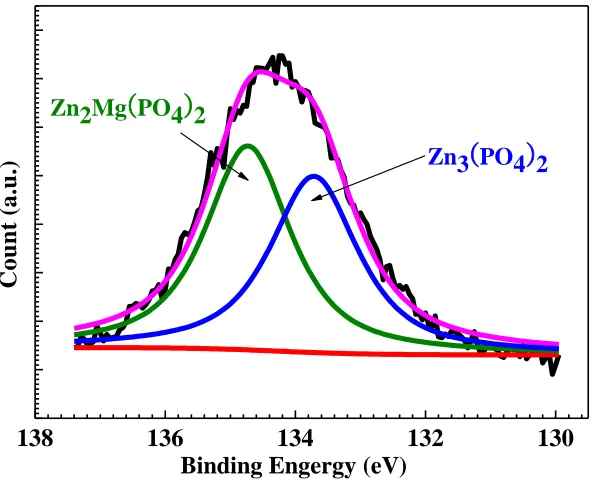
Figure 7. High-resolution XPS spectrum of P 2p of the phosphate conversion coating formed in the phosphating bath at 45 ℃ for 20 min.
Fig. 7 shows the high-resolution XPS spectrum of P 2p of the phosphate conversion coating. The P 2p spectrum reveals two peaks at 134.75 eV and 133.70 eV, corresponding to P element in Zn2Mg(PO4)2 and Zn3(PO4)2, respectively. Fig. 8 shows the high-resolution XPS spectrum of O 1s of the phosphate conversion coating. The O 1s spectrum reveals three peaks at 532.90 eV, 531.95 eV and 531.00 eV, corresponding to O element in Zn2Mg(PO4)2, Zn3(PO4)2 and H2O, respectively. Zn2Mg(PO4)2 and Zn3(PO4)2 is the main component of the phosphate conversion coatings on magnesium alloy AZ91D, which is consistent with the studies from Li et al. [17] and Niu et al. [18].
The above XPS results are consistent with the XRD results showed in Fig. 4, indicating that the phosphate conversion coating is composed of Zn3(PO4)2, Zn2Mg(PO4)2 and Zn. The formation of the phosphate conversion coating on magnesium alloy AZ91D may be as follows. When the magnesium alloy sample was immersed in the acidic phosphating bath, the reaction (1) occurred in the magnesium alloy surface, resulting that the value of pH increased and the concentration of H+ decreased near the magnesium alloy surface:
2 2
2H Mg H
[image:10.596.144.441.210.451.2]
538 536 534 532 530 528 526
Zn2Mg
(
PO4)
2Zn3
(
PO4)
2C o u n t (a .u .)
Binding Engergy (eV)
H2O
Figure 8. High-resolution XPS spectrum of O 1s of the phosphate conversion coating formed in the phosphating bath at 45 ℃ for 20 min.
The increase of pH value and the decrease of H+ concentration caused the equilibrium of reaction (2), (3) and (4) to move the right direction:
H PO
H OZn O
H PO H
ZnO2 3 4 2 2 4 22 2 (2)
H PO
H O ZnPO H PO H H OZn 2 4 22 2 4 2 4 2 2 2
(3)
3
4 2
4 Zn PO
ZnPO (4)
Therefore, Zn2+, H2PO4- and PO43- were enriched and reached supersaturation near the magnesium alloy surface. However, when the concentrations of Zn2+, H2PO4- and PO43- were higher than the solubility products of Zn3(PO4)2 and Zn2Mg(PO4)2, the following reaction (5), (6), (7) and (8) could occur and the phosphate conversion coating formed on the magnesium alloy surface:
PO
H OZn O
H PO
Zn2 43 2 3 4 2 2
4 4
2
3 (5)
PO
H OMg Zn O H PO Mg
Zn 2 2 4 2 2
3 4 2 2 4 4 2
2 (6)
4
2 2 23 2 4 2 2 2 4 4 4 2
3Zn H PO H O eZn PO H O H (7)
4
2 2 22 2 4 2 2 2 2 4 4 4 2
2Zn Mg H PO H O eZnMg PO H O H (8)
[image:11.596.134.464.112.371.2]
Zn e
Zn2 2 (9)
Therefore, the presence of Zn can be detected by XRD and XPS, as showed in Fig. 4 and Fig. 5.
4. CONCLUSIONS
(1) The growth process of the phosphate conversion coating on magnesium alloy AZ91D could be divided into three steps. In the first step (0-40 s) the potential fluctuated sharply due to the alternate presence and absence of the metastable crystal nucleuses and the formation of the stable crystal nucleuses. In the second step (40-200 s) the potential moved to the negative direction because of the electrochemical inhomogeneity attributed to the growth of the stable crystal nucleuses. In the finally step (200-1200 s) the potential move to the positive direction slowly until it leveled off because the thickness of the phosphate conversion coating increased gradually from the slab-like phosphate crystals initially.
(2) The phosphate conversion coating showed a uniform, compact and integral crystal clusters and was composed of Zn3(PO4)2, Zn2Mg(PO4)2 and Zn.
References
1. J.E. Gray and B. Luan, Journal of Alloys and Compounds, 336 (2002) 88.
2. T.S. Shih, J.B. Liu and P.S. Wei, Materials Chemistry and Physics, 104 (2007) 497. 3. G.L. Song and D.S. John, Corrosion Science, 46 (2004) 1381.
4. G.L. Song and D.S. John, Materials and Corrosion, 56 (2005) 15.
5. L.Y. Niu, Z.H. Jiang, G.Y. Li, C.D. Gu and J.S. Lian, Surface & Coating Technology, 200 (2006) 3021.
6. Z.Y. Yong, J. Zhu, C. Qiu and Y.L. Liu, Applied Surface Science, 255 (2008) 1672.
7. R.C. Zeng, Z.D. Lan, L.H. Kong, Y.D. Huang and H.Z. Cui, Surface & Coating Technology, 205 (2011) 3347.
8. G.Y. Li, J.S. Lian, L.Y. Niu, Z.H. Jiang and Q. Jiang, Surface & Coating Technology, 201 (2006) 1814.
9. L. Kouisni, M. Azzi, M. Zertoubi, F. Dalard and S. Maximovitch, Surface & Coating Technology, 185 (200) 58.
10.J.L. Poli, E. Cano and J.M. Bastidas, Journal of Electroanalytical Chemistry, 537 (2002) 183. 11.11 L. Benea, P.L. Bonora, A. Borello, S. Martelli, F. Wenger, P. Ponthiaux and J. Galland, Solid
State Ionics, 151 (2002) 89.
12.S.A. Umoren, Y. Li and F.H. Wang, Corrosion Science, 52 (2010) 2422. 13.K.F. Khaled, Corrosion Science, 52 (2010) 2905.
14.N. Wager and E. Gulzow, Journal of Power Sources, 127 (2004) 341.
15.H.P. Duan, K.Q. Du, C.W. Yan and F.H. Wang, Electrochimica Acta, 51 (2006) 2898. 16.Y.L. Cheng, H.L. Wu, Z.H. Chen, H.M. Wang, Z. Zhang and Y.W. Wu, Transactions of
Nonferrous Metals Society of China, 17 (2007) 502.
18.L.Y. Niu, J.X. Lin, Y. Li, Z.M. Shi and L.C. Xu, Transactions of Nonferrous Metals Society of China, 20 (2010) 1356.
19.J. Park and C.K. Lee, Surface & Coating Technology, 259 (2014) 50.
20.Z.P. Xie, Q.C. Liu, Z.W. Chang and X.B. Zhang, Electrochimica Acta, 90 (2013) 695.