City, University of London Institutional Repository
Citation
:
Tan, L.H.T. and Ward, G. (2007). Output order in immediate serial recall. Memory and Cognition, 35(5), pp. 1093-1106. doi: 10.3758/BF03193481This is the accepted version of the paper.
This version of the publication may differ from the final published
version.
Permanent repository link: http://openaccess.city.ac.uk/4269/
Link to published version
:
http://dx.doi.org/10.3758/BF03193481Copyright and reuse:
City Research Online aims to make research
outputs of City, University of London available to a wider audience.
Copyright and Moral Rights remain with the author(s) and/or copyright
holders. URLs from City Research Online may be freely distributed and
linked to.
City Research Online: http://openaccess.city.ac.uk/ [email protected]
Output order in immediate serial recall
Lydia Tan and Geoff Ward
University of Essex
Correspondence to:
Lydia Tan or Geoff Ward,
Department of Psychology,
University of Essex,
Wivenhoe Park,
Colchester
CO4 3SQ,
U.K.
Telephone: +44 1206 873800 /+44 1206 873799
Fax: +44 1206 873590
E-mail: [email protected] / [email protected]
Abstract
Two experiments examined the effect of output order in immediate serial
recall (ISR). In Experiment 1, three groups of participants saw lists of 8 words
and wrote down the words in the rows corresponding to their serial positions in
an 8-row response grid. One group was pre-cued to respond in forwards order, a
second group was pre-cued to respond in any order, and a third group was
post-cued for response order. There were significant effects of output order but not of
cue type. Relative to the forwards output order, the free output order led to
enhanced recency and diminished primacy, with superior performance for words
output early in recall. These results were replicated in Experiment 2 using 6-item
lists, which further suggests that output order plays an important role in the
primacy effect in ISR, and that the recency items are most highly accessible at
recall.
In the immediate serial recall (ISR) task, participants are presented with
sequences of digits, letters or words and immediately after the last item has been
presented, must try to recall as many of the items as possible in the correct serial
order. With very short lists, performance on the task is near-perfect, but as the
list length is increased so performance breaks down in a characteristic manner:
there are extended primacy effects (superior recall of early items) and limited
recency effects (superior recall of terminal items). These large primacy effects
are rather distinctive because performance in many other immediate memory
tasks (such as sequential probed recall and cued recall) typically lead to
recency-dominated serial position curves. The resulting serial position curve in ISR has
become a fundamental empirical finding that must be explained by all models of
ISR.
Primacy effects have been modelled in a number of different ways. Many
models assume that the encoding or activation strength of successive list items
decreases over serial positions, such that items in early input positions have
greater activations than subsequent items. In some models, this is the primary
cause of primacy effects (e.g., Farrell & Lewandowsky, 2002; Lewandowsky,
1999; Page & Norris, 1998). For example, in Page and Norris’s (1998) primacy
model, the result of the greater activation of the earlier items is a primacy
gradient. During recall, the most active item, usually the first presented item, is
first chosen for recall and then suppressed. Following this, the item with the next
highest activation is recalled and suppressed, and so on. The primacy gradient
In other models, item selection at recall is not based directly on the items’
activation strengths, but indirectly through positional, temporal or contextual
markers (e.g., Brown, Preece & Hulme, 2000; Burgess & Hitch, 1999; Henson,
1998). Nevertheless, many of these models similarly incorporate some form of
primacy gradient. In Henson’s (1998) Start-End Model (SEM), for example, each
item is stored in memory as a token containing information about the item’s
position relative to the start and end of a list. During retrieval, items are cued by
reinstating the positional markers for each item and comparing the overlap in
positional information between the cue and the tokens in memory. Primacy and
recency effects are produced mainly because the positional markers have a greater
positional distinctiveness at the start and end of a list. In addition, the start marker
is more distinctive than the end marker, leading to a larger primacy than recency
effect.
A third class of short-term memory model is based on the idea of the
temporal or contextual distinctiveness of list items (Brown, Neath & Chater,
2002; Glenberg & Swanson, 1986). In these models, items in memory are thought
to be situated along a temporal or contextual continuum, and recall is considered
to be a process of discrimination along this continuum. The discriminability, and
hence retrievability, of these items is a function of the inter-item interval and the
retention interval. According to one such implementation, the scale-invariant
memory, perception and learning (SIMPLE) model (Brown et al., 2002), the
primacy effect in ISR is mainly the result of the shifting temporal perspective
retention interval for the recency items compared to the primacy items, and hence
an extended primacy effect.
An alternative (or in some cases, additional) source of primacy is
produced through output interference. According to one interpretation of output
interference, the recall of an item in a list has a negative effect on the recall of the
other list items. However, other interpretations exist. For example, the feature
model (Nairne, 1988, 1990) assumes that recall involves the sampling and
recovery of items in memory, and that the probability of recovering a sampled
item decreases as the number of prior recoveries increases. Recall in ISR tasks
typically occurs in forwards serial order, such that the early items are subject to
less output interference than the later items, and this leads to a primacy effect.
Although this is called “output interference” in these accounts, it could arguably
be thought of as a form of response suppression. In the oscillator-based
associative recall (OSCAR) model of Brown et al. (2000), primacy effects can
potentially arise as a result of both output interference as well as the decrease in
encoding strength across list items.
There is some empirical evidence that the primacy effect in ISR may in
fact largely be due to output interference (Cowan, Saults & Brown, 2004; Cowan,
Saults, Elliott & Moreno, 2002). Cowan et al. (2002) pointed out that in the
typical ISR task, three factors are confounded: input serial position, output
position, and response set size. They therefore developed a technique aimed at
deconfounding these factors. In their method, lists of nine digits were presented
trials, participants had to cycle back to the beginning of the list and continue until
all nine responses had been made. Cowan et al. (2002) found that when input
serial position and output position were deconfounded in this way, the input serial
position curves obtained showed larger recency effects than primacy effects. In an
investigation of the modality effect in ISR, Beaman (2002) also manipulated the
order in which participants were required to output items at test. Some
participants had to perform standard forwards serial recall, beginning recall from
the start of the list, whilst others were required to begin recalling (in forwards
serial order) the second half of the list before the first half of the list. A much
larger primacy effect was obtained with forwards serial recall from the beginning
of the list, whereas beginning recall from the second half of the list led to a much
more extensive recency effect. A similar manipulation of recall order by Posner
(1964) also resulted in greater recency than primacy effects. Finally, Oberauer
(2003) demonstrated that when the effects of input order, output order and spatial
order were examined separately, a large primacy effect was obtained only when
recall performance was plotted by output position. These studies suggest that
output interference may indeed be responsible for the extensive primacy effects
and relatively modest recency effects normally found in ISR.
There are, however, a number of potential problems with these
experiments. Firstly, the requirement to start recalling from different serial
positions may lead to participants using different strategies from those normally
occurring in “standard” ISR. Furthermore, different encoding strategies may also
be used depending on the particular portion of the list from which participants are
such that encoding strategies are likely to be similar across different output
conditions (as in the Cowan et al., 2002 study), no direct comparison is usually
made with performance in a standard pre-cued ISR condition in which
participants always recall in standard forwards order (although see Beaman
(2002) for an exception). Finally, by assigning participants with a start position, it
is impossible to tell from which point participants would choose to output if they
were not so constrained. These latter data might provide an insight as to which
items are most accessible or discriminable at time of test.
The present experiments sought to investigate these issues further by using
both standard forwards output ISR, as well as the free position recall technique
used by Crowder (1969). In our technique, participants are free to write down the
list items in any order they choose at test, as long as their ultimate written position
corresponds with the order in which the items were presented. Using this
technique, it is possible to gain an insight as to which items are the most easily
accessible at time of test. If the extended primacy effects typically observed in
standard ISR reflect the greater accessibility of early list items at test, then
participants in the free output order might continue to output the early items first,
and the serial position curve under free output conditions may be relatively
unaffected. If, however, the recency items are the most highly accessible at test,
then when participants are free to choose their order of output at recall, they might
be expected to output the recency items before the primacy items, and this might
lead to serial position curves with larger recency than primacy effects. In addition,
before the start of the list (pre-cue) or only at the end of the list (post-cue). The
reason for using a pre-cue/post-cue technique was to determine whether any
differences in the serial position curves which might be found in the two output
order conditions were due to strategic factors occurring at encoding. If any
differences in the serial position curves in the two output order tasks for the
pre-cue condition are maintained in the post-pre-cue condition, it suggests that these
differences could not be due to differences occurring at encoding, because the
curves are unaffected by whether participants know in advance which output
order will be required. Rather, any differences in the serial position curves are
likely to be due to differences occurring at retrieval (such as differences in output
strategies) between the two output order tasks.
Experiment 1
In Experiment 1, three groups of participants viewed 32 lists of 8 words
for tests of immediate serial memory. One group knew in advance that they would
always perform standard ISR with forwards output: they saw 8 words, one at a
time, and at the end of the list had to write down the words in strict forwards order
in an 8-row response grid. A second group knew in advance that they would
always perform ISR with free output; that is, they viewed the words as before, but
at the end of the list they had to write down the words in their correct serial
position in the 8-row response grid, but were free to write down their responses in
any order. A third group viewed the lists in the same way as the two other groups,
order conditions they would be tested with. On a random half of the trials, the
participants were post-cued to respond in strict forwards order (as in group 1),
whereas on the remaining trials participants were post-cued to respond freely (as
in group 2) in any order in the response grid.
Method
Participants. Forty-eight students from the University of Essex participated in this
experiment.
Materials. The materials were selected from the Toronto Word Pool (Friendly,
Franklin, Hoffman & Rubin, 1982) and consisted of 272 nouns with frequencies
of occurrence of 10-50 per million based on the Kucera & Francis (1967) norms.
From this word pool, 32 experimental lists of 8 words per list were constructed.
Participants in each of the two pre-cue conditions received 32 lists, either for
forwards or free output. Participants in the post-cue condition received 16 lists for
forwards output and 16 lists for free output. Words were randomly selected for
each participant. Two additional practice lists of 8 words were similarly
generated. No participant received the same word twice during the experiment.
The materials were presented using the application Supercard on an Apple
Macintosh computer.
Design. The experiment used a mixed design. Serial position was always a
within-subjects factor (8 levels: serial positions 1-8). Cue type (2 levels: pre-cued and
post-cued) was a between-subjects factor. Output order (forwards or free) was
Procedure. Participants were randomly divided into 3 groups of 16 and were
tested individually. The 3 groups were the pre-cued forwards output order group,
the pre-cued free output order group, and the post-cued group, who received both
forwards and free output orders.
In all four conditions, each list began with a warning tone and a visual
pre-list cue, followed after 3 seconds by a series of 8 words presented visually one at
a time in the centre of the computer screen at a rate of 2 seconds per word (1
second on, 1 second off). Participants were instructed to read aloud each word as
it was presented. A series of beeps and a visual post-list cue signalled the
beginning of the recall period. Participants were given 30 seconds to write down
their responses on a numbered response grid. They were not required to indicate
blanks for items they could not recall. They were also told to vocalise their
responses as they wrote them down. These were tape recorded for subsequent
analysis.
The pre-list and post-list cues in the pre-cued forwards output condition
were the words “Same order”, indicating that participants were to write down the
words in the same order in which they had been presented. (Participants were
allowed to begin recalling from any serial position as long as recall was
performed in strict forwards order, i.e., they were not allowed to go back to fill in
previous blanks in the response grid.) The list and post-list cues in the
pre-cued free output condition were the words “Any order”, indicating that
participants could write down the words in any order, as long as each word was
written in the same position in which it had been presented, i.e. the first word
post-cued condition, the pre-list cue was the string “?????????”, and the post-list
cue was either “Same order” or “Any order” depending on the relevant output
condition, which was randomly determined.
Results
On a small minority of trials (between 0.8% and 2%, depending on condition),
participants failed to obey instructions by either not following a strict forwards
order output strategy (in the forwards output order conditions), or not verbalising
all their responses, such that the output order of the recalled words could not be
determined (in the free output order conditions). These trials were eliminated
from subsequent analyses.
An item was scored as correct only if it was written in the correct position in the
8-row response grid. The mean proportion of correct responses for each condition
are plotted in Figures 1A and 1B, and are replotted in Figures 1C and 1D to aid
comparison.
Effect of Output Order
Pre-cued conditions. The proportions of items recalled at each serial position for
the pre-cued forwards and free output orders are shown in Figure 1A. A 2 (Output
order: forwards or free) x 8 (Serial positions: 1 to 8) between-subjects ANOVA
was performed. This revealed a significant main effect of serial position, F(7,
effects revealed a significant effect of output order at serial positions 1, 2 and 6-8
(all ps < .0001). Inspection of Figure 1A shows a larger primacy effect in the
forwards output order condition and a larger recency effect in the free output
order condition. There was a significant primacy effect in the forwards output
condition, and significant primacy and recency effects in the free output
condition. Tukey’s honestly significant difference (HSD) pairwise comparisons
revealed that in the forwards output condition, there were significant differences
between serial position 1 and all other serial positions (all ps < .001), between
serial position 2 and serial positions 4-8 (all ps < .05) and between serial position
3 and serial position 6 (p < .05). In the free output condition, there were
significant differences between serial position 1 and serial positions 3 and 4 (p <
.05), between serial positions 2-4 and serial position 6 (all ps < .05) and between
serial positions 1-6 and serial positions 7 and 8 (all ps < .001).
---
--Figure 1 about here--
---
Post-cued conditions. The proportion of items recalled at each serial position for
the post-cued forwards and free output orders is shown in Figure 1B. A 2 (Output
order: forwards or free) x 8 (Serial positions: 1 to 8) within-subjects ANOVA was
performed. This revealed a significant main effect of output order, F(1, 15) =
69.13, MSE = .551, p < .0001, and serial position, F(7, 105) = 18.63, MSE = .703,
significant, F(7, 105) = 22.07, MSE = .303, p < .0001. Simple main effects
revealed a significant effect of output order at serial positions 1 and 6-8 (all ps <
.05). Inspection of Figure 1B shows that, as in the pre-cued conditions, there is
greater primacy in the forwards output order condition and greater recency in the
free output order condition. There was a significant primacy effect in the forwards
output condition, and significant primacy and recency effects in the free output
condition. Tukey’s HSD revealed that in the forwards output condition, there
were significant differences between serial position 1 and all other serial positions
(all ps < .05), and between serial position 2 and serial position 7 (p < .05). In the
free output condition, there were significant differences between serial position 1
and serial positions 3-6 (all ps < .01) and 8 (p < .05), between serial position 7
and serial positions 3-6 (all ps < .05), and between serial position 8 and all other
serial positions (all ps < .05).
Effect of Cue Type
Forwards output order. The proportion of items recalled at each serial position for
the forwards output order conditions are replotted in Figure 1C for ease of
comparison. A 2 (Cue type: pre-cued or post-cued) x 8 (Serial positions: 1 to 8)
between subjects ANOVA was performed. This revealed a significant main effect
of serial position, F(7, 210) = 39.04, MSE = .834, p < .0001, but not of cue type (p
> .05). Tukey’s HSD tests revealed significant differences between serial position
1 and all other serial positions (all ps< .001), between serial position 2 and all
between serial position 8 and serial positions 6 (p < .01) and 7 (p < .05). The cue
type x serial position interaction was not significant (F < 1).
Free output order. The proportion of items recalled at each serial position for the
free output order conditions are also replotted in Figure 1D. A 2 (Cue type:
pre-cued or post-pre-cued) x 8 (Serial positions: 1 to 8) between subjects ANOVA was
performed. This revealed a significant main effect of serial position, F(7, 210) =
61.21, MSE = 1.319, p < .0001, and a significant interaction between cue type and
serial position, F(7, 210) = 3.90, MSE = .084, p < .001. Simple main effects
revealed a significant effect of cue type at serial positions 6 and 7 (ps < .01).
Tukey’s HSD revealed that in the pre-cued condition, there were significant
differences between serial position 1 and serial positions 3, 4, 7 and 8 (all ps <
.01), between serial positions 3 and 4 and serial position 6 (ps < .01), and between
serial positions 7 and 8 and all other serial positions (all ps < .001). In the
post-cued condition, there were significant differences between serial position 1 and
serial positions 2-6 and 8 (all ps < .05), between serial position 2 and serial
positions 4 (p < .05) and 8 (p < .001), between serial position 7 and serial
positions 3-6 (all ps < .001), and between serial position 8 and all other serial
positions (all ps < .001). Inspection of Figure 1D indicates a somewhat larger
recency effect in the pre-cued condition compared to the post-cued condition.
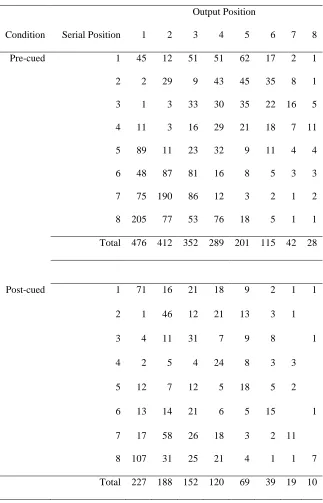
Analysis of Output Order
The number of correct responses for each serial position and output order
condition are shown in Tables 1 (forwards output) and 2 (free output). Inspection
the order in which items are output. In the free output conditions, participants are
most likely to start recalling from the later serial positions, whereas in the
forwards output conditions, participants are most likely to start recalling from the
early serial positions. This provides evidence that the differences found in the
serial position curves across the two output order conditions are indeed due to
differences in the order in which list items are output. Items that are output early
are associated with higher recall probabilities than items that are output later.
---
--Table 1 about here--
---
---
--Table 2 about here--
---
Further analyses were performed to examine the most common sequences of
responses. We report the two most common correct starting sequences up to a
maximum sequence length of 4. In the pre-cued forwards condition, these output
sequences were 1234 and 1 (21% and 20% of all correct sequences respectively).
In the pre-cued free output condition, these were 5678 and 8 (12% and 9% of all
correct sequences respectively). In the post-cued forwards condition, these
sequences were 1 and 12 (21% and 14% of all correct sequences respectively).
both the end and the beginning of the list, and were 8 and 1234 (13% and 7% of
all correct sequences respectively).
---
--Figure 2 about here--
---
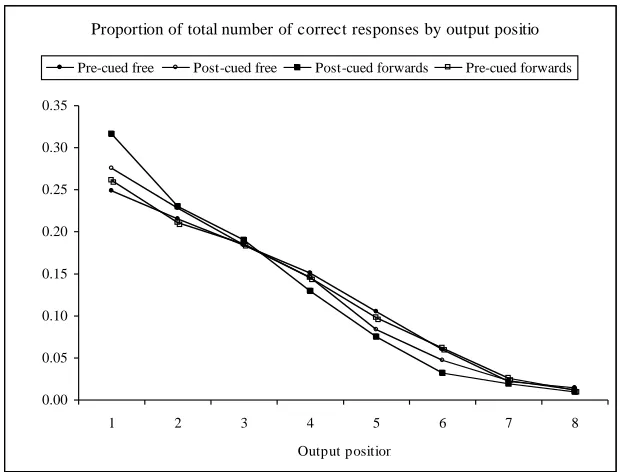
Figure 2 plots, for each condition, the number of correct responses at each output
position as a proportion of the total number of correct responses for that
condition. This was done in order to examine the effect of output position whilst
controlling for the absolute level of recall across conditions. The figure shows that
this proportion decreases steadily as output position increases, and that the rate of
decrease is approximately similar across all conditions: between 80% to 86% of
all correct responses are made within the first four output positions.
Analysis of Errors
Following Maylor, Vousden and Brown (1999), errors were classified into 3
categories: movements, omissions or intrusions. A movement error was recorded
whenever a list item was recalled in an incorrect position in the 8-row response
grid. An omission error was recorded whenever a line on the response grid was
left blank. An intrusion error was recorded whenever an extra-list item was
recalled. Intrusion errors constituted a very small percentage (between 1.7% and
2.5%) of the total responses and we will therefore concentrate on the movement
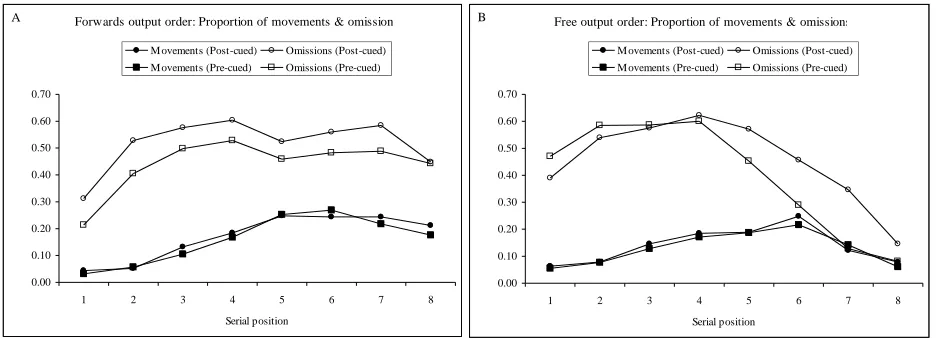
The movement and omission errors were analysed as proportions of the total
number of responses at each serial position, and are shown for each serial position
for the forwards output order conditions (Figure 3A) and for the free output order
conditions (Figure 3B).
---
--Figure 3 about here--
---
Movement errors
Forwards output order. A 2 (Cue type: pre-cued or post-cued) x 8 (Serial position:
1 to 8) ANOVA was conducted. There was a significant main effect of serial
position, F(7, 210) = 32.34, MSE = .233, p < .0001, but the effect of cue type and
the cue-type x serial position interaction were not significant (F < 1). Tukey’s
HSD pairwise comparisons on the main effect of serial position revealed
significant differences between serial position 1 and serial positions 3-8 (all ps <
.01), between serial position 2 and serial positions 4-8 (all ps < .001), between
serial position 3 and serial positions 5-8 (all ps < .05), and between serial position
4 and serial positions 5 and 6 (ps < .05). Figure 3A shows a steady increase in the
proportion of movement errors up to serial position 5. Appendix A1 details the
full distribution of responses across all serial positions for both the forwards and
free output order conditions.
Free output order. A 2 (Cue type: pre-cued or post-cued) x 8 (Serial position: 1 to
F(7, 210) = 17.36, MSE = .125, p < .0001, but the effect of cue type and the
cue-type x serial position interaction were not significant (F < 1). Tukey’s HSD tests
on the main effect of serial position revealed significant differences between
serial position 1 and serial positions 3-7 (all ps < .05), between serial position 2
and serial positions 4-6 (all ps < .001), between serial position 3 and serial
position 6 (p < .001), between serial positions 6 and 7 (p < .001), and between
serial position 8 and serial positions 3-6 (all ps < .05). Figure 3B shows an
increase in the proportion of movement errors up to serial position 6, followed by
a decrease at serial positions 7 and 8.
Omission errors
Forwards output order. A 2 (Cue type: pre-cued or post-cued) x 8 (Serial position:
1 to 8) ANOVA was conducted. There was a main effect of cue type, F(1, 30) =
4.43, MSE = .390, p < .05, due to a slightly greater proportion of omissions in the
post-cued condition than the pre-cued condition and a significant main effect of
serial position, F(7, 210) = 12.46, MSE = .290, p < .0001, but the cue-type x serial
position interaction was not significant (F < 1). Figure 3A shows that omissions
increase up to serial position 4 and remain relatively constant thereafter. Tukey’s
HSD pairwise comparisons on the main effect of serial position revealed a
significant difference between serial position 1 and all other serial positions (p <
.001), and between serial positions 4 and 8 (p < .05).
Free output order. A 2 (Cue type: pre-cued or post-cued) x 8 (Serial position: 1 to
8) ANOVA was conducted. There was a non-significant main effect of cue type (
p > .05), a significant main effect of serial position, F(7, 210) = 48.77, MSE =
F(7, 210) = 4.27, MSE = .088, p < .001. Simple main effects revealed a significant
effect of serial position at serial positions 5-7 (all ps < .05). Tukey’s HSD
revealed that in the pre-cued condition, there were significant differences between
serial position 6 and all other serial positions (all ps < .05), and between serial
positions 7 and 8 and serial positions 1-6 (all ps < .05). In the post-cued condition,
there were significant differences between serial position 1 and serial positions
3-5 and 8 (all ps < .05), between serial position 4 and serial position 6 (p < .05),
between serial position 7 and serial positions 2-5 and 8 (all ps < .01), and between
serial position 8 and all other serial positions (all ps < .01). Figure 3B shows a
large decrease in omissions across serial positions 5-8.
Discussion
There are three primary findings from Experiment 1. First, when
participants are given the choice of which items to output at the point of recall, the
majority of their initial responses come from items from the later input serial
positions. It is argued that this differential output strategy has an effect on the
shape of the serial position curve, with reduced primacy and increased recency
effects in the free output order conditions. Second, the fact that similar patterns of
recall were obtained in both the pre- and post-cued conditions suggests that
participants used similar, or at least compatible, strategies at encoding for the two
output order conditions. There was, however, some difference in the most
found to decrease steadily with output position (Figure 2), with little differences
in the slope and shape of this function across all four conditions. This further
points to the importance of a word’s output position during recall.
Secondary analyses on the patterns of errors (Figure 3) revealed that
across all four conditions, movement errors increased with serial position,
reaching a maximum of approximately 20% at serial position 6, and then
decreasing thereafter (with this decrease being more pronounced in the free than
the forwards output order conditions). Omission errors were more frequent than
movement errors, reaching a maximum of approximately 50-60% at serial
position 4. In contrast to the similarities in the patterns of movement errors, there
were large differences in the patterns of omissions across the forwards and free
output conditions. In the forwards output condition, omissions generally increased
over the first four serial positions and then remained at a relatively high level
thereafter. However, omission errors in the free output condition showed only a
slight increase over the first four serial positions, and decreased markedly towards
the end of the list.
When the error patterns in Figure 3 are considered in conjunction with the
recall patterns in Figures 1C and 1D, it can be seen that the decrease in recall over
the early serial positions present in all the curves reflects an increase in both
movement and omission errors over the first four serial positions. By contrast, the
differences in the magnitude of the recency effects across the four conditions in
Figures 1C and 1D largely reflects differences in the levels of omission errors
Experiment 2
One possible limitation of Experiment 1 was that the 8-item lists that we
used were relatively long. Some researchers have claimed that data generated
using longer lists might not generalise to that generated using shorter lists, since
only data collected with shorter lists (typically 5 or 6 items) might make use of
specialised short-term or working memory mechanisms (e.g., Baddeley, 2000;
Baddeley & Larsen, 2003; Hanley & Bakopolou, 2003; Larsen & Baddeley, 2003;
Page & Norris, 1998). Hence, it was decided to replicate Experiment 1 with
shorter lists of 6 items.
Method
Participants. Forty-eight students from the University of Essex participated in this
experiment. None had taken part in Experiment 1.
Materials. The materials were identical to those used in Experiment 1, except that
lists of 6 words (instead of 8) were constructed for each participant.
Design. The experiment used a mixed design. Serial position was always a
within-subjects factor (6 levels: serial positions 1-6). Cue type (2 levels: pre-cued and
post-cued) was a between-subjects factor. Output order (forwards or free) was
manipulated both within- and between-subjects.
Procedure. The procedure was identical to that of Experiment 1, with the sole
Results
As in Experiment 1, a small number of trials (between 0.2% and 1.2%) were
eliminated from subsequent analyses because participants failed to comply with
instructions.
An item was scored as correct only if it was written in the correct position in the
6-row response grid. The mean proportion of correct responses for each condition
are plotted in Figures 4A and 4B, and are replotted in Figures 4C and 4D to aid
comparison.
Effect of Output Order
Pre-cued conditions. The proportion of items recalled at each serial position for
the pre-cued forwards and free output orders are shown in Figure 4A. A 2 (Output
order: forwards or free) x 6 (Serial positions: 1 to 6) between-subjects ANOVA
was performed. This revealed a significant main effect of serial position, F(5,
150) = 15.60, MSE = .297, p < .0001, and a significant interaction between output
order and serial position, F(5, 150) = 14.30, MSE = .272, p < .0001. Simple main
effects revealed a significant effect of output order at serial positions 1 and 4-6
(all ps < .05). Inspection of Figure 4A shows a larger primacy effect in the
forwards output order condition and a larger recency effect in the free output
order condition. Tukey’s HSD revealed that in the forwards output condition,
there were significant differences between serial position 1 and all other serial
positions (all ps < .05) and between serial position 2 and serial positions 4-6 (all
condition. There were significant differences between serial position 1 and 3 (p <
.01), between serial positions 3 and 5 (p < .01), and between serial position 6 and
serial positions 2-4 (all ps < .001).
---
--Figure 4 about here--
---
Post-cued conditions. The proportion of items recalled at each serial position for
the post-cued forwards and free output orders is shown in Figure 4B. A 2 (Output
order: forwards or free) x 6 (Serial positions: 1 to 6) within-subjects ANOVA was
performed. This revealed a significant main effect of serial position, F(5, 75) =
18.00, MSE = .523, p < .0001. The interaction between output order and serial
position was also significant, F(5, 75) = 10.72, MSE = .193, p < .0001. Simple
main effects revealed a significant effect of output order at serial position 6 (p <
.01). Inspection of Figure 4B shows that, as in the pre-cued conditions, there is
greater primacy in the forwards output order condition (although this difference is
not statistically significant, F < 1) and greater recency in the free output order
condition. Tukey’s HSD revealed that in the forwards output condition, there
were significant differences between serial position 1 and serial positions 3-6 (all
ps < .001) and between serial position 2 and serial positions 4-6 (all ps < .05).
Significant primacy and recency effects were found in the free output condition.
and 4 (ps< .01), and between serial position 6 and serial positions 3-5 (all ps <
.01).
Effect of Cue Type
Forwards output order. The proportion of items recalled at each serial position for
the forwards output order conditions are replotted in Figure 4C for ease of
comparison. A 2 (Cue type: pre-cued or post-cued) x 6 (Serial positions: 1 to 6)
between subjects ANOVA was performed. This revealed a significant main effect
of serial position, F(5, 150) = 46.26, MSE = .837, p < .0001, but not of cue type
(F < 1). The cue type x serial position interaction was also not significant (F < 1).
There was an extended primacy effect and a one-item recency effect. Tukey’s
HSD pairwise comparisons on the main effect of serial position revealed
significant differences between serial position 1 and all other serial positions (all
ps < .001), between serial position 2 and all other serial positions (all ps < .001),
between serial position 3 and serial positions 4 and 5 (ps < .05), and between
serial position 5 and serial position 6 (p < .05).
Free output order. The proportion of items recalled at each serial position for the
free output order conditions are also replotted in Figure 4D. A 2 (Cue type:
pre-cued or post-pre-cued) x 6 (Serial positions: 1 to 6) between subjects ANOVA was
performed. This revealed a significant main effect of serial position, F(5, 150) =
16.14, MSE = .395, p < .0001. There was no main effect of cue type and the cue
type x serial position interaction was non-significant (both ps > .05). There were
significant primacy and recency effects. Tukey’s HSD tests on the main effect of
positions 2-4 (all ps < .05), between serial position 3 and 4 and serial position 5
(ps < .05), and between serial position 6 and serial positions 2-5 (all ps < .01).
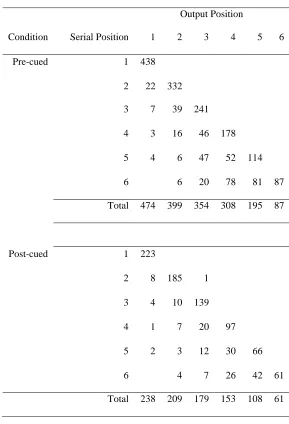
Analysis of Output Order
The number of correct responses for each serial position and output order
condition are shown in Tables 3 (forwards output) and 4 (free output). As
expected for the forwards output conditions, most of the initial output responses
were of items from the early serial positions. In addition, in the free output
conditions, as found in Experiment 1, the majority of initial output responses were
from the later serial positions (e.g., in output position 1 of the pre-cued condition,
there were 188 words from serial position 1 compared to a total of 270 words
from serial positions 4-6). However, one noticeable difference is that in
Experiment 2, there appears to be a sizeable increase in the proportion of recalls
beginning from the early serial positions. For example, in Experiment 1, out of the
total number of responses in output position 1, a proportion of between 0.09 (45
out of 476 responses) for the pre-cued condition and 0.31 (71 out of 227
responses) for the post-cued condition were made from serial position 1. In
Experiment 2, these proportions have increased to between 0.39 (188 out of 481
responses) for the pre-cued condition and 0.45 (109 out of 243 responses) for the
post-cued condition. Hence, while there is a similar tendency in Experiment 2 for
participants in the free output conditions to start recalling from the later serial
positions, this tendency is somewhat reduced.
the output order of list items. Items which are output early have higher recall
probabilities than items which are output later.
---
--Table 3 about here--
---
---
--Table 4 about here--
---
As in Experiment 1, further analyses were performed to examine the most
common sequences of responses. We report the two most common correct starting
sequences up to a maximum sequence length of 4. In the pre-cued forwards
condition, these output sequences were 1234 and 1 (33% and 14% of all correct
sequences respectively). In the pre-cued free output condition, these were 1234
and 4561 (17% and 9% of all correct sequences respectively). In the post-cued
forwards condition, these sequences were 1234 and 12 (37% and 13% of all
correct sequences respectively). Finally, in the post-cued free condition, they were
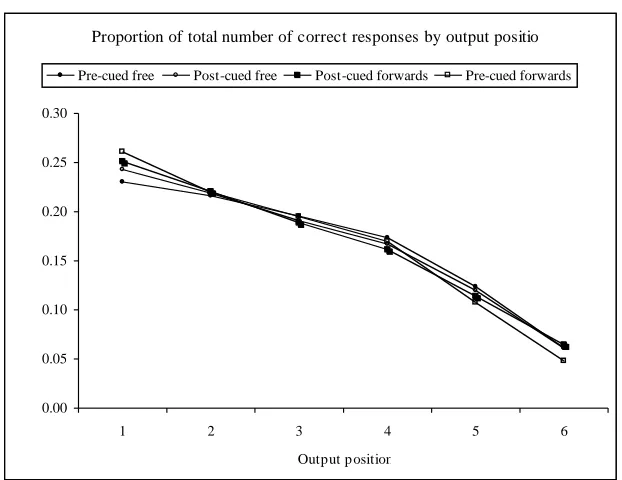
1234 and 4561 (19% and 6% of all correct sequences respectively).
---
--Figure 5 about here--
Figure 5 plots, for each condition, the number of correct responses at each output
position as a proportion of the total number of correct responses for that
condition. The figure shows that, as in Experiment 1, this proportion decreases
steadily as output position increases, and that the rate of decrease is
approximately similar across all conditions.
Analysis of Errors
The proportions of responses that were movement errors, omission errors or
intrusion errors in Experiment 2 were calculated in the same way as before.
Intrusion errors similarly constituted a very small percentage of the responses
(between 1.8% and 2.8%) and will not be discussed further. The movement errors
and the omission errors are shown for each serial position for the forwards output
conditions (Figure 6A) and for the free output conditions (Figure 6B).
---
--Figure 6 about here--
---
Movements
Forwards output order. A 2 (Cue type: pre-cued or post-cued) x 6 (Serial position:
1 to 6) ANOVA was conducted. There was a significant main effect of serial
position, F(5, 150) = 30.58, MSE = .149, p < .0001, but the effect of cue type and
the cue-type x serial position interaction were not significant (p > .05). Tukey’s
HSD on the main effect of serial position revealed significant differences between
positions 4 and 5 (ps < .05), and between serial position 6 and serial positions 4
and 5 (ps < .01). Figure 6A shows a steady increase in the proportion of
movement errors up to serial position 5, followed by a decrease at serial position
6. Appendix A2 details the full distribution of responses across all serial positions
for both the forwards and free output order conditions.
Free output order. A 2 (Cue type: pre-cued or post-cued) x 6 (Serial position: 1 to
6) ANOVA was conducted. There was a significant main effect of serial position,
F(5, 150) = 20.23, MSE = .144, p < .0001, but the effect of cue type and the
cue-type x serial position interaction were not significant (p > .05). Tukey’s HSD on
the main effect of serial position revealed significant differences between serial
position 1 and serial positions 2-5 (all ps < .05), between serial position 2 and
serial positions 3 and 4 (ps < .05), between serial position 4 and serial position 5
(p < .05), and between serial position 6 and serial positions 2-5 (all ps < .01).
Figure 6B shows that movement errors increased up to serial position 4 and then
decreased across serial positions 5 and 6.
Omissions
Forwards output order. A 2 (Cue type: pre-cued or post-cued) x 6 (Serial position:
1 to 6) ANOVA was conducted. There was a significant main effect of serial
position, F(5, 150) = 19.11, MSE = .303, p < .0001. The effect of cue type and the
cue-type x serial position interaction were not significant (F < 1). Figure 6A
shows a general increase in omission errors with serial position. Tukey’s HSD
revealed a significant difference between serial position 1 and all other serial
Free output order. A 2 (Cue type: pre-cued or post-cued) x 6 (Serial position: 1 to
6) ANOVA was conducted. There was a significant main effect of serial position,
F(5, 150) = 6.52, MSE = .119, p < .0001. The effect of cue type and the cue-type x
serial position interaction were not significant (p > .05). Figure 6B shows that
omissions increased up to serial position 3 and decreased thereafter. Tukey’s HSD
tests revealed a significant difference between serial positions 1 and 3 (p < .05)
and between serial position 6 and serial positions 2-4 (all ps < .01).
Discussion
Experiment 2 confirms the main findings of Experiment 1 – when
participants are free to output items in any order (whilst ensuring items are in their
correct input serial positions), they choose to start recalling from the later serial
positions, and this results in increased recency effects and somewhat reduced
primacy effects for the free output condition relative to the forwards output
condition (Figure 4). In addition, there was little or no effect of cue type in
Experiment 2, and there were no differences in the most common initial output
sequences between the pre- and post-cued free output conditions. These findings
suggest that the differences in the serial position curves for the forwards and free
output conditions cannot be due to strategic differences at encoding. Finally, as in
Experiment 1, there was a steep decline in performance with increasing output
position (Figure 5).
across the four conditions, increasing up to serial positions 4-5 and decreasing
thereafter (particularly in the free output conditions). There were also more
omission errors than movement errors in Experiment 2, and greater differences in
the patterns of omissions than movement errors across the two output order
conditions. Omissions were greatest at later serial positions for the forwards
output conditions but were reduced at the corresponding serial positions for the
free output conditions. The fact that similar serial position curves, output patterns
and error patterns are obtained even when the list length has been reduced to 6
items suggests that similar processes are occuring in the recall of these shorter
lists.
There is, however, one significant difference between Experiments 1 and
2. In Experiment 2, there is a noticeable increase in the extent to which
participants choose to output the first item first in the free output conditions.
Although participants still choose to start their output more often with later serial
positions than early serial positions, there is nevertheless a marked increase in
participants starting their responses with serial position 1. This difference is also
apparent in the most common initial output sequences in the pre-cued free output
conditions of Experiments 1 and 2. This increased tendency to start in a forwards
order in the free output conditions may also be reflected in the differences
between the serial position curves obtained in Experiments 1 and 2: in Experiment
2, the differences between the primacy and recency effects in the forwards and
free output order conditions are somewhat smaller than the corresponding
General Discussion
The two experiments reported here show that output order is an important
factor in determining the shape of the standard serial position curve. In a typical
ISR task, participants are made to output list items in a strictly forwards order,
that is, beginning with the first presented item and ending with the last presented
item, and their performance decreases with serial position (with the exception of a
1-item recency effect). The decline in performance with increasing serial position
is therefore usually confounded with a corresponding increase in output order.
The present study provides a method in which output order and serial position
may be deconfounded. In the free output order conditions, participants are free to
choose the order in which items are output. The experiments show that when
given the choice, they tend to begin their recall protocols with items occurring in
later serial positions before moving on to items occurring in early serial positions.
This pattern of output was present in both the pre-cued (Tables 1 and 3) and
post-cued (Tables 2 and 4) conditions, and we believe that it is largely responsible for
the different patterns of recall performance reflected in the serial position curves
for the two output order conditions (Figures 1 and 4). Under forwards output
conditions, the large primacy effect and somewhat smaller recency effect that are
characteristic of recall performance in ISR are obtained. However, under free
output conditions, a significantly smaller primacy effect and larger recency effect
are obtained. The effects of output order are most clearly shown in Figures 2 and
5. We believe that these findings are consistent with those of Beaman (2002) and
also of Crowder (1969) and Wood and Hinrichs (1971), who similarly used a free
output order methodology and obtained serial position curves with more extensive
recency than primacy effects.
A second aspect of our findings concerns the effect of cue type on recall.
The results obtained suggest that there are no substantial effects of cue type on
recall. While there was some evidence that pre-cuing led to a slightly higher
proportion of recall than post-cuing (Figures 1C and 1D) in Experiment 1, the
effects were small and inconsistent (non-significant with forwards output and only
at serial positions 6 and 7 with free output) and were not present in Experiment 2
(Figures 4C and 4D). This provides further evidence that the differences found in
the serial position curves under the free and forwards output conditions are due to
differences in output order at retrieval (rather than strategic differences at
encoding).
A third finding concerns the patterns of errors in Experiments 1 and 2.
These suggest that the differences in serial position curves under the forwards
output and the free output conditions are largely (but not exclusively) due to
differences in the pattern of omission errors (Figures 3 and 6). Although
participants often do not recall all the items, the post-cued conditions demonstrate
that at test, more items are accessible to participants than they ultimately are able
to report. As more words are output, so accessibility to subsequent words
decreases. We note that the rates of omission errors are high in our experiments
(and that our rates of movement errors low) compared to the data from some other
set of words, which reduces the opportunities to guess or generate candidate list
items at recall. When a small, closed set of words is used (such as when using
digits, consonants, or words from a restricted word pool), participants might use
knowledge of the word set to cue their responses. This may lead to a decrease in
omission errors and a corresponding increase in accuracy, movement errors (items
from within the same list) or intrusion errors (items from the restricted set that
were presented on earlier lists). This difficulty in attributing the exact cause of
different types of errors in ISR and other immediate memory tasks is well known
and trade-offs between different types of errors through the use of list structure
and sophisticated guessing has been suggested, for example, by Farrell and
Lewandowsky (2003).
We believe our findings are entirely consistent with previous research that
shows detrimental effects of output upon ISR performance (Cowan et al., 2002;
Cowan et al., 2004; Nairne, 1988, 1990; Oberauer, 2003). Our methodology does
not allow us to distinguish between item-based effects of output interference (e.g.,
Nairne, 1988, 1990) and time-based effects of output delay (e.g., Brown et al.,
2002), but other recent work has shed light on this issue. Lewandowsky, Duncan
and Brown (2004) showed that it is not time per se that causes poorer
performance in serial recall, but event-based factors (such as output interference
or a primacy gradient). Furthermore, in a recent paper, Nairne, Ceo, and Reysen
(in press) provide evidence that the retrieval of one list item can have either a
positive or a negative effect on the subsequent recall of a second list item. Recall
two items in the list (cf., Kahana & Caplan, 2002) but have negative effects on the
recall of other list items. In their experiments, the critical comparisons were made
using probed recall, which occurred at a fixed retention interval after the end of
the list. The differences observed by Nairne et al., therefore, cannot be attributed
to output delay, and further show that effects of item-based output interference are
specific to different list positions, and therefore not best modelled by a general
decrement in recall of all subsequent items (as modelled by, for example, the
general addition of noise, e.g., Brown et al., 2000). However, it is probable that
output interference is not the only factor in determining ISR performance since
small primacy effects remain even when output interference is controlled for
(Cowan et al., 2002; Oberauer, 2003).
We believe our data provide some constraints on theoretical modelling in
at least three ways. First, our data support claims that much of the primacy effect
reflects processes occurring at output rather than processes occurring at encoding,
and so our data constrain the relative importance that should be given to such
mechanisms within theories of ISR. Second, our data show that participants are
quite capable of starting their output from serial positions other than the first, and
that they need not recall items in a strict forwards order to accurately recall the
items in their correct serial positions. This questions the extent to which serial
recall necessitates a resetting of the context-timing signal, or reinstatement of the
learning context, to the beginning of the list. Third, our data suggest that similar
immediate memory mechanisms are being used for 6- and 8-item lists, contrary to
short lists (e.g., Baddeley, 2000; Baddeley & Larsen, 2003; Larsen & Baddeley,
2003). Because the basic patterns of results from Experiment 1 are replicated in
Experiment 2, which used a shorter, more conventional list length of 6 items,
Experiment 2 not only confirms that these data are suitable for modelling with
Working Memory models, but also appears to challenge these models to account
for the similarities across list lengths. To be fair to those who argue that different
memory mechanisms are used for shorter lists, we should acknowledge that there
was one significant difference with the shorter lists - there was a greater tendency
to output items in a forwards order in the free output condition of Experiment 2
(6-item list) than in Experiment 1 (8-item list) (see Tables 2 and 4). This tendency
was also seen in the pre-cued free output condition of Experiment 2, in which
there was a slightly greater tendency for participants to start their recall sequences
with items from the beginning of the list. Whether this difference is enough to
justify the postulation of separate memory mechanisms over different list lengths
is open to debate.
Finally, although it should be noted that the task used here was a free
position recall task, which is not strictly identical to the “standard” ISR task, our
data are consistent with other studies which have used variations of the ISR task
(e.g., Beaman, 2002; Cowan et al., 2002; Crowder, 1969; Posner, 1964) and have
similarly found significantly larger recency effects than primacy effects when
output position has been taken into account. In addition, the finding that
participants in the free output conditions often choose to recall from towards the
(Beaman & Morton, 2000; Nilsson, Wright & Murdock, 1975). These findings are
in line with the more general finding of recency-dominated serial position curves
in other short-term memory tasks such as those found in the sequential digit probe
task (Waugh & Norman, 1965), the running memory span task (Hockey, 1973),
the probe paired associates task (Murdock, 1963, 1967), and the free recall task
(Murdock, 1962; Tan & Ward, 2000; Ward & Tan, 2004). Taken together, these
results suggest that the processes underlying ISR may be more sensitive to
recency, and hence more similar to other short-term memory tasks, than one
References
Baddeley, A.D. (2000). The phonological loop and the irrelevant speech effect:
Some comments on Neath (2000). Psychonomic Bulletin and Review, 7,
544-549.
Baddeley, A., & Larsen, J.D. (2003). The disruption of STM: A response to our
commentators. Quarterly Journal of Experimental Psychology, 56A,
1301-1306.
Beaman, C.P. (2002). Inverting the modality effect in serial recall. Quarterly
Journal of Experimental Psychology, 55, 371-389.
Beaman, C. P., & Morton, J. (2000). The separate but related origins of the
recency and the modality effect in free recall. Cognition, 77, B59-B65.
Brown, G.D.A., Neath, I., & Chater, N. (2002). A ratio model of scale-invariant
memory and identification. Manuscript submitted for publication.
Brown, G.D.A., Preece, T., & Hulme, C. (2000). Oscillator-based memory for
serial order. Psychological Review, 107, 127-181.
Burgess, N., & Hitch, G. (1999). Memory for serial order: A network model of
the phonological loop and its timing. Psychological Review, 106,
551-581.
Cowan, N., Saults, J.S., & Brown, G.D.A. (2004). On the auditory modality
superiority effect in serial recall: Separating input and output factors.
Journal of Experimental Psychology: Learning, Memory and Cognition,
Cowan, N., Saults, J.S., Elliott, E.M., & Moreno, M. (2002). Deconfounding
serial recall. Journal of Memory and Language, 46, 153-177.
Crowder, R.G. (1969). Behavioral strategies in immediate memory. Journal of
Verbal Learning and Verbal Behavior, 8, 524-528.
Farrell, S., & Lewandowsky, S. (2002). An endogenous distributed model of
ordering in serial recall. Psychonomic Bulletin & Review, 9, 59-79.
Farrell, S., & Lewandowsky, S. (2003). Dissimilar items benefit from
phonological similarity in serial recall. Journal of Experimental
Psychology: Learning, Memory and Cognition, 29, 838-849.
Friendly, M., Franklin, P.E., Hoffman, D., & Rubin, D.C. (1982). Norms for the
Toronto Word Pool. Behavior Research Methods and Instrumentation,
14, 375-399.
Glenberg, A.M., & Swanson, N. (1986). A temporal distinctiveness theory of
recency and modality effects. Journal of Experimental Psychology:
Learning, Memory and Cognition, 12, 3-24.
Hanley, J.R., & Bakopoulou, E. (2003). Irrelevant speech, articulatory
suppression, and phonological similarity: A test of the phonological loop
model and the feature model. Psychonomic Bulletin and Review, 10,
435-444.
Henson, R.N.A. (1998). Short-term memory for serial order: The start-end
model. Cognitive Psychology, 36, 73-137.
Hockey, R. (1973). Rate of presentation in running memory and direct
manipulation of input-processing strategies. Quarterly Journal of
Kahana, M.J., & Caplan, J.B. (2002). Associative symmetry in probed recall of
serial lists. Memory & Cognition, 30, 841-849.
Kucera, H., & Francis, V. W. (1967). Computational analysis of present-day
American English.Providence, RI: Brown University Press.
Larsen, J.D., & Baddeley, A. (2003). Disruption of verbal STM by irrelevant
speech, articulatory suppression, and manual tapping: Do they have a
common source? Quarterly Journal of Experimental Psychology, 56A,
1249-1268.
Lewandowsky, S. (1999). Redintegration and response suppression in serial
recall: A dynamic network model. International Journal of Psychology,
34, 434-446.
Lewandowsky, S., Duncan, M., & Brown, G.D.A. (2004). Time does not cause
forgetting in short-term serial recall. Psychonomic Bulletin & Review,
11, 771-790.
Maylor, E.A., Vousden, J.I., & Brown, G.D.A. (1999). Adult age differences in
short-term memory for serial order: Data and a model. Psychology and
Aging, 14, 572-594.
Murdock, B.B., Jr. (1962). The serial position effect of free recall. Journal of
Experimental Psychology, 64, 482-488.
Murdock, B.B., Jr. (1963). Short-term memory and paired-associate learning.
Journal of Verbal Learning and Verbal Behavior, 2, 320-328.
Murdock, B.B., Jr. (1967). Distractor and probe techniques in short-term
Nairne, J.S. (1988). A framework for interpreting recency effects in immediate
serial recall. Memory and Cognition, 16, 343-352.
Nairne, J.S. (1990). A feature model of immediate memory. Memory and
Cognition, 18, 251-269.
Nairne, J.S., Ceo, D.A., & Reysen, M.B. (in press). The mnemonic effects of
recall on immediate retention. Memory and Cognition.
Nilsson, L.G., Wright, E., & Murdock, B.B. (1975). The effects of visual
presentation method on single-trial free recall. Memory & Cognition, 3,
427-433.
Oberauer, K. (2003). Understanding serial position curves in short-term
recognition and recall. Journal of Memory and Language, 49, 469-483.
Page, M.P.A., & Norris, D. (1998). The primacy model: A new model of
immediate serial recall. Psychological Review, 105, 761-781.
Posner, M.I. (1964). Rate of presentation and order of recall in immediate
memory. British Journal of Psychology, 55, 303-306.
Tan, L., & Ward, G. (2000). A recency-based account of primacy effects in
free recall. Journal of Experimental Psychology: Learning, Memory,
and Cognition, 26, 1589-1625.
Ward, G., & Tan, L. (2004). The effect of the length of to-be-remembered
lists and intervening lists on free recall: A reexamination using overt
rehearsal. Journal of Experimental Psychology: Learning, Memory,
and Cognition, 30, 1196-1210.
Waugh, N.C., & Norman, D.A. (1965). Primary memory. Psychological
Wood, L. E., & Hinrichs, J. V. (1971). Cueing of recall order in immediate
memory with different rates of presentation. American Journal of
Acknowledgements
This research was conducted as part of an ESRC research grant
number R000239674 awarded to the second author. Experiment 1 was presented
at an Experimental Psychological Society meeting at the University of Essex,
Table 1. Total Number of Correct Responses for Each Output Position and Serial
Position in the Forwards Output Conditions (Experiment 1).
Output Position
Condition Serial Position 1 2 3 4 5 6 7 8
Pre-cued 1 382
2 11 261
3 7 24 170
4 4 14 30 106
5 12 4 28 35 67
6 5 17 10 26 25 43
7 1 16 30 22 34 14 32
8 2 6 33 47 33 43 10 19
Total 424 342 301 236 159 100 42 19
Post-cued 1 161
2 6 99
3 9 10 54
4 5 5 10 33
5 10 8 10 9 20
6 4 10 8 6 8 13
7 1 8 15 6 3 2 8
8 2 3 22 27 16 5 4 6
Table 2. Total Number of Correct Responses for Each Output Position and Serial
Position in the Free Output Conditions (Experiment 1).
Output Position
Condition Serial Position 1 2 3 4 5 6 7 8
Pre-cued 1 45 12 51 51 62 17 2 1
2 2 29 9 43 45 35 8 1
3 1 3 33 30 35 22 16 5
4 11 3 16 29 21 18 7 11
5 89 11 23 32 9 11 4 4
6 48 87 81 16 8 5 3 3
7 75 190 86 12 3 2 1 2
8 205 77 53 76 18 5 1 1
Total 476 412 352 289 201 115 42 28
Post-cued 1 71 16 21 18 9 2 1 1
2 1 46 12 21 13 3 1
3 4 11 31 7 9 8 1
4 2 5 4 24 8 3 3
5 12 7 12 5 18 5 2
6 13 14 21 6 5 15 1
7 17 58 26 18 3 2 11
8 107 31 25 21 4 1 1 7
Table 3. Total Number of Correct Responses for Each Output Position and Serial
Position in the Forwards Output Conditions (Experiment 2).
Output Position
Condition Serial Position 1 2 3 4 5 6
Pre-cued 1 438
2 22 332
3 7 39 241
4 3 16 46 178
5 4 6 47 52 114
6 6 20 78 81 87
Total 474 399 354 308 195 87
Post-cued 1 223
2 8 185 1
3 4 10 139
4 1 7 20 97
5 2 3 12 30 66
6 4 7 26 42 61
Table 4. Total Number of Correct Responses for Each Output Position and Serial
Position in the Free Output Conditions (Experiment 2).
Output Position
Condition Serial Position 1 2 3 4 5 6
Pre-cued 1 188 10 50 78 37 13
2 5 154 16 69 58 17
3 18 13 137 44 42 23
4 94 24 74 100 8 19
5 69 176 30 25 68 3
6 107 73 100 46 45 53
Total 481 450 407 362 258 128
Post-cued 1 109 17 32 28 9 5
2 3 91 18 24 26 5
3 2 10 75 28 13 14
4 22 6 26 54 10 6
5 26 66 8 17 35 5
6 81 29 32 16 27 26
Figure captions
Figure 1. Data from Experiment 1. The figure shows the mean
proportion of correct responses as a function of input serial position for
the pre-cued conditions (Figure 1A) and the post-cued conditions
(Figure 1B). These data are replotted in Figures 1C and 1D. Figure 1C
shows the mean proportion of correct responses as a function of input
serial position for the forwards output order conditions. Figure 1D
shows the mean proportion of correct responses as a function of input
serial position for the free output order conditions.
Figure 2. Data from Experiment 1. The figure shows the proportion of
the total number of correct responses for each condition as a function of
output position.
Figure 3. Data from Experiment 1. The figure shows the mean
proportions of movement and omission errors as a function of input
serial position for the forwards output conditions (Figure 3A) and the
free output conditions (Figure 3B).
Figure 4. Data from Experiment 2. The figure shows the mean
proportion of correct responses as a function of input serial position for
(Figure 4B). These data are replotted in Figures 4C and 4D. Figure 4C
shows the mean proportion of correct responses as a function of input
serial position for the forwards output order conditions. Figure 4D
shows the mean proportion of correct responses as a function of input
serial position for the free output order conditions.
Figure 5. Data from Experiment 2. The figure shows the proportion of
the total number of correct responses for each condition as a function of
output position.
Figure 6. Data from Experiment 2. The figure shows the mean
proportions of movement and omission errors as a function of input
serial position for the forwards output conditions (Figure 6A) and the
Figure 1. Pre-cued 0.00 0.10 0.20 0.30 0.40 0.50 0.60 0.70 0.80 0.90 1.00
1 2 3 4 5 6 7 8
Serial position P rop or ti on c or re ct
Forwards output order Free output order
A
Forwards output order
0.00 0.10 0.20 0.30 0.40 0.50 0.60 0.70 0.80 0.90 1.00
1 2 3 4 5 6 7 8
Serial position P rop or ti on c or re ct Pre-cued Post-cued C Post-cued 0.00 0.10 0.20 0.30 0.40 0.50 0.60 0.70 0.80 0.90 1.00
1 2 3 4 5 6 7 8
Serial position P rop or ti on c or re ct
Forwards output order Free output order
B
Free output order
0.00 0.10 0.20 0.30 0.40 0.50 0.60 0.70 0.80 0.90 1.00
1 2 3 4 5 6 7 8
Figure 2.
Proportion of total number of correct responses by output position
0.00 0.05 0.10 0.15 0.20 0.25 0.30 0.35
1 2 3 4 5 6 7 8
Output position
P
ropo
rt
ion
of
t
ot
al
num
be
r
of
c
or
re
ct
r
es
pon
se
s