This is a repository copy of
Mapping the urban wind resource over UK cities using an
analytical downscaling method
.
White Rose Research Online URL for this paper:
http://eprints.whiterose.ac.uk/81532/
Version: Accepted Version
Proceedings Paper:
Millward-Hopkins, JT, Tomlin, AS, Pourkashanian, M et al. (2 more authors) (2012)
Mapping the urban wind resource over UK cities using an analytical downscaling method.
In: Proceedings of the EWEA Annual Conference. EWEA 2012, 15-19 April 2012,
Copenhagen, Denmark. EWEA .
[email protected] https://eprints.whiterose.ac.uk/ Reuse
Unless indicated otherwise, fulltext items are protected by copyright with all rights reserved. The copyright exception in section 29 of the Copyright, Designs and Patents Act 1988 allows the making of a single copy solely for the purpose of non-commercial research or private study within the limits of fair dealing. The publisher or other rights-holder may allow further reproduction and re-use of this version - refer to the White Rose Research Online record for this item. Where records identify the publisher as the copyright holder, users can verify any specific terms of use on the publisher’s website.
Takedown
If you consider content in White Rose Research Online to be in breach of UK law, please notify us by
Mapping
the
Urban
Wind
Resource
over
UK
Cities
using
an
Analytical
Downscaling
Method
J. T. Millward-Hopkins, A. S. Tomlin*, L. Ma, D. B. Ingham, M. Pourkashanian.
School of Process, Environmental and Materials Engineering, University of Leeds, Leeds, LS2 9JT.
Abstract
Decentralised energy sources, such as urban wind energy, have a number of well known advantages. However, accurately predicting urban wind resource is notoriously difficult due to the complexity of air flows in the urban boundary layer. Without sufficiently accurate methods of predicting this resource, there is the danger that small-scale turbines will be installed at
unsuitable locations, which can be detrimental to the reputation of the wind energy industry. Additionally, viable sites may be overlooked, leading to the under-exploitation of small-scale wind in built areas. In this paper, we use an analytical down-scaling method to produce maps of mean wind speed as a function of height for a number of UK cities, via the use of detailed building data to estimate their aerodynamic characteristics. The predictions are shown to compare well with mean wind speeds measured at various locations, except at some sheltered sites which lie in highly complex regions of flow. We then consider the viability of urban wind energy at the city scale. The results suggest that residential properties in suburban areas are often unsuitable locations for rooftop turbines. However, there are many tall, unsheltered buildings in urban areas upon which turbines could access a substantial wind resource.
Preliminary results suggest that in the city of Leeds, UK there are potentially over 8000 suitable turbine locations. These results should be informative for turbine suppliers and customers attempting to assess the viability of potential sites, as well as being instructive for policymakers developing subsidies for small-scale renewable energy projects.
1 Introduction
Decentralised energy sources in the form of micro-generation have a number of well know advantages: they reduce dependence upon energy imports, avoid transmission losses, and allow individuals to be more responsible for their energy use. It has been suggested that potentially 40% of UK electricity could be sourced from micro-generation by the year 2050 [1], with small-scale wind energy contributing significantly to this. However, the industry is still in its infancy, particularly with regards to its application in urban areas.
A major barrier to the effective deployment of wind energy in urban areas is the current lack of accurate methods for estimating wind speeds and energy yields at potential turbine sites. The long-term onsite measurements normally required to obtain accurate wind resource assessment are often not convenient for small-scale turbine installations. However, if sufficiently accurate analytical methods of urban wind resource prediction are developed then this could reduce the likelihood of customers purchasing turbines with unrealistically high expectations of energy yields, or companies installing turbines at unsuitable locations for ‘greenwashing’ purposes [2]. These unfavourable scenarios can be detrimental to the reputation of the wind energy industry as a whole.
It is possible to estimate mean wind speeds over an area analytically, as a function of height, provided that both the regional wind climate and the roughness characteristics of the surface are known. This can be done by applying a ‘Wind Atlas Methodology’ [3], as is utilised in the Carbon Trust online wind estimator [4]. The process involves scaling wind speeds from a regional wind climate up to a height at which the frictional effect of the surface is absent, and then scaling back down accounting for the effect of the roughness of the surface upon the wind profile. However, within urban areas it is notoriously difficult to obtain accurate predictions using this type of methodology due to the complex frictional properties of urban surfaces and the influence of individual building aerodynamics upon the local wind resource [5].
In this paper an analytical methodology for predicting above-roof, mean wind speeds is tested in a number of UK cities. The methodology utilizes maps of aerodynamic parameters derived from detailed urban morphological databases [6], and considers wind directional effects. We use measured meteorological data from a number of cities spread throughout the UK to evaluate the methodology, namely Edinburgh, Leeds, Manchester, Nottingham, and Warwick. Finally, using Leeds as a case study, the predictions are used to assess the viability of urban wind energy at the city scale.
2 Datasets
2.1 Input Data
2.1.1 Regional Wind Climate
The prediction methodology requires the regional wind climate in the study area as an input. For this we use the freely available NOABL database [7], which gives wind speeds over the whole of the UK, at a resolution of 1km, which are valid at a height of 10m above a smooth surface. This database accounts for the influence upon wind speeds of the lands topography on scales greater than 1km.
2.1.2 Aerodynamic Parameter Maps
Along with the regional wind climate, maps of surface aerodynamic parameters over the study areas form the basis of the prediction methodology implemented in this paper. Specifically we use roughness length (z0) and displacement height (d) as inputs to the standard logarithmic
wind profile:
, (1)
⎟⎟
⎠
⎞
⎜⎜
⎝
⎛ −
=
0 *
ln
z
d
z
u
U
where u* is the friction velocity, is the Von Karman constant (≈ 0.4), and z is the height above
the ground.
Generally, when aerodynamically parameterizing an urban area it is first divided into a grid of ‘neighbourhood regions’, which are typically square and of a length-scale of around 0.25 - 1km [8-10]. Values of z0 and d are then assigned to each neighbourhood. In this work, we produce
maps of aerodynamic parameters on both an adaptive grid and a uniform grid of 250m
resolution for each of the five cities. Both of these grids are used in the prediction methodology, and when parameters from the uniform 250m grid are used we refer to these as the ‘local’ parameters. The values of z0 and d are calculated by inputting detailed urban morphological
data [11] into a flow model [12]. This process is described fully in ref. [6] for the city of Leeds, where the adaptive gridding process is also described.
There are two final points that should be noted. Firstly, the flow model [12] used to calculate the maps of aerodynamic parameters also outputs an additional parameter, namely the ‘effective mean building height’, hm-eff. Maps of hm-eff are therefore also produced by the process in ref. [6].
Conceptually, hm-eff is the average height of the unsheltered buildings in a neighbourhood, and it
specifies the height below which Equation 1 can no longer describe the wind profile accurately. Secondly, it should be noted that the aerodynamic parameters calculated by the process in ref. [6] are a function of the incoming wind direction, and hence in the prediction methodology we consider 8 compass wind directions: N, NE, E, SE, S, SW, W and NW.
2.2 Measured Validation Data
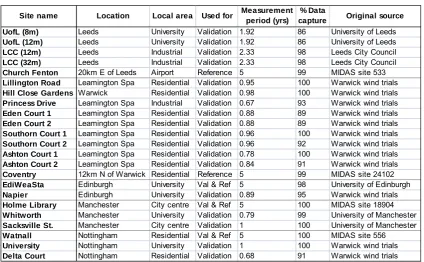
To test the accuracy of the prediction methodology we use measured wind speed data from 21 anemometers spread over the 5 cities. Basic information on these sites is given in the appendix table. The sites range from two-story suburban properties to medium-rise city-centre buildings and high-rise blocks of flats. They lie within local areas that can broadly be categorised as residential, industrial, university campus or city centre. Based upon the local geometrical details, each site is classified as ‘sheltered’if it is either below the local mean building height or less than 2m above the building roof, otherwise it is classed as ‘exposed’.
These validation data come from various sources including the Warwick Wind Trials [13] and numerous University and Met Office weather stations [14-16]. Measurement periods for all the sites lay within the five year period from the 1st of August 2006 to the 1st of August 2011, and hence for consistency the measured wind speed at each site (Umsr) is extrapolated to be
representative of this five year period (U5yr). This is achieved by using a simple correction factor
accounting for the seasonal and annual variation in wind speed measured at a nearby reference site.
3 Prediction
Methodology
3.1 Overview
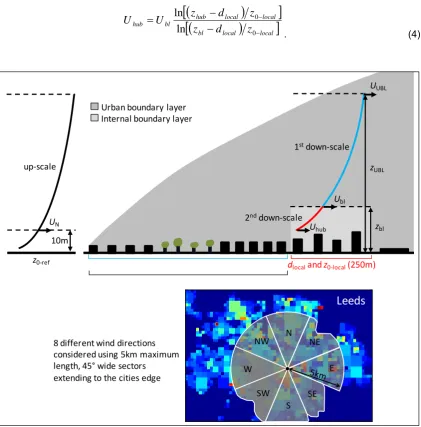
Figure 2 illustrates the methodology used to predict the mean wind speed for a given height and wind direction, in a particular 250m square neighbourhood region. In this section an overview of the various stages is described.
Initially, the wind speed at 10m above the ground from the regional wind climate (UN) is
scaled-up to the top of the urban boundary layer(the UBL; zUBL) which grows with increasing distance
into the city. At this height the influence of the urban surface is assumed to be absent. The standard logarithmic wind profile from equation 1 is used for this up-scaling, with a reference ‘open country’ roughness length of 0.14m (z0-ref). Therefore, the wind speed at zUBL is:
. (2)
)
10
ln(
)
ln(
0 0
ref ref UBL N
UBL
z
z
z
U
U
− −
Next, UUBL is scaled down through the UBL to the blending height (zbl), where the flow is
considered to be horizontally homogeneous [17]. Again, the logarithmic profile is used, and hence the wind speed at zbl is:
. (3)
Here, the aerodynamic parameters, z0-fetch and dfetch, are calculated by considering the
roughness values calculated for the land cover in the upwind fetch, via the method described in the following section.
Finally, Ubl is scaled down to the turbine hub height (zhub) using the logarithmic profile. This layer
of flow is considered to be adapted to the local neighbourhood region, and hence the local aerodynamic parameters (z0-local and dlocal) are used to estimate the wind speed at zhub:
[image:5.595.89.511.262.690.2]. (4)
Figure 2: Schematic diagram of the methodology implemented in the current work
(
)
[
]
(
)
[
UBL fetch fetch]
fetch fetch bl UBL bl
z
d
z
z
d
z
U
U
− −−
−
=
0 0ln
ln
(
)
[
]
(
)
[
bl local local]
local local hub bl hub
z
d
z
z
d
z
U
U
− −−
−
=
0 0ln
ln
Urban boundary layer
Internal boundary layer
dlocaland z0 local(250m) zUBL UUBL
1stdown scale
zbl Ubl
2nddown scale
N NE E SE S SW W NW
8 different wind directions
considered using 5km maximum
length, 45° wide sectors
extending to the cities edge
z0 ref 10m UN up scale
Uhub
3.2 Model Parameters
The first parameter in the methodology that must be calculated is the height of the UBL (zUBL).
To estimate this, the formula of Elliot [18] for boundary layer depth is used, limited to a realistic, maximum depth of 500m [19-20]:
. (5)
Here, X is the distance to the upwind edge of the city (illustrated on Figure 2), and z0-ref and z0-eff
are the ‘upwind’ and ‘downwind’ roughness lengths, respectively. Note that the constant in Equation 5 has been adjusted slightly from its original value of 0.75 to 0.65, as recommended in ref. [19]. Clearly determining the exact edge of a city, and hence X, can be quite subjective. However, the predicted wind speeds have a very low sensitivity to X, with the exception of those within a few hundred metres from the upwind city edge.
In the first stage of down-scaling both the blending height (zbl) and the aerodynamic parameters
of the upwind fetch (z0-fetch and dfetch) have to be calculated. It is difficult to estimate zbl
accurately, although it is normally estimated to be between 2 - 5 times the local mean building height (hm-local) for urban surfaces [20]. In this paper we use an estimate for zbl of 2hm-local.
In order to consider the effect of changing wind direction on the wind profile, we calculate z0-fetch
and dfetch separately for eight different 45° wide sectors. To obtain z0-fetch for each wind direction,
a blending method [21] is then applied to the values of z0 from the adaptive grid lying within
each sector. The ‘effective’ roughness length output by the blending method for each wind direction is representative of the average, area-weighted frictional effect of the surface cover in that sector. Unfortunately, there are no equivalent blending methods available to calculate an ‘effective’ displacement height for use as dfetch. Therefore, for each wind direction, dfetch is simply
calculated as the mean of the displacement height values from the adaptive grid lying within the sector.
3.3 Predictions within the Building Canopy
Occasionally, it is necessary to predict wind speeds at heights lying below the effective mean building height, and in this case Eq.1 is no longer valid. At these lower heights, within the urban ‘canopy layer’, the flow is highly complex and spatially variable, and wind speeds will generally be too low for turbines to operate. However, as illustrated in Figure 3, an approximation of the canopy layer wind profile can be made using an exponential profile [22]:
, (7) where Uhm-eff-local is the wind speed obtained from the log profile at the local effective mean
building height (hm-eff-local), h is the standard deviation of the local building heights, and f is the
frontal area density of the local area. Both h and f are calculated directly from the
morphological data, by the process detailed in ref. [6]. The inclusion of h in this equation is
suggested in ref. [23] to account for the influence of height variation upon the wind profile.
3.4 Implementation
To test the accuracy of the methodology, we make wind speed predictions at the measurement height (zhub) for each of the validation sites described in section 2.3. The methodology is
implemented using Matlab© to give mean wind speed predictions as a function of height for each city, at a 250m resolution. Eight different predictions are made for each of the wind directions we consider. Subsequently, to obtain the final wind speed prediction at each site, we simply calculate a weighted average of these predictions. The weighting is based upon the temporal frequency of the wind from each of the eight compass directions as recorded at the nearby reference station from Table 1.
(
)
[
]
⎪⎭ ⎪ ⎬ ⎫ ⎪⎩ ⎪ ⎨ ⎧ ⎥ ⎥ ⎦ ⎤ ⎢ ⎢ ⎣ ⎡ − = − − −− 0.65 0.03ln , 500
min 8 . 0 0 0 0 0 eff ref eff eff UBL z X z z z z
(
)
(
)
[
9.6 1 1]
exp -local -local
local
- − −
= hm−eff f h m hub m−eff
hub U h z h
Figure 3: Illustration of the down-scaling process of the prediction methodologies to hub heights below the canopy top. Parameters controlling the profiles are given in brackets.
4
Results and Discussion
4.1 Validation
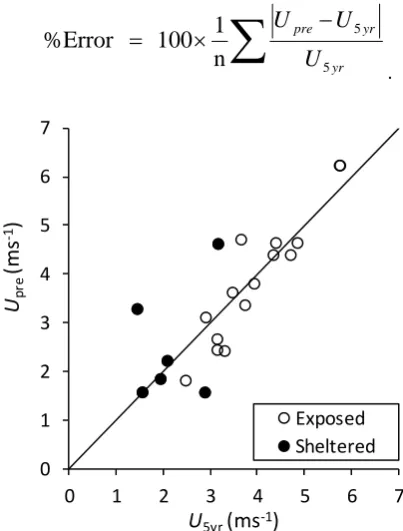
To evaluate the accuracy of the methodology, Figure 4 shows the correlation between the predicted (Upre) and measured (U5yr) wind speeds from all the validation sites. Figure 4 suggests
that the predictions are significantly more accurate at the exposed sites than at the sheltered sites. This is expected as the sheltered sites lie in complex regions of flow where wind speeds are influenced strongly by individual buildings. Without complex site specific modelling these wind speeds are difficult to predict. To test this conclusion the average percentage errors are calculated:
. (8)
Figure 4: Comparisons of predicted (Upre) and measured, 5 year corrected (U5yr) wind speeds
for each prediction methodology hm eff local
Exp profile
( fand /hm)
Log profile
(dlocal, z0 local)
Log profile
(dfetch, z0 fetch)
zbl
∑
−
×
=
yr yr pre
U
U
U
5 5
n
1
100
%Error
0 1 2 3 4 5 6 7
0 1 2 3 4 5 6 7
Up
re
(m
s
1)
U5yr(ms1)
[image:7.595.190.392.454.720.2]This error metric is calculated over the sheltered sites, exposed sites, and all the sites, giving errors of 38.5%, 12% and 19.5%, respectively. Considering the uncertainties in some of the model inputs this level of accuracy is acceptable. Furthermore, in order to access a significant wind resource, turbines will generally have to be placed at exposed sites, and these are the locations where the methodology has been shown to be most accurate.
4.2 City Scale Variations in the Wind Resource
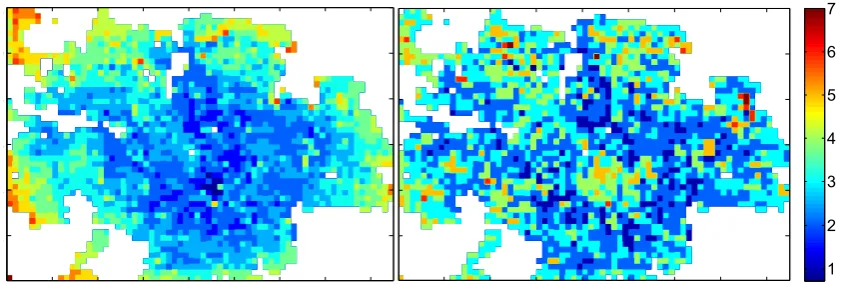
In this section we consider the city-scale variation of the wind resource, using Leeds as a case study. Fig. 5 (left) shows the predicted wind speeds 10m above the local mean building heights for each neighbourhood region. It shows that the wind speeds at this height generally increase with increasing distance from the city centre. This reflects the fact that the surface roughness is higher in the region around the city centre, and the urban boundary layer is thicker.
When the predicted wind speeds at the maximum local building height (i.e. the maximum building height within each grid square) are considered however, a different pattern emerges, as shown in Fig. 5 (right). It is now clear that much of the city, particularly the centre, contains tall buildings with significant rooftop mean wind speeds that are frequently over 5ms-1, and are comparable with those observed at typical rural sites. This is due to the fact that the city centre contains many tall, unsheltered buildings which can access relatively undisturbed winds despite the high roughness of the underlying surface.
[image:8.595.88.509.395.537.2]Conversely, in residential areas where each neighbourhood grid square is comprised of buildings of a similar height, the wind resource can often be quite poor, even at the maximum building height. This highlights the need for urban turbines to be mounted high enough to be clear of any sheltering from surrounding buildings and other obstructions, either by being located on tall buildings, or mounted on sufficiently tall masts, or ideally both.
Figure 5: Predicted wind speeds over Leeds (ms-1) at 10m above the local mean building heights (left) and at the maximum local building height (right)
4.3 How Many Turbines could be installed in Leeds?
Wind maps such as those shown in the previous section can be used to address questions such as “how many viable turbine locations might there be in Leeds”? To make a first attempt at answering this we use the building data for Leeds, in combination with the predicted
neighbourhood average wind speeds at each height, to calculate the total roof area predicted to receive a wind speed greater than a specified minimum value. By making three assumptions, an estimate of the number of turbines that may be installed at viable locations in Leeds can be made.
First, we must choose a value that is considered as the minimum viable mean wind speed for an installation. In reality, this value will depend on many factors such as turbine design, financial and environmental considerations. We choose here as an example, a mean wind speed of 4ms
-1
, which is close to the cut in speed of many roof mounted turbines. However, considering the
2 4 6 8 0 2
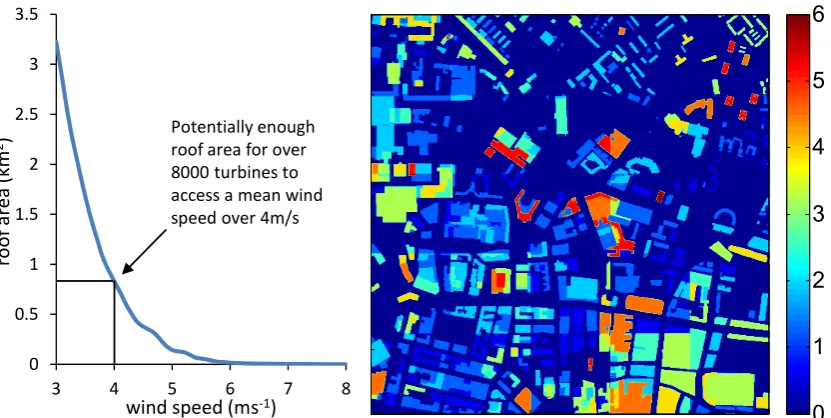
Figure 6: The plot on the left indicates the total roof area throughout Leeds upon which a mean wind speed greater or equal to that indicated on the X-axis can be found. The map on the right shows the predicted, above-roof mean wind speeds (in ms-1) in a central area of Leeds. A mast
height of 3m is assumed for both figures.
current UK Feed in Tariff framework [24] we believe this value to be on the conservative side. It should also be pointed out that in any viability study, the predicted mean wind speed would be combined with a suitable Weibull distribution in order to describe the wind speed frequency distributions necessary for power predictions [25]. Second, a single mast height must be chosen. We specify this height as 3m, although it would be desirable for the mast height to be variable depending upon the building type and structure. Again, this may be a conservative estimate, as on larger properties mast heights of up to 10m are feasible. Finally, an assumption of the roof area required for each turbine must be made. We assume here that one turbine is installed every 100m2, which is the plan area of a typical domestic property in the UK, and hence this assumption is approximately equivalent to one turbine per house. Again however, it would be desirable for buildings to be considered on a case by case basis and this will be developed in future work.
Fig. 6 (left) shows the total roof area throughout Leeds upon which a mean wind speed greater or equal to that indicated on the X-axis can be found. Fig. 6 (right) illustrates a snapshot of the data used for this calculation. It can be seen from Fig. 6 (left) that just over 0.8km2 of roof area in Leeds is predicted to have a wind speed of 4ms-1 or greater, at a mast height of 3m.
Therefore, using the assumption that one turbine is installed every 100m2 of roof area, this calculation suggests that in Leeds there are potentially over 8000 viable roof-top locations for turbines to be installed.
5 Conclusions
We have used an analytical down-scaling method to produce maps of mean wind speed as a function of height for a number of UK cities, at a 250m horizontal resolution. The methodology utilized maps of aerodynamic parameters derived from detailed urban morphological databases, and considered both building height heterogeneity and wind directional effects. The predictions compare well with mean wind speeds measured at various locations, except at some sheltered sites which lie in highly complex regions of flow.
0
1
2
3
4
5
6
0 0.5 1 1.5 2 2.5 3 3.5
3 4 5 6 7 8
ro
o
f
ar
e
a
(k
m
2)
wind speed (ms1)
Potentially enough
roof area for over
8000 turbines to
access a mean wind
We then considered the viability of urban wind energy at the city scale using the city of Leeds, UK as a case study. It was found that much of the city, particularly the centre, contains buildings with significant roof-top mean wind speeds, comparable with those observed at typical rural sites. This is due to the fact that the city centre contains many tall, unsheltered buildings which can access relatively undisturbed winds despite the high roughness of the underlying surface. However, the results suggested that residential properties in suburban areas are often unsuitable locations for rooftop turbines.
Preliminary results suggested that in the city of Leeds there are potentially over 8000 viable roof-top locations for turbines to be installed. A number of simplifications were made in the calculation, and future work will aim to refine this estimate by considering buildings on a case by case basis. These results should be informative for turbine suppliers and customers attempting to assess the viability of potential sites, as well as being instructive for policymakers developing subsidies for small-scale renewable energy projects.
Acknowledgements The authors would like to thank The University of Edinburgh School of Geosciences, The University of Manchester Centre for Atmospheric Science, the UK Met Office, Leeds City Council, and all parties involved in the Warwick Wind Trials, for providing valuable field data used in this work.
References
1. Microgeneration strategy (2006), www.berr.gov.uk/files/file27575.pdf, Department of Trade and Industry. [cited 2010 30/11].
2. Stankovic S, Campbell N, Harries A. Urban Wind Energy; Earthscan: London, 2009; 41. 3. Landberg L, Myllerup L, Rathmann O, Petersen EL, Jørgensen BH, Badger J, Mortensen NG. Wind Resource Estimation - An Overview. Wind Energy 2003; 6:261-271.
4. http://www.carbontrust.co.uk/windpowerestimator, Carbon Trust (accessed 20/05/10) 5. Millward-Hopkins JT, Tomlin AS, Ma L, Ingham D, Pourkashanian M. The predictability of above roof wind resource in the urban roughness sublayer. Wind Energy 2011;
10.1002/we.463.
6. Millward-Hopkins JT, Tomlin AS, Ma L, Ingham D, Pourkashanian M. Aerodynamic Parameters of a UK City Derived from Morphological Data. Submitted to Boundary-Layer Meteorology
7. http://www.bwea.com/noabl/, NOABL database (accessed 02/02/10)
8. Bottema M, Mestayer PG. Urban roughness mapping - validation techniques and some first results. Journal of Wind Engineering and Industrial Aerodynamics 1998; 74:163-173.
9. Ratti C, Di Sabatino S, Britter R, Brown M, Caton F, Burian S. Analysis of 3-D urban databases with respect to pollution dispersion for a number of European and American cities.
Water Soil and Air Pollution Focus 2002; 2:459-469.
10. Holland DE, Berglund JA, Spruce JP, McKellip RD. Derivation of Effective Aerodynamic Surface Roughness in Urban Areas from Airborne Lidar Terrain Data. Journal of Applied
Meteorology and Climatology 2008; 47:2614-2626.
11. http://www.landmap.ac.uk/, Landmap: Spatial Discovery. Avaliable through the Cities Revealed agreement (Cities Revealed © The GeoInformation Group 2008.)
12. Millward-Hopkins JT, Tomlin AS, Ma L, Ingham D, Pourkashanian M. Estimating Aerodynamic Parameters of Urban-Like Surfaces with Heterogeneous Building Heights.
Boundary-Layer Meteorology 2011; 141:443-465.
13. Encraft, Warwick Wind Trials Final Report, avaliable at http://www.warwickwindtrials.org.uk/
(accessed 06/01/12)
14. http://www.geos.ed.ac.uk/abs/Weathercam/station/
School of GeoSciences Weather Station. (accessed 10/01/12) 15. http://www.cas.manchester.ac.uk/restools/whitworth/index.html, Whitworth Meteorological Observatory. (accessed 10/01/12)
MIDAS Land Surface Stations data. (accessed 06/01/12)
17. Grimmond CSB, Oke TR. Aerodynamic properties of urban areas derived, from analysis of surface form. Journal of Applied Meteorology 1999; 38:1262-1292.
18. Elliot WP. The Growth of the Atmospheric Internal Boundary Layer. Transactions of the
American Geophysical Union 1958; 39:1048-1054.
19. Small-scale wind energy Technical Report (2008), UK Met Office,
http://www.carbontrust.co.uk/emerging-technologies/technology-directory/wind/pages/wind.aspx 20. Raupach MR, Antonia RA, Rajagopalan S. Rough-Wall Turbulent Boundary Layers. Applied
Mechanics Reviews 1991; 44:1-25.
21. Bou-Zeid E, Parlange MB, Meneveau C. On the parameterization of surface roughness at regional scales. Journal of the Atmospheric Sciences 2007; 64:216-227.
22. Macdonald RW. Modelling the mean velocity profile in the urban canopy layer. Boundary-Layer Meteorology 2000; 97:25-45.
23. Jiang DH, Jiang WM, Liu HN, Sun JN. Systematic influence of different building spacing, height and layout on mean wind and turbulent characteristics within and over urban building arrays. Wind and Structures 2008; 11:275-289.
24. http://www.energysavingtrust.org.uk/Generate-your-own-energy/Financial-incentives 25. Celik AN. Energy output estimation for small-scale wind power generators using Weibull-representative wind data. Journal of Wind Engineering and Industrial Aerodynamics 2003; 91:693-707
[image:11.595.87.512.381.643.2]Appendix
Table 1: Basic information on the measurement sites used for model validation
UofL (8m) Leeds University Validation 1.92 86 University of Leeds
UofL (12m) Leeds University Validation 1.92 86 University of Leeds
LCC (12m) Leeds Industrial Validation 2.33 98 Leeds City Council
LCC (32m) Leeds Industrial Validation 2.33 98 Leeds City Council
Church Fenton 20km E of Leeds Airport Reference 5 99 MIDAS site 533
Lillington Road Leamington Spa Residential Validation 0.95 100 Warwick wind trials
Hill Close Gardens Warwick Residential Validation 0.98 100 Warwick wind trials
Princess Drive Leamington Spa Industrial Validation 0.67 93 Warwick wind trials
Eden Court 1 Leamington Spa Residential Validation 0.88 89 Warwick wind trials
Eden Court 2 Leamington Spa Residential Validation 0.88 89 Warwick wind trials
Southorn Court 1 Leamington Spa Residential Validation 0.96 100 Warwick wind trials
Southorn Court 2 Leamington Spa Residential Validation 0.96 92 Warwick wind trials
Ashton Court 1 Leamington Spa Residential Validation 0.78 100 Warwick wind trials
Ashton Court 2 Leamington Spa Residential Validation 0.84 91 Warwick wind trials
Coventry 12km N of Warwick Residential Reference 5 99 MIDAS site 24102
EdiWeaSta Edinburgh University Val & Ref 5 98 University of Edinburgh
Napier Edinburgh University Validation 0.89 95 Warwick wind trials
Holme Library Manchester City centre Val & Ref 5 100 MIDAS site 18904
Whitworth Manchester University Validation 0.79 99 University of Manchester
Sacksville St. Manchester City centre Validation 1 100 University of Manchester
Watnall Nottingham Residential Val & Ref 5 100 MIDAS site 556
University Nottingham University Validation 1 100 Warwick wind trials
Delta Court Nottingham Residential Validation 0.68 91 Warwick wind trials
Location
Site name % Data
capture Original source Measurement
period (yrs) Used for