M E T H O D O L O G Y
Open Access
A rapid and sensitive assay of intercellular
coupling by voltage imaging of gap
junction networks
Federico Ceriani
1,2and Fabio Mammano
1,2,3*Abstract
Background:A variety of mechanisms that govern connexin channel gating and permeability regulate coupling in gap junction networks. Mutations in connexin genes have been linked to several pathologies, including
cardiovascular anomalies, peripheral neuropathy, skin disorders, cataracts and deafness. Gap junction coupling and its patho–physiological alterations are commonly assayed by microinjection experiments with fluorescent tracers, which typically require several minutes to allow dye transfer to a limited number of cells. Comparable or longer time intervals are required by fluorescence recovery after photobleaching experiments. Paired electrophysiological recordings have excellent time resolution but provide extremely limited spatial information regarding network connectivity.
Results:Here, we developed a rapid and sensitive method to assay gap junction communication using a
combination of single cell electrophysiology, large–scale optical recordings and a digital phase–sensitive detector to extract signals with a known frequency from Vf2.1.Cl, a novel fluorescent sensor of plasma membrane potential. Tests performed in HeLa cell cultures confirmed that suitably encoded Vf2.1.Cl signals remained confined within the network of cells visibly interconnected by fluorescently tagged gap junction channels. We used this method to visualize instantly intercellular connectivity over the whole field of view (hundreds of cells) in cochlear organotypic cultures from postnatal mice. A simple resistive network model reproduced accurately the spatial dependence of the electrical signals throughout the cellular network. Our data suggest that each pair of cochlear non−sensory cells of the lesser epithelial ridge is coupled by ~1500 gap junction channels, on average. Junctional conductance was reduced by 14% in cochlear cultures harboring the T5M mutation of connexin30, which induces a moderate hearing loss in connexin30T5M/T5Mknock–in mice, and by 91% in cultures from connexin30−/−mice, which are profoundly deaf.
Conclusions:Our methodology allows greater sensitivity (defined as the minimum magnitude of input signal required to produce a specified output signal having a specified signal−to−noise ratio) and better time resolution compared to classical tracer–based techniques. It permitted us to dynamically visualize intercellular connectivity down to the 10th order in non−sensory cell networks of the developing cochlea. We believe that our approach is of general interest and can be seamlessly extended to a variety of biological systems, as well as to other connexin−related disease conditions.
Keywords:Connexins, Electrical coupling, Dye coupling, Genetic deafness, Voltage sensitive dye, Digital phase−sensitive detector
* Correspondence:[email protected] 1
Dipartimento di Fisica e Astronomia“G. Galilei”, Università di Padova, Padova 35131, Italy
2
Istituto Veneto di Medicina Molecolare, Fondazione per la Ricerca Biomedica Avanzata, Via G. Orus, 2, Padova 35129, Italy
Full list of author information is available at the end of the article
Background
Cell–cell communication mediated by gap junctions is crucial to a variety of cellular functions, including the regulation of cell growth, differentiation and develop-ment [1]. In electrically excitable cells, gap junctions provide low–resistance pathways, traditionally referred to as electrical synapses, and permit transmission of electrical signals between adjacent cells. In the brain, electrical synapses have been shown to be important for enabling and detecting neuronal synchrony [2,3] and to regulate lineage–dependent microcircuit assembly [4]. In the heart, the ability to synchronize groups of cells is crucial to achieve a coordinated mechanical output [5,6]. In non–excitable cells, gap junctions permit to share metabolic demands across groups of cells, enable the ex-change of signaling molecules [7,8] and the spatial buff-ering of potassium ions [9].
Virtually all cells in solid tissues are coupled by gap junc-tions [1], thus it is not surprising that mutajunc-tions in connexin genes have been linked to a variety of human dis-eases, including cardiovascular anomalies, peripheral neur-opathy, skin disorders, cataracts and deafness [10-12]. Gap junction channels in the mammalian cochlea, the site of the sense of hearing, are formed primarily by connexin26 and connexin30 proteins encoded by nonsyndromic hear-ing loss and deafness (DNFB1) genes GJB2and GJB6, re-spectively [13]. Cochlear connexins are expressed very early on in development and interconnect virtually all types of non−sensory cells [14-16]. Morphological analysis of cochleae from different strains of mice with (targeted) abla-tion of connexin26 or connexin30 provide evidence of in-complete or arrested development ensuing in defects of hearing acquisition [12].
The most widely used approach to monitor intercellu-lar communication employs optical methods to track the movement of tracer molecules between neighboring cells. However, the sensitivity of this technique depends on the junctional permeability of the tracer employed, which varies significantly with the size of the permeant molecule and the type of gap junction channels. Sensitiv-ity can be increased by prolonging the loading time or by employing smaller tracer molecules (e.g. serotonin [17]).
Here, we used cochlear organotypic cultures to unravel the potential of Vf2.1.Cl, a member of the novel VoltageFluor (VF) family of fluorescent sensors [18]. VF dyes detect voltage changes by modulation of photo– induced electron transfer (PeT) from an electron donor through a synthetic molecular wire to a fluorophore. They have large, linear, turn–on fluorescence responses to depolarizing steps (20–27% fluorescence change per 100 mV), fast kinetics (τ << 140μs) and negligible cap-acitative loading. We exploited the Vf2.1.Cl voltage sen-sitive dye [18] to probe dynamically the extent of gap junction coupling by a combination of single cell
electrophysiology, large scale optical recordings and a digital phase–sensitive detector of fluorescence signals. Our method is readily applicable to a variety of cellular systems, as it requires only a patch–clamp amplifier to inject sinusoidal electrical signals at fixed frequency and amplitude in a single cell and a fluorescence microscope to track optically the VF dye response at the frequency of the stimulus throughout the network.
Results
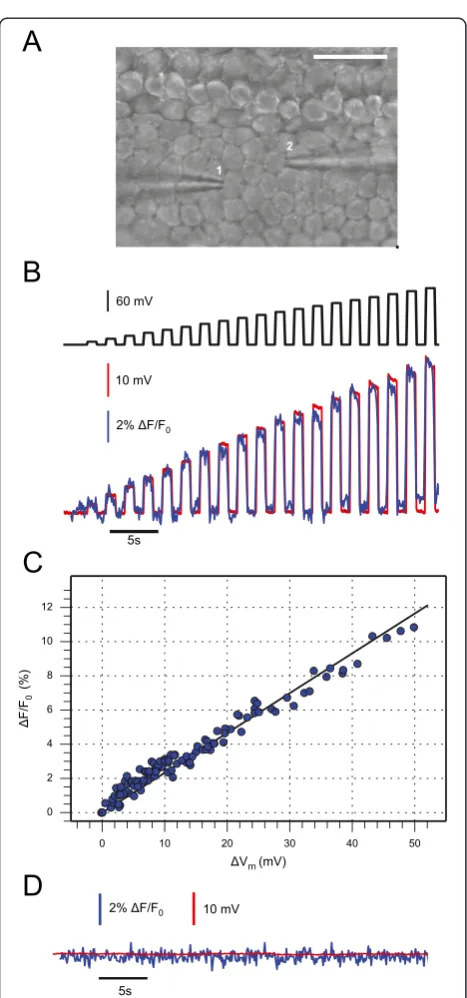
In–situcalibration of the Vf2.1.Cl voltage sensitive dye Organotypic cultures of cochlear explants from postnatal mice permit to investigate the patho–physiology of gap– junction–mediated intercellular signaling in a readily ac-cessible whole–organ context [19-24]. In order to cali-brate the voltage response of the fluorescent sensor in our experimental conditions (see Methods), we loaded organotypic cultures from wild type mice, euthanized at postnatal day 5 (P5), with Vf2.1.Cl. We then performed paired whole–cell patch clamp recordings from cochlear non−sensory cells of the lesser epithelial ridge. We stepped the voltage V0 of the patch clamp amplifier connected to one cell (cell 1, Figure 1A) in 10 mV incre-ments (Figure 1B, black trace) from the zero current po-tential (−61±2 mV, n= 15 cells) while monitoring the membrane potential (Vm) (Figure 1B, red trace) of a nearby cell (cell 2, Figure 1A) maintained under current–clamp conditions with a second amplifier. At the same time, we measured Vf2.1.Cl fluorescence emis-sion (F) from cell 2 (Figure 1B, blue trace). Data in Figure 1B,C highlight a linear relationship between the change in membrane potential (ΔVm) and the corre-sponding fractional change (ΔF/F0) in Vf2.1.Cl fluores-cence emission. Note that both ΔF/F0 and ΔVm were detected from cell 2. The correlation coefficient between ΔF/F0and ΔVm wasR= 0.98 (n= 5 paired recordings in 3 cultures) and a linear fit to the data (Figure 1C, solid line) yielded a responsivity (slope)m= 0.23 ± 0.03ΔF/F0/ mV (i.e. 23 ± 3% per 100 mV). Both ΔVmand ΔF/F0 re-sponses were suppressed after incubating the culture for 20 minutes in 100μM carbenoxolone (CBX, Figure 1D), a non−selective blocker of gap junction channels [25].
A digital phase–sensitive detector of Vf2.1.Cl signals visualizes and quantifies network connectivity
[image:3.595.57.291.81.581.2]Paired electrophysiological recordings, such as those in Figure 1, have excellent time resolution but provide ex-tremely limited spatial information regarding network connectivity. The main goal of the present study was to visualize rapidly network connectivity using large−scale optical recordings of Vf2.1.Cl florescence in different preparations and experimental conditions. The calibra-tion procedure reported in Figure 1 yielded maximal fluorescence changes ΔF/F0 in cell 2, close to cell 1, which rarely exceeded 10%. Electrical signals spreading passively through a resistive network are expected to at-tenuate rapidly with distance from the source (i.e. cell 1) and fluctuations due to photon shot noise hamper their detection [26]. We sought to overcome these limitations by the following procedure.
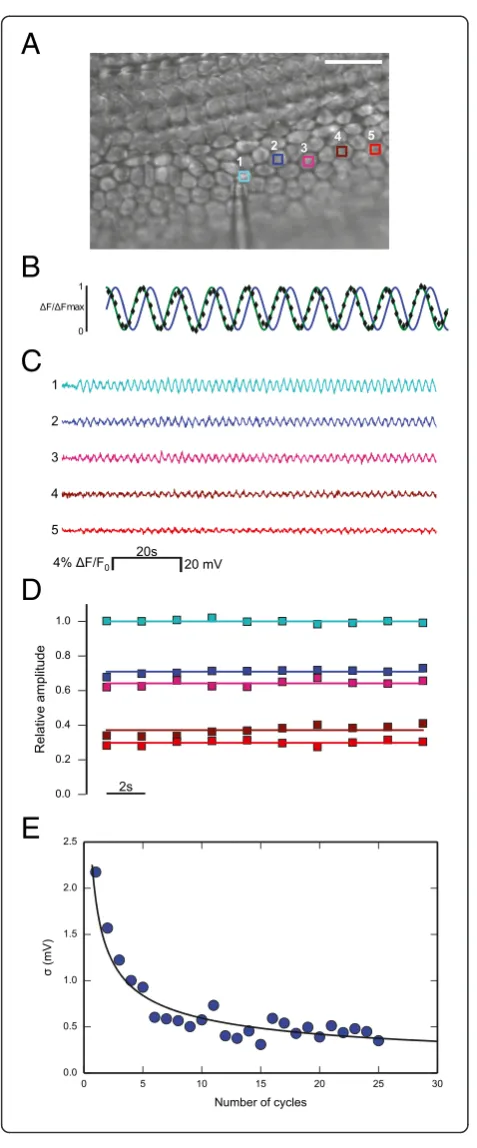
We loaded cochlear organotypic cultures from P5 mice with the Vf2.1.Cl dye and delivered a sinusoidal voltage command, also named carrier wave (frequency ν= 0.5 Hz, amplitude 35 mV) to the patch clamp amp-lifier connected to one cell of the network (cell 1, Figure 2A). In wild type cultures, this stimulation elic-ited instantly sinusoidal optical signals of Vf2.1.Cl fluor-escence at the frequencyνof the carrier wave (reference frequency) in virtually all cells of the network within the field of view (Additional file 1: Movie S1). We then used the off−line digital phase–sensitive detector (also known as lock–in amplifier) described in the Methods to extract Vf2.1.Cl signal amplitudeA(x,y) at each network location (x,y) at the reference frequency (Figure 2B). This method works because noise at frequencies other thanνis rejected and does not affect the measurement [27]. Throughout this article, relative amplitude refers to A(x,y)/A1 where A1 is signal amplitude at the reference frequency in the stimu-lated cell. At each point (x,y), relative amplitude values remained stable for tens of seconds during carrier wave de-livery to cell 1, but decreased rapidly with distance from this cell (Figure 2C and D). At the single pixel level, the standard deviation σ of the signal A(x,y) returned by the digital phase–sensitive detector scaled correctly as the square root of the number N of integration cycles (Figure 2E). Note thatσ≈2.2 mV atN= 1 andσ≈0.5 mV atN= 25; reaching sub–mV sensitivity requiredN≥5.
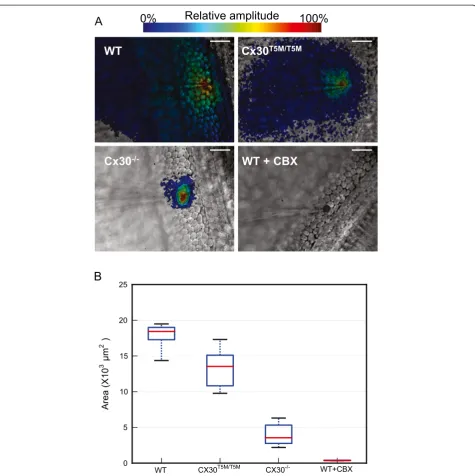
To estimate cell network extension, we computedA(x,y) by integrating Vf2.1.Cl signals over N= 5 carrier wave cy-cles (Figure 3). This approach permitted us to discriminate rapidly (10 s per recording) network connectivity of wild type cultures (Figure 3A, top left) from that of genetically modified connexin30T5M/T5M(top right) and connexin30−/− (bottom left) cultures [28]. Incubating wild type cultures for 20 minutes in 100μM CBX confined the Vf2.1.Cl signal to the stimulated cell (bottom right), indicative of junctional conductance (gj) collapse over the entire network.
Figure 1Calibration of Vf2.1.Cl voltage responses by paired patch clamp recordings in cochlear organotypic cultures. (A) Differential interference contrast (DIC) image showing two patch clamp pipettes, each one sealed to a non−sensory cell of the lesser epithelial ridge; scale bar, 25μm.(B)Representative traces showing simultaneous membrane potential (red) and Vf2.1.Cl fluorescence (blue) from cell 2, in the neighborhood of the stimulated cell (cell 1); the black trace (top) represents the waveform of the stimulus delivered by the patch clamp amplifier connected to cell 1.(C)Fractional fluorescence signal change (ΔF/F0) vs. membrane potential changeΔVm(both signals are from cell
For statistical comparison, we increased the precision of these steady–state measurements by integrating Vf2.1.Cl signals overN= 25 carrier wave cycles (50 s per record-ing) and measured the culture area where A(x,y) exceeded an arbitrary threshold value corresponding to 2σ ≈ 1.0 mV (suprathreshold area; pooled results are summarized in Figure 3B). Compared to wild type cul-tures, suprathreshold areas in connexin30T5M/T5M and connexin30−/− cultures were significantly shifted to-wards lower values (p= 0.03 andp= 0.006, respectively; Mann–Whitney U test; n= 5 cultures for each geno-type). In wild type cultures, the lower quartile, the me-dian, and upper quartile of suprathreshold area values were respectively: 17230, 18430, 18970 μm2; the corre-sponding values in connexin30T5M/T5M cultures were: 10730, 13550, 15100μm2; finally, in connexin30−/− cul-tures, they were: 2730, 3550, 5300μm2.
A simple resistive network model accounts for the spatial dependence of Vf2.1.Cl signals
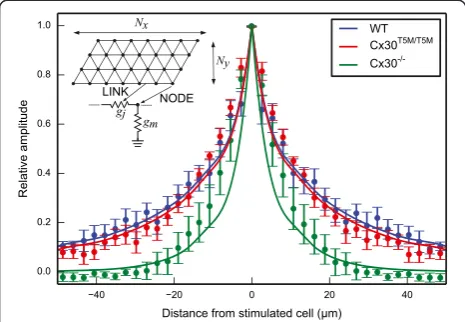
To gain further insight into the spatial dependence of the data shown in Figure 3, we modeled the cell network as a collection of nodes (individual non–sensory cells) forming an hexagonal mesh that reflects the anatomy [29]. In this model, nodes were coupled by resistive links with identical junctional conductancegj. Each node was also connected to ground by a resistor with conductancegmrepresenting cell membrane (Figure 4). We pooled data fromn= 5 cul-tures for each genotype at equal distances from the stimu-lated cell along the coiling axis of the cochlea and plotted the result versus this distance. Finally, we obtained least– square fits to these averaged data using the network model with gjas the only free parameter. The results were: gj= 206 nS for wild type, 177 nS for connexin30T5M/T5M and 19 nS for connexin30−/−cultures.
Application to network dynamics
In patho–physiological conditions, gap junction networks are dynamically regulated by a variety of mechanisms that
A
B
C
D
[image:4.595.56.295.82.657.2]E
Figure 2Illustrating phase–sensitive detection of Vf2.1.Cl fluorescence responses. (A)DIC image showing a single patch clamp pipette sealed to a non−sensory cell of the lesser epithelial ridge (cell 1, zero current potential−66 mV); scale bar, 25μm.(B)Black diamonds: normalized optical signals from a specific cell network location; green trace: unit amplitude carrier wave delivered to cell 1; blue trace: its phase–shifted counterpart used in the computation of signal amplitude (see Methods).(C)Calibrated optical responses from the five regions of interest (ROIs) shown in(A)during a typical stimulation protocol. A low order polynomial fit was subtracted to the raw traces to compensate for the effects of photobleaching (see Methods).(D)Relative amplitude signals derived by integrating traces shown in(C)over a single carrier wave cycle (N= 1).(E)The standard deviationσof the single pixel amplitude signalA(x,y) is plotted against the numberNof integration cycles (see Methods); the black solid line is a least square fit to the data with the functionσ1/N
½
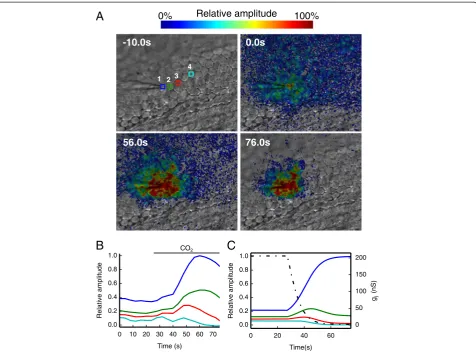
govern connexin channel permeability and gating [1,7,8,20,30]. Our next goal was to track dynamical changes in cell network connectivity by applying a digital phase–sensitive detector to Vf2.1.Cl signals. For this series of recordings, we limited time integration to N= 4 carrier wave cycles while transiently super-fusing cochlear cultures with an extracellular medium saturated with 100% CO2 to produce carbonic acid
[image:5.595.61.537.85.562.2](H2CO3). In its non−dissociated form H2CO3 is mem-brane permeable and causes a rapid and reversible clos-ure of gap junction channels [7,30]. This manipulation led to a reduction in the number of cells coupled to the stimulated cell, accompanied by a transient increase in Vf2.1.Cl fluorescence in the neighborhood of this cell (Figure 5A, B and Additional file 2: Movie S2). To mimic the time course of the events shown in Figure 5A, B, we
simply assumed that the gjof the network model repre-sented in Figure 4 undergoes a time−dependent exponen-tial decrease from 206 nS to 2 nS with a time constant of 7 s (Figure 5C).
Application to immortalized cell lines
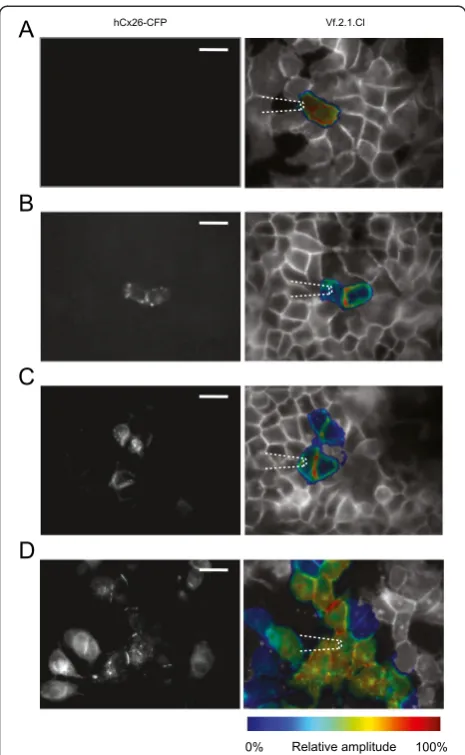
A number of gap junction communication studies are performed in expression systems and/or immortalized cell lines. To demonstrate the applicability of the method highlighted above to this important area of re-search, we used a clone of HeLa cells virtually devoid of connexins (see Methods) that were either left untreated (HeLa parental) or transiently transfected with a con-struct expressing human connexin26 fused in tandem with a cyan fluorescent protein (CFP) reporter (hCx26– CFP) [20]. These chimerical proteins localized to the plasma membrane at regions of contact between adja-cent cells and also formed distinct fluoresadja-cent puncta in the cytoplasm, as previously described [20,31,32]. Con-fluent HeLa cell cultures were loaded with the Vf2.1.Cl dye and subjected to the same patch–clamp protocol used in organotypic cochlear cultures. In HeLa parental cultures, the Vf2.1.Cl signal remained confined to the stimulated cell (Figure 6A). In transfected cultures, the Vf2.1.Cl signal displayed variable degrees of cell–to–cell spreading, reflecting the number of transfected cells
connected to the stimulated cell by hCx26–CFP gap junction channels (Figure 6B, C and D).
Discussion
We report here the application of the novel Vf2.1.Cl fluorescent sensor [18] to voltage imaging in cell net-works coupled by gap junction channels. We focused our attention on non−sensory cell networks of the devel-oping cochlea and used organotypic cultures from P5 mice as model system. Ourin situcalibration yielded an estimated responsivity of 23 ± 3 % ΔF/F0 per 100 mV change of the cell membrane potentialVm(Figure 1), in substantial agreement with measurements performed in HEK293 cells (26% per 100 mV) [18]. The limited dis-persion of the data in Figure 1C, which were acquired under different F0 conditions, indicates that the responsivity is fairly independent of the loading condi-tions. However,F0does affect the signal−to−noise ratio, which is ultimately dictated by fluctuations in the num-ber of collected photons (see, e.g. Ref. [26]), and conse-quently also the sensitivity of the measurement.
The Vf2.1.Cl signal tracks the membrane potential with no detectable delay [18], a highly desirable feature that dis-tinguishes this dye from the substantially slower voltage sensors based on fluorescent proteins. The use of these proteins is also hindered by the necessity of transfecting/ transducing target cells with a suitable expression vector [33]. In contrast, Vf2.1.Cl loads readily (15 min) and our use of a digital phase–sensitive detector (see Methods and Figure 2) allowed us to rapidly map cellular connectivity over vast network areas (Figures 3, 4, 5 and 6). With our methodology, the time required for data collection is a multiple of the carrier wave period (2 s in our conditions). Increasing the integration interval slows down the acquisi-tion (i.e. it reduces the temporal resoluacquisi-tion of dynamical measurements such as those presented in Figure 5) but re-duces fluctuations (Figure 2E) and thus increases both sensitivity and precision (defined as the degree to which repeated measurements under unchanged conditions show the same result).
[image:6.595.57.290.90.251.2]By integrating the Vf2.1.Cl signal overN= 5 carrier wave cycles (10 s), we detected intercellular connectivity down to (at least) 10thorder cells (i.e. to cells that were separated from the stimulated cells by a linear sequence of 10 adja-cent neighbors), in wild type cultures. For comparison, microinjection experiments with fluorescent tracers that permeate cochlear gap junction channels (e.g. calcein, a relatively large permeant tracer that barely fits into the pore of connexin26 channels [34]) require typically 4 mi-nutes to allow dye transfer to 3rd or 4thorder cells (e.g., see Supplementary Figure 6 of ref. [22]; an example of a microinjection experiment performed in this preparation with the widely used fluorescent tracer Lucifer Yellow is shown in Additional file 3: Movie S3). Comparable time
Figure 4Data fit by a simple resistive network model that reflects the anatomy.The inset shows model scheme. Simulations were performed using thengspicesoftware (http://ngspice. sourceforge.net).Nx= 45 andNy= 15 indicate the number of rows
and columns in the grid, respectively. Each node represents one cell and each link represents a resistive connection between adjacent nodes. The patch pipette connected to cell 1 was simulated as a variable voltage source connected to one node of the grid through an access resistanceRa= 7.8 MΩ(not shown). A single value for
membrane conductance (gm= 8.3 nS) and junctional conductance
(gj) were used throughout the network.gjwas left as the only free
intervals are necessary to assay gap junction commu-nication by fluorescence recovery after photobleaching (gap–FRAP) [35] (see, e.g. Figure 5 of ref. [36]).
The exact stoichiometry of cochlear gap junction channels in terms of connexin26 and connexin30 sub-units is not known. Single channel currents from HeLa cells overexpressing either connexin26 or connexin30 homomeric channels yielded respectively values of 115 pS and 160 pS for the unitary conductanceγ[20,32]. A study in HeLa cells co–transfected with the cDNA of both proteins, and thus presumably forming heteromeric/ heterotypic channels, reported γ values in a comparable range of 110–150 pS [37]. The junctional conductance gj= 206 nS we obtained by fitting wild type culture data in Figure 3 with the resistive network model of Figure 4 sug-gests that cochlear non−sensory cells are already well coupled at P5, by as many asNopen=gj/γ= 1300 to 1800 open channels per cell pair. An older study in isolated pairs of supporting cells of the adult guinea pig organ of
Corti reported that junctional conductance may exceed non−junctional conductance by three orders of magnitude and, at least in some cell pairs,gjwas as large as 1μS [38] corresponding toNopen~ 104. We are not aware of struc-tural investigations performed in the developing cochlea. However, Forge et al. [39] noted that gap junction plaques in the supporting cells of the mature cochlea are “ enor-mous” and they often occupy a major fraction of the plasma membrane between two adjacent cells (from 25% to almost 100% in pillar cells). From their freeze fracture studies, Forge et al. concluded that plaques containing about 104channels are not rare and some may even con-tain 105channels, such as those coupling inner pillar cells in the longitudinal direction. Thus ourgjestimate is not in contrast with the proposal that only about 10% of chan-nels within a plaque are in the open state [40-42].
Data in Figure 3 show a 27% and 80% reduction in the median suprathreshold area respectively for connexin30T5M/T5Mand connexin30−/−cultures relative to 0 10 20 30 40 50 60 70
Time (s)
0.0 0.2 0.4 0.6 0.8 1.0
Relative amplitude
CO2
0 20 40 60
Time(s)
0.0 0.2 0.4 0.6 0.8 1.0
Relative amplitude
0 50 100 150 200
j
g
(nS)
0.0s
76.0s 56.0s
-10.0s
1 2 3 4
A
B
C
100%
[image:7.595.60.537.88.441.2]0% Relative amplitude
Figure 5Effect of cell uncoupling by CO2. (A)Four selected frames from the same image sequence showing the progressive reduction of the
wild type cultures. Our resistive network model suggests that these reduced areas correspond to a gj decrease of 14% and 91% for connexin30T5M/T5M and connexin30−/− cultures, respectively. We previously reported massive down–regulation of connexin26 in the developing organ of Corti of connexin30−/− mice [36]. Connexin26 is similarly reduced, to 10% of the wild type level, in the cochlea of adult connexin30−/−mice. These findings complement and extend our prior work [28], which highlighted a significant reduc-tion in the level of dye coupling in connexin30T5M/T5M cul-tures, whereas dye coupling was absent in connexin30−/− cultures. We also showed that adult connexin30T5M/T5M mice, when probed by auditory brainstem recordings, ex-hibit a mild but significant increase in their hearing
thresholds, of about 15 dB at all frequencies [28]. By con-trast, connexin30−/− mice are profoundly deaf [28,43]. The present experiments and our previous work confirm coch-lear organotypic cultures as an attractive test ground to ex-plore the intricacies of connexin expression regulation and function. In addition, our findings support the notion that connexin30−/−mice are a model for humans in which large deletions in the DFNB1 locus lead to down–regulation of bothGJB6andGJB2and to profound deafness [13].
It is well known that electrical conductance and perme-ability to solutes other than small inorganic ions are not directly related [8,20,44]. Even the junctional permeability to fluorescent probes may not be directly related to elec-trical coupling [28,45]. We believe that the methodology described in the present article may help clarifying this complex relationship when used in combination with other complementary techniques, particularly those that (i) provide a direct estimate of the unitary permeability to signaling molecules [7] and (ii) aid data interpretation by the use of Molecular Dynamics [34].
Conclusions
Here we present a combined electrophysiological and op-tical approach to visualize rapidly and quantify connectiv-ity in cell networks coupled by gap junctions. Our digital phase–sensitive detector of Vf2.1.Cl fluorescence emission allows greater sensitivity and better time resolution com-pared to classical tracer–based techniques, and permitted us to track dynamically intercellular connectivity down to the 10thorder in non−sensory cell networks of the devel-oping cochlea. Despite the fact that the results shown here were obtained in specific cell models (cochlear non− sen-sory cells, HeLa cells) we believe that our method is of general interest and can be seamlessly extended to a var-iety of biological systems, as well as to other connexin− related disease conditions [10-12].
Methods
Reagents and drugs
Vf2.1.Cl [18] was provided by Roger Y. Tsien (University of California, San Diego). Carbenoxolone (CBX), pluronic F–127, Hanks’ balanced salt solutions (HBSS) and the salts used to prepare solutions were purchased from Sigma–Aldrich. Lipofectamine, Dulbecco’s modified Eagle’s medium (DMEM/F12) and fetal bovine serum (FBS) were purchased from Life Technologies. Cell Tak was pur-chased from Becton Dickinson.
Cochlear organotypic cultures
[image:8.595.57.290.87.465.2]Cochleae were dissected from P5 mouse pups in ice−cold Hepes buffered (10 mM, pH 7.2) HBSS, placed onto glass coverslips coated with 185 μg/ml of Cell Tak and incu-bated overnight at 37°C in DMEM/F12 supplemented with FBS 5%.
Figure 6Optical readout of network connectivity in HeLa cells loaded with Vf2.1.Cl. (A)HeLa parental cells.(B,C,D)Transiently transfected HeLa cells showing increasing amounts of
HeLa cells
A clone of HeLa cells essentially devoid of connexins was provided by Klaus Willecke (University of Bonn, Germany) and cultured according to standard proce-dures. Twenty four hours after plating, a lipofectamine transfection system was used to transiently transfect these communication–incompetent HeLa cells with hCx26–CFP, a previously described human connexin26 construct tagged with the cyan fluorescent protein (CFP) at its carboxyl terminal end [20].
Electrophysiology and fluorescence imaging
All experiments were performed at room temperature (22–25°C). Cochlear or HeLa cell cultures were trans-ferred to the stage of an upright wide–field fluorescence microscope (BX51, Olympus) and continually superfused with EXM, an extracellular medium containing (in mM): NaCl 138, KCl 5, CaCl2 2, NaH2PO4 0.3, KH2PO4 0.4, Hepes−NaOH 10, d−glucose 6 (pH 7.2, 300 mOsm). Glass capillaries for patch clamp recordings were formed on a vertical puller (PP–83, Narishige, Japan) from 1.5−mm outer diameter borosilicate glass (G85150T–4, Warner Instruments) and filled with an intracellular so-lution containing (in mM): KCl 134, NaCl 4, MgCl2 1, HEPES 20, EGTA 10 (adjusted to pH 7.3 with KOH, 290 mOsm) and filtered through 0.22 μm pores (Millipore). Pipette resistances were 3–4 MOhm when immersed in the EXM bath. For whole−cell (paired) patch clamp re-cordings, cell 1 was maintained under voltage clamp con-ditions with a patch clamp amplifier (Model 2400, AM Systems) while cell 2 was kept under current clamp condi-tions with a second amplifier (EPC−7, HeKa). Current and voltage were filtered at 3 kHz by an 8 pole Bessel filter and sampled at 20 kHz using a standard laboratory inter-face (Digidata 1440A, Molecular Devices) controlled by the PClamp 10 software (Molecular Devices).
To visualize hCx26–CFP, transfected HeLa cells were illuminated by light from a 385 nm LED (M385L2, Thorlabs) passing through a D390/70X filter (Chroma) and directed onto the sample through a 440 dclp dichro-matic mirror (Chroma) while CFP emission was selected by an ET480/40M filter (Chroma).
For voltage imaging, cochlear or HeLa cell cultures were incubated for 15 min at 37°C in EXM supplemented with Vf2.1.Cl (200 nM) and pluronic F–127 (0.1% w/v), thereafter cultures were continually superfused with EXM. Vf2.1.Cl fluorescence was excited by light from a 470 nm LED (M470L2, Thorlabs) passing through a BP460–480 filter (Olympus) and directed onto the sample through a 515 dcxr dichromatic mirror (Chroma) while Vf2.1.Cl fluorescence emission was selected by an ET535/30M fil-ter (Chroma). All fluorescence images were formed by a 60× water immersion objective (NA 1.0, Fluor, Nikon) and projected on a scientific–grade CCD camera (SensiCam;
PCO AG) controlled by software developed in the labora-tory. Image sequences of Vf2.1.Cl fluorescence were ac-quired continuously at 10 frames per second with 100 ms exposure time. To synchronize image acquisition and electrical recordings, we sampled the 5 V pulse (FVAL) that signals active exposure of the CCD camera [46]. Vf2.1.Cl signals were measured as relative changes of fluorescence emission intensity (ΔF/F0), where F0 is prestimulus fluorescence, Fis fluorescence at time t and ΔF=F–F0.
Miller et al. reported that Vf2.1.Cl and other PeT– based voltage indicators have a slower rate of bleaching and are less toxic than the FRET–based dyes [18]. We did not make a direct comparison between these two classes of indicators. However, in our hands patch clamp recordings from cochlear non–sensory cells in Vf2.1.Cl loaded cultures were stable for tens of minutes during continuous illumination with the LED used to excite dye’s fluorescence. In addition, we did not notice any vis-ible sign of cellular degeneration.
Image processing
Vf2.1.Cl fluorescence image sequences were stored on disk and processed off–line using the Matlab R2011a software package (The MathWorks, Inc.) as described hereafter. Following electrical stimulation of cell 1 with a carrier wave at frequency ν, each image was pre-processed by applying a 3–by–3 mean spatial filter to re-duce acquisition noise. To correct for photobleaching, we first estimated its time course by performing a low order polynomial fit to the (ΔF/F0)(t; x, y) data at each pixel location (x,y); the fitting functionP(t;x,y) was then subtracted from the (ΔF/F0)(t;x,y) signal, yielding an ef-fectively high–pass filtered trace
f tð;x;yÞ ¼ΔF tð;x;yÞ F0ðx;yÞ −
P tð;x;yÞ
The purpose of using a phase–sensitive detector is to extract the signal amplitude A(x,y) from the prepro-cessed single pixel signal
f tð;x;yÞ ¼A xð ;yÞcos 2ð πνt−θÞ
where θ is a constant phase delay [27]. We performed the extraction procedure in two steps:
Step 1: demodulation. f(t; x,y) was multiplied by two orthogonal reference signals
Vref1 ð Þ ¼t cos 2ð πνtÞ
(see Figure 2B) yielding two output signals of the form
f1ðt;x;yÞ ¼V1refð Þt ⋅f tð;x;yÞ ¼A xð ;yÞcos 2ð πνt−θÞcos 2ð πνtÞ f2ðt;x;yÞ¼V2refð Þt ⋅f tð;x;yÞ ¼A xð ;yÞcos 2ð πνt−θÞsin 2ð πνtÞ
Considering the trigonometric identities
cosð Þa cosð Þ ¼b 1
2½cosða−bÞ þ cosðaþbÞ cosð Þa sinð Þ ¼b 12½sinðaþbÞ−sinða−bÞ
the two output signals can be written as
f1ðt;x;yÞ ¼1
2A xð ;yÞ½cosð Þ þθ cos 2ð πð Þ2νt−θÞ
f2ðt;x;yÞ ¼1
2A xð ;yÞ½sin 2ð πð Þ2ν t−θÞ þ sinð Þθ
and are seen to consist of a DC signal proportional to the amplitudeA(x,y) of the original functionf(t; x,y) and a time–dependent component with frequency 2ν.
Step 2: Amplitude estimation. The time–dependent component was filtered out by time integration off1(t; x,y) and f2(t; x,y). In the absence of noise, integration over a single carrier wave cycle would yield the DC components off1(t; x,y) andf2(t; x,y):
a1ðx;yÞ ¼1
2A xð ;yÞcosð Þθ
a2ðx;yÞ¼12A xð ;yÞsinð Þθ
In practice, integration is better performed over a numberNof cycles to reduce contributions from various noise sources (see Figure 2E). Finally, the amplitude of f(t; x,y) was computed as
A xð ;yÞ ¼2
ffiffiffiffiffiffiffiffiffiffiffiffiffiffiffiffiffiffiffiffiffiffiffiffiffiffiffiffiffiffiffiffiffiffiffiffiffiffiffiffiffiffiffiffiffi
a1ðx;yÞ
½ 2þ
a2ðx;yÞ
½ 2
q
The reference level A(x,y) = 0 was set by applying the above algorithm to the pre–stimulus trace (i.e. to the trace segment that preceded cell 1 stimulation by the carrier wave).
Statistical analysis
Means are quoted ± standard error of the mean (s.e.m.) and p–values are indicated by letter p. Statistical com-parisons were made using the Mann–Whitney U test [47] andp< 0.05 was selected as the criterion for statis-tical significance.
Animal handling
Animal handling was approved by the Ethical Committee of Padua University (Comitato Etico di Ateneo per la Sperimentazione Animale, C.E.A.S.A.) project n. 54/2009, protocol n. 51731.
Additional files
Additional file 1: Movie S1.Effect of carrier wave stimulation. This video shows raw fluorescence signals from a P5 wild type cochlear organotypic culture loaded with Vf2.1.Cl; a patch pipette entering from
the left delivers a sinusoidal voltage stimulation at 0.5 Hz (carrier wave) to a cell maintained under whole–cell conditions.
Additional file 2: Movie S2.Effect of CO2application. This is the video sequence from which frames in Figure 5 were extracted. It shows processed fluorescence signals from a cochlear organotypic culture loaded with Vf2.1.Cl during application of CO2(see main text for details).
Additional file 3: Movie S3.Lucifer Yellow delivery via patch pipette to a non–sensory cell of the lesser epithelial ridge. This video sequence was captured from a P5 wild type cochlear organotypic culture while delivering Lucifer Yellow dissolved at a concentration of 225μM in the intracellular solution described in the Methods. Note that the patch pipette used for dye microinjection had the same physical characteristics (mouth diameter, electrical resistance) of those utilized for the delivery of the carrier wave signals of our digital phase–sensitive detector.
Abbreviations
VF:VoltageFluor;GJB2: Gene encoding gap junction beta–2 protein; GJB6: Gene encoding gap junction beta–6 protein; CBX: Carbenoxolone; CFP: Cyan fluorescent protein; FRAP: Fluorescence recovery after photobleaching; ROI(s): Region(s) of interest.
Competing interests
The authors declare that they have no competing interests.
Authors’contributions
FM and FC respectively designed and performed the experiments; FC analyzed data; FM wrote the paper. Both authors read and approved the final manuscript.
Acknowledgements
Supported by Telethon Italy grant GGP13114, MIUR PRIN grant n. 2009CCZSES and Fondazione CARIPARO 2010 Ph.D. fellowship grant No. PARO103433 to FM. We thank R.Y. Tsien for the generous gift of Vf2.1.Cl.
Author details
1Dipartimento di Fisica e Astronomia“G. Galilei”, Università di Padova,
Padova 35131, Italy.2Istituto Veneto di Medicina Molecolare, Fondazione per la Ricerca Biomedica Avanzata, Via G. Orus, 2, Padova 35129, Italy.3Istituto di Neuroscienze, Consiglio Nazionale delle Ricerche, Padova 35131, Italy.
Received: 30 August 2013 Accepted: 1 October 2013 Published: 21 October 2013
References
1. Goodenough DA, Paul DL:Gap junctions.Cold Spring Harb Perspect Biol 2009,1:a002576.
2. Bennett MV, Zukin RS:Electrical coupling and neuronal synchronization in the Mammalian brain.Neuron2004,41:495–511.
3. McCracken CB, Roberts DC:Neuronal gap junctions: expression, function, and implications for behavior.Int Rev Neurobiol2006,73:125–151. 4. Yu YC, He S, Chen S, Fu Y, Brown KN, Yao XH, Ma J, Gao KP, Sosinsky GE,
Huang K, Shi SH:Preferential electrical coupling regulates neocortical lineage-dependent microcircuit assembly.Nat2012,486:113–117. 5. Kirchhoff S, Nelles E, Hagendorff A, Kruger O, Traub O, Willecke K:Reduced
cardiac conduction velocity and predisposition to arrhythmias in connexin40-deficient mice.Curr Biol1998,8:299–302.
6. Jansen JA, van Veen TA, de Bakker JM, van Rijen HV:Cardiac connexins and impulse propagation.J Mol Cell Cardiol2010,48:76–82.
7. Hernandez VH, Bortolozzi M, Pertegato V, Beltramello M, Giarin M, Zaccolo M, Pantano S, Mammano F:Unitary permeability of gap junction channels to second messengers measured by FRET microscopy.Nat Methods2007,
4:353–358.
8. Harris AL:Connexin channel permeability to cytoplasmic molecules.Prog Biophys Mol Biol2007,94:120–143.
9. Wallraff A, Kohling R, Heinemann U, Theis M, Willecke K, Steinhauser C:The impact of astrocytic gap junctional coupling on potassium buffering in the hippocampus.J Neurosci2006,26:5438–5447.
11. Laird DW:Life cycle of connexins in health and disease.Biochem J2006,
394:527–543.
12. Dobrowolski R, Willecke K:Connexin-caused genetic diseases and corresponding mouse models.Antioxid Redox Signal2009,11:283–295. 13. del Castillo FJ, del Castillo I:The DFNB1 subtype of autosomal recessive
non-syndromic hearing impairment.Front Biosci2011,16:3252–3274. 14. Lautermann J, ten Cate WJ, Altenhoff P, Grummer R, Traub O, Frank H, Jahnke K, Winterhager E:Expression of the gap-junction connexins 26 and 30 in the rat cochlea.Cell Tissue Res1998,294:415–420.
15. Lautermann J, Frank HG, Jahnke K, Traub O, Winterhager E:Developmental expression patterns of connexin26 and−30 in the rat cochlea.Dev Genet 1999,25:306–311.
16. Cohen-Salmon M, del Castillo FJ, Petit C:Connexins Responsiblbe for Hereditary Deafness - The Tale Unfolds. InGap Junctions in Development and Disease.Edited by Winterhager E. Berlin: Springer-Verlag; 2005:111–134. 17. Hou M, Li Y, Paul DL:A novel, highly sensitive method for assessing gap
junctional coupling.J Neurosci Methods2013,220(1):18–23.
18. Miller EW, Lin JY, Frady EP, Steinbach PA, Kristan WB Jr, Tsien RY:Optically monitoring voltage in neurons by photo-induced electron transfer through molecular wires.Proc Natl Acad Sci USA2012,109:2114–2119. 19. Gale JE, Piazza V, Ciubotaru CD, Mammano F:A mechanism for sensing
noise damage in the inner ear.Curr Biol2004,14:526–529.
20. Beltramello M, Piazza V, Bukauskas FF, Pozzan T, Mammano F:Impaired permeability to Ins(1,4,5)P3in a mutant connexin underlies recessive
hereditary deafness.Nat Cell Biol2005,7:63–69.
21. Piazza V, Ciubotaru CD, Gale JE, Mammano F:Purinergic signalling and intercellular Ca2+wave propagation in the organ of Corti.Cell Calcium 2007,41:77–86.
22. Anselmi F, Hernandez VH, Crispino G, Seydel A, Ortolano S, Roper SD, Kessaris N, Richardson W, Rickheit G, Filippov MA,et al:ATP release through connexin hemichannels and gap junction transfer of second messengers propagate Ca2+signals across the inner ear.Proc Natl Acad Sci USA2008,105:18770–18775.
23. Majumder P, Crispino G, Rodriguez L, Ciubotaru CD, Anselmi F, Piazza V, Bortolozzi M, Mammano F:ATP-mediated cell–cell signaling in the organ of Corti: the role of connexin channels.Purinergic Signal2010,6:167–187. 24. Mammano F:ATP-dependent intercellular Ca2+signaling in the
developing cochlea: Facts, fantasies and perspectives.Semin Cell Dev Biol 2013,24:31–39.
25. Verselis VK, Srinivas M:Connexin channel modulators and their mechanisms of action.Neuropharmacology2013. Available online 15 April 2013, In Press, http://dx.doi.org/10.1016/j.neuropharm.2013.03.020. 26. Davies R, Graham J, Canepari M:Light sources and cameras for standard
in vitro membrane potential and high-speed ion imaging.J Microsc2013,
251:5–13.
27. Cova S, Longoni A, Freitas I:Versatile digital lock-in detection technique: application to spectrofluorometry and other fields.Rev Sci Instrum1979,
50:296.
28. Schutz M, Scimemi P, Majumder P, De Siati RD, Crispino G, Rodriguez L, Bortolozzi M, Santarelli R, Seydel A, Sonntag S,et al:The human deafness-associated connexin 30 T5M mutation causes mild hearing loss and reduces biochemical coupling among cochlear non-sensory cells in knock-in mice.Hum Mol Genet2010,19:4759–4773.
29. Lagostena L, Cicuttin A, Inda J, Kachar B, Mammano F:Frequency dependence of electrical coupling in Deiters' cells of the guinea pig cochlea.Cell Commun Adhes2001,8:393–399.
30. Bukauskas FF, Verselis VK:Gap junction channel gating.Biochim Biophys Acta2004,1662:42–60.
31. Beltramello M, Bicego M, Piazza V, Ciubotaru CD, Mammano F, D'Andrea P:
Permeability and gating properties of human connexins 26 and 30 expressed in HeLa cells.Biochem Biophys Res Commun2003,305:1024–1033. 32. Bicego M, Beltramello M, Melchionda S, Carella M, Piazza V, Zelante L, Bukauskas FF, Arslan E, Cama E, Pantano S,et al:Pathogenetic role of the deafness-related M34T mutation of Cx26.Hum Mol Genet2006,15:2569–2587.
33. Jin L, Han Z, Platisa J, Wooltorton JR, Cohen LB, Pieribone VA:Single action potentials and subthreshold electrical events imaged in neurons with a fluorescent protein voltage probe.Neuron2012,75:779–785.
34. Zonta F, Polles G, Sanasi MF, Bortolozzi M, Mammano F:The 3.5 angstrom X-ray structure of the human connexin26 gap junction channel is unlikely that of a fully open channel.Cell Commun Signal2013,11:15.
35. Wade MH, Trosko JE, Schindler M:A fluorescence photobleaching assay of gap junction-mediated communication between human cells.Sci1986,
232:525–528.
36. Ortolano S, Di Pasquale G, Crispino G, Anselmi F, Mammano F, Chiorini JA:
Coordinated control of connexin 26 and connexin 30 at the regulatory and functional level in the inner ear.Proc Natl Acad Sci USA2008,
105:18776–18781.
37. Yum SW, Zhang J, Valiunas V, Kanaporis G, Brink PR, White TW, Scherer SS:
Human connexin26 and connexin30 form functional heteromeric and heterotypic channels.Am J Physiol Cell Physiol2007,293:C1032–1048. 38. Santos-Sacchi J:Isolated supporting cells from the organ of Corti: some
whole cell electrical characteristics and estimates of gap junctional conductance.Hear Res1991,52:89–98.
39. Forge A, Becker D, Casalotti S, Edwards J, Marziano N, Nevill G:Gap junctions in the inner ear: comparison of distribution patterns in different vertebrates and assessement of connexin composition in mammals.J Comp Neurol2003,467:207–231.
40. Bukauskas FF, Jordan K, Bukauskiene A, Bennett MV, Lampe PD, Laird DW, Verselis VK:Clustering of connexin 43-enhanced green fluorescent protein gap junction channels and functional coupling in living cells.
Proc Natl Acad Sci USA2000,97:2556–2561.
41. Palacios-Prado N, Sonntag S, Skeberdis VA, Willecke K, Bukauskas FF:Gating, permselectivity and pH-dependent modulation of channels formed by connexin57, a major connexin of horizontal cells in the mouse retina.
J Physiol2009,587:3251–3269.
42. Palacios-Prado N, Briggs SW, Skeberdis VA, Pranevicius M, Bennett MV, Bukauskas FF:pH-dependent modulation of voltage gating in connexin45 homotypic and connexin45/connexin43 heterotypic gap junctions.Proc Natl Acad Sci USA2010,107:9897–9902.
43. Teubner B, Michel V, Pesch J, Lautermann J, Cohen-Salmon M, Sohl G, Jahnke K, Winterhager E, Herberhold C, Hardelin JP,et al:Connexin30 (Gjb6)-deficiency causes severe hearing impairment and lack of endocochlear potential.Hum Mol Genet2003,12:13–21.
44. Goldberg GS, Lampe PD, Nicholson BJ:Selective transfer of endogenous metabolites through gap junctions composed of different connexins.
Nat Cell Biol1999,1:457–459.
45. Ek-Vitorin JF, King TJ, Heyman NS, Lampe PD, Burt JM:Selectivity of connexin 43 channels is regulated through protein kinase C-dependent phosphorylation.Circ Res2006,98:1498–1505.
46. Mammano F, Canepari M, Capello G, Ijaduola RB, Cunei A, Ying L, Fratnik F, Colavita A:An optical recording system based on a fast CCD sensor for biological imaging.Cell Calcium1999,25:115–123.
47. Mann HB, Whitney DR:On a Test of Whether one of Two Random Variables is Stochastically Larger than the Other.Ann Math Stat1947,
18:50–60.
doi:10.1186/1478-811X-11-78
Cite this article as:Ceriani and Mammano:A rapid and sensitive assay of intercellular coupling by voltage imaging of gap junction networks.Cell
Communication and Signaling201311:78.
Submit your next manuscript to BioMed Central and take full advantage of:
• Convenient online submission
• Thorough peer review
• No space constraints or color figure charges
• Immediate publication on acceptance
• Inclusion in PubMed, CAS, Scopus and Google Scholar
• Research which is freely available for redistribution