LED-based Indoor Positioning System using Novel Optical Pixelation Technique
Olaoluwa R. Popoola
1, Sinan Sinanovi´c
1, Roberto Ramirez-Iniguez
1, and Wasiu O. Popoola
2 1School of Engineering and Built Environment, Glasgow Caledonian University, Glasgow, G4 0BA, UKE-mail: [email protected]
2Institute for Digital Communications, University of Edinburgh, Edinburgh, EH9 3JL, UK
Published in Healthcare Technology Letters; Received on xxx; Revised on xxx.
At present, about 47 million people worldwide have Alzheimer’s disease (AD), and because there is no treatment currently available to cure AD, people with AD (PWAD) are cared for. The estimated cost of care for PWAD in 2016 alone is about $236billion which puts a huge burden on relatives of PWAD. This letter aims to reduce this burden by proposing an inexpensive indoor positioning system (IPS) that can be used to monitor PWAD. For the positioning, freeform lenses are used to enable a novel optically pixeled LED luminaire (OPLL) that focusses beams from LEDs to various parts of a room, thereby creating uniquely identifiable regions which are used to improve positioning accuracy. Monte-Carlo simulation with the designed OPLL in a room with dimensions5m×5m×3m is used to compute the positioning error and theoretical analysis and experiments are used to validate the time for positioning. Results show that by appropriate LED beam design, OPLL has a positioning error and time for positioning of0.735m and187ms which is55.1%lower and1.2times faster than existing Multiple LED estimation model (MLEM) proximity systems.
1. Introduction: Indoor positioning involves the identification of the position of a mobile receiver based on the position of a fixed transmitter in an enclosed space. It allows the real-time monitoring of the location of a mobile device attached to a person or an object in an indoor location. An indoor positioning system (IPS) finds application in areas such as medicine, robotic navigation, security in large buildings, direction in retail stores, emergency rescue and self-guiding drones in an indoor location [1].
The motivation for the development of the IPS is in its application for monitoring people with Alzheimer’s disease or people with some other form of cognitive disability. The justification behind the motivation is subsequently explained. According to [2], there are expected to be nearly a million new cases of Alzheimer’s Disease (AD) every year by 2050. Between 2000 and 2013, deaths resulting from prostrate cancer, heart disease, and stroke decreased by11%, 14%, and23%respectively, whereas deaths from AD increased by71%[3]. The alarming prevalence of AD and the absence of any effective treatment has made AD a major issue, highlighted as a priority by the G8 nations [4]. This absence of effective treatments makes caring a viable way of assisting people with AD. However, with an estimate of $236billion in 2016 alone, the cost of Alzheimer’s care may place a substantial financial burden on families [3].
In the absence of effective medical treatments, an indoor positioning system (IPS) is designed in this letter for the monitoring and assisting with diagnosis and non-drug treatment of persons with Alzheimer’s disease (PWAD). The rationale behind this approach as a treatment method for AD is based on the following recent medical findings:
1 [5, 6] suggested that physical activities delay the decline in cognitive function of PWAD or those who are at risk of AD. Therefore, an IPS which monitors a person physical activity and prompts movement at regular intervals will assist in delaying decline of cognitive functions.
2 The developed IPS monitors movement profiles of PWAD and, [7] has shown that the walking speed is a reliable parameter to use with diagnosing PWAD. Slow, discontinuous and irregular movement profiles have also been suggested as parameters that indicates episodes of dementia [8].
3 A reliable IPS would enable remote monitoring of PWAD. This is especially useful for early stages of dementia and will reduce the cost of Alzheimer’s care by reducing the frequency that care assistants are required to monitor the PWAD.
Major investigations in IPS have considered indoor positioning using either radio frequency (RF) based devices or optical devices [9, 10]. While RF based devices use the radio frequency region of the electromagnetic wave spectrum, optical devices use optical wireless communications (OWC) [11, 12]. Due to the risk of interference of RF devices with other medical devices worn by a person with AD, OWC based IPS is selected as the more appropriate technology for monitoring PWAD. Existing OWC based indoor localization identifies positions by cameras or the use of algorithms such as received signal strength (RSS), time of arrival (ToA), angle of arrival (AoA), fingerprinting or proximity methods [9, 11, 13, 14]. Although some of these systems have shown very low positioning error, their designs cannot work for PWAD because of the following reasons. First, systems that use video camera [14] do not appeal to PWAD because they value their privacy and no one is comfortable being under video surveillance all the time. Secondly, other systems [9, 11, 13] use experimental set-up which require oscilloscopes, data generators and other instruments for the receiver design. These instruments are required because of the complex positioning algorithms proposed for low positioning error. While such systems are useful for robotic navigation and similar purposes where the size and weight of the receiver do not matter, receiver size and weight are crucial when monitoring PWAD. For PWAD, the positioning system must accommodate a receiver which is compact in size, wearable, lightweight and low-powered.
Conventional proximity IPSs, which directly determines position based on the optical signal received [11], provide a simple algorithm that can be deployed to a wearable receiver but they have a high positioning error which make them also unsuitable for monitoring PWAD. Positioning accuracy using proximity method is restricted to the beamwidth of the LED luminaire. Beamwidth is the diameter of the circular region covered by the beam of an LED on a horizontal plane. In [12], an overlap method called the multiple LED estimation model (MLEM) is proposed to improve the accuracy of positioning using the proximity method. Using MLEM, the accuracy of positioning is increased by increasing the number of LEDs in a room. But, due to limitations in building design and/or impractical re-installation of lighting infrastructure, the number of LEDs used in an indoor location is limited and so is the accuracy.
Most works on the design of optics based IPS have been based on the optical signal [13, 15]. To the best knowledge of the authors it is shown for the first time that the careful design of luminaires
can greatly reduce the positioning error of a proximity-based IPS with as little as just two lighting points. Since the average shoulder breadth of humans is between0.45and0.6m [16], this work aims design an IPS with sub-metre error in positioning when a typical room of dimensions5m×5m×3m is considered. The main contributions of this work can be summarized as follows:
1 We present a novel optically pixeled LED luminaires (OPLL) design for indoor positioning of PWAD and show that for a room with just two luminaires, the positioning error could be halved by integrating OPLL into existing fittings in a building. 2 We present a practical electronic model for the implementation
of the non-invasive OPLL system, developed a prototype of the lightweight (mass:14g), wearable (dimensions:4.9cm×2.5 cm×1.3cm) receiver and study the time required to acquire position.
The rest of the letter is organized as follows: the system model is developed in Section 2 and in Section 3 the optical system design for OPLL system is discussed. System performance and results are presented in Section 4 and finally, in Section 5 conclusions are presented.
[image:2.595.310.492.130.218.2]2. Description of Optical Pixelation: Freeform LED lenses have been designed to produce uniform illumination with over 90% of light energy in the desired beam pattern [17]. Designs for rectangular and circular beam patterns have been optimized to produce increased uniformity of light beams from LEDs [17]. Instead of using a single freeform lens to provide uniform illumination in a room, for positioning purposes, the application in this work focusses the beam from a LED to a part of a room. This uniformly illuminated part is called a pixel and the design of a luminaire with multiple lenses and hence multiple pixels is called optical pixelation. Optical pixelation takes advantage of the recent development in freeform lenses such as the dielectric totally internally reflecting concentrators (DTIRC) developed in [18] to improve the accuracy of MLEM indoor positioning by increasing the resolution of LED luminaires. DTIRC lenses constrain the output of a source of light thereby making it possible to direct light from a LED source to a particular area in a room. In MLEM, beam overlap reduces positioning error and it is shown that as the number of transmitting LEDs increases, the positioning error is further reduced. Using conventional LED luminaires, more electrical fittings are required to increase the number of LEDs in order to increase the positioning accuracy. With pixelation, the existing household fittings can be maintained but more LED transmitters can be added to a luminaire. These LEDs are programmed with unique LED identification data (ID) so that each LED identifies a unique position. An illustration of optical pixelation is presented in Fig. 1. The area where the footprint of LEDs overlap is called the overlap region. If only two LED footprints overlap, it is called a 2-overlap region (regionain Fig. 1), if three LEDs overlap, it is called a three overlap region (regionbin Fig. 1) and where four LEDs footprints all overlap, we call this a 4 overlap region as illustrated in region cof Fig. 1. Three types of proximity positioning systems that are considered in this work are conventional proximity systems (CPS), conventional LED luminaires (CLL) in MLEM configuration and the novel OPLL. In the illustration of Fig. 1, CLL in MLEM configuration are shown in sideBof the room while OPLL are shown in sideAof the room. On sideB, each luminaire transmits an optical signal with each LED in the luminaire sending the same data. Although some CLLs use multiple LEDs for lighting, all the LEDs in such a luminaire are connected to the same source and every LED in the luminaire transmits the same LED data or ID and hence can be considered as a single source. Two of these CLLs used in sideBof the room identify3unique locations by the use of MLEM based overlaps. On sideA, for simplicity, each luminaire in an OPLL is assumed to carry four uniquely programmed LEDs. By
Figure 1An illustration comparing an optically pixeled LED luminaire on
sideAwith a conventional LED luminaire on sideB
optical engineering techniques and the use of DTIRC lenses, each LED is specifically directed to an area in the room which gives8 pixels. Taking advantage of the benefits of overlap in MLEM IPS, each luminaire in OPLL is able to identify13locations as shown in sideAof Fig. 1. Intuitively, by increasing the number of uniquely identifiable locations, the positioning accuracy is increased. In Section 3, the design of OPLL is explained to show the internal operation of the proposed device.
3. Design of Optical Pixeled LED Luminaires: For positioning applications, the design of OPLL is considered in three subsections. First, the optical system design of the luminaire, next is the communication system design and finally the electronic modules for the transmission of positioning data without corruption in the presence of noise or interference from data from other LEDs.
3.1. Optical system design: In this section, the design of an optical luminaire which satisfies the purposes of optical pixelation is described. Consider the construction of a 4-LED OPLL. The system requires a 4-LED electronic panel and 4 freeform lenses to direct each LED beam to a particular region on a desired horizontal plane at a heighthfrom the transmitter plane. To achieve this goal, each LED is tilted away from the center of the luminaire so that its beam is focussed to a desired point on the horizontal plane. In order to design the luminaire to meet the desired condition between the interaction of the footprint of LED beams and formation of regions for positioning, each LED has to be tilted. The degree of tilt moves the zero angular displacement of the LED from point(x0, y0)to a point(x1, y1)where(x1, y1)is the desired point of the center of a beam. Consequently, the angle of tilt depends on the desired region of LED beam coverage as indicated by(x1, y1)and can be measured as:
θ= tan−1
p
(x1−x0)2+ (y1−y0)2 h
! (1)
wherehis the vertical distance between a transmitting LED and the receiver’s horizontal plane.
involves redesigning electrical house wiring and installation of new facilities which will make the IPS unnecessarily expensive. In order to make both intra-Lum and inter-Lum communications work seamlessly together, designs for packet transmission protocols to blend PDM and TDM so as to achieve reduced collisions and minimal positioning time are subsequently investigated.
All packets from individual LEDs in a particular luminaire are encapsulated in a luminaire level packet. A design for packet transmission is illustrated in Fig. 2. In Fig. 2 Lum1 and Lum2
denotes two luminaires. The TDM based time scheduling of four LEDs includes the time to transmit the packet from each LED and the guard time interval. If the TDM time for LED packets in Lum1
istp1and in Lum2istp2, and the time between the consecutive
transmissions of two packets from any LED in Lum1and Lum2is td1andtd2respectively, then the transmission duty cycleDifor the ith luminaire Lumican be written as:
Di=tpi
tyi (2)
where i= 1 for Lum1 and i= 2 for Lum2 and tyi is the
transmission cycle time for Lumiis which is expressed as:
tyi=tpi+tdi (3)
wheretdiis a randomly selected integer between0andtyi.
Lum1
Lum2
ty1
PDM
tp1
tp2 ty2
LED2 LED3
LED4
LED1
TDM
guard time
[image:3.595.313.475.128.269.2]td2
Figure 2An illustration of PDM and TDM for packet transmission in OPLL
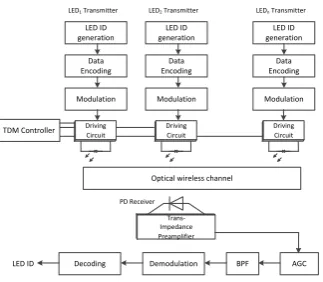
3.3. Electronic system design: The electronic system design architecture of an OPLL is shown in Fig. 3 which illustrates the process of implementing TDM in an OPLL. In Fig. 3, a TDM controller is used to give communication priority to one of the LEDs say LED1, then LED2until it gets to the last LED say LEDn
wherenis4for the investigation in this letter. For each of the LED transmitters in an OPLL, the first process is the LED ID generation. Unique LED codes are generated in this stage to allow each LED to identify a unique position. Although a guard time is used to allow TDM to separate signals from individual LEDs, LED ID generation ensures there is a degree of separation between each ID so as to make room for data correction. Data encoding encapsulates the LED IDs for frame synchronization and then the encapsulated data is encoded using either pulse width encoding, Manchester coding, pulse distance encoding or pulse position modulation as described in [19]. On-off keying modulation modulates the signal to a high frequency (38 kHz) in order to improve its noise resilience and separate it from similar sources modulated at different frequencies [20]. The driving circuit is used to amplify the data current from the microcontroller so that it is sufficient to drive the LEDs [21]. In order to control the output of the LEDs for TDM, the drive current is set high or low depending on whether that LED is to transmit data or not. The receiver system is a photodetector with a trans-impedance amplifier and an automatic gain control (AGC) which is used to ensure the modulated signals are received correctly for a wide range of received signal powers. The bandpass filter (BPF) stops unmodulated optical signals which include ambient light and unmodulated fluorescent/LED sources. The signal is then demodulated and decoded to extract the LED IDs. Although the architecture in Fig. 3 illustrates one receiver, this system can be used for an IPS with multiple receivers where other receivers have the
PD Receiver
Optical wireless channel LED ID
generation
Data Encoding
Modulation
Driving Circuit LED1 Transmitter
LED ID generation
Data Encoding
Modulation
Driving Circuit LED2 Transmitter
LED ID generation
Data Encoding
Modulation
Driving Circuit LEDn Transmitter
TDM Controller
Trans-Impedance Preamplifier
Decoding Demodulation BPF AGC
LED ID
Figure 3Electronic modules for TDM based optical system design within a single luminaire. ID: Identity, AGC: Automatic gain control and BPF: Band pass filter
same architecture as that shown in Fig. 3. This allows for seamless increase in the number of receivers to be tracked by the IPS.
4. Simulation, Results and Discussions: In this section, the simulation procedure used to determine the performance of OPLL systems are explained and then results to show the performance of OPLL using MATLABrsoftware are presented. Performance is measured in terms of positioning error and positioning time. To compare with existing IPS, the performance of OPLL is compared to the performance of conventional proximity based IPS and the recently designed MLEM system.
4.1. Performance of OPLL based on positioning error: To measure positioning error, the IPS is placed in a room5m×5m×3m. For the transmitter, two luminaires are assumed to be available at points(1.25,2.5)m and(3.25,2.5)m with respect to bottom left corner of the ceiling of the room. Whenever the receiver is in a region of a LED beam, the coordinates of the LED are assigned to the receiver. In order to measure the positioning error,500000 uniformly distributed random positions are taken for the receiver and these positions are decoded based on the three positioning systems that are considered for this work. In the conventional proximity based positioning, the two transmitters send out the same LED ID so that the receiver is assumed to be at the center of the room. For example no matter where the receiver is, when positioning data is received, conventional proximity positioning assigns the receiver location as the center of the room. For MLEM, by the use of overlap with the same two lighting points, three decoding positions are made possible. The first is when the receiver is in a region of the first LED, the second is when the receiver is in the region of the second LED and the third region is when both LEDs overlap. If the receiver is in the region of coverage of any of the LEDs, then, the coordinates of that LED are assigned to the receiver. But, if the receiver is in a region of overlap between two LED luminaires the midpoint of the coordinates of both LEDs is the assigned position of the receiver. In OPLL each lighting point maps to four regions in the room and by the use of overlaps, this maps up to26points depending on the level of overlap. When the receiver receives data from an LED the midpoint of the beam from this LED is used as the assigned location of the receiver. For the three IPS, error is measured by computing the distance between the true coordinate of a receiver and the assigned coordinate by the positioning algorithm. Therefore, the positioning errorecan be
[image:3.595.97.293.181.405.2]written as:
e= 1
N N X
k=1
p
(xl−xk)2+ (yl−yk)2 (4)
where the number of iterations used for this simulation isN= 500000, (xk, yk) is the true coordinate of the receiver at the kth iteration and (xl, yl), which is the midpoint of the LED
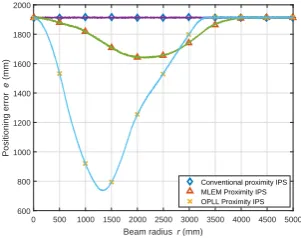
beam(s) where the receiver is located, is the assigned coordinate. Simulations are taken for different beam radiusrwhich is half the beamwidth on a horizontal plane at a vertical distancehfrom the transmitter. By computing the value ofeas the beam radius for the three systems is increased from0to5m, the measured positioning error is presented in Fig. 4.
It is observed from Fig. 4 that as the beam radius approaches0 all three systems behave similarly since the LEDs can be said to be almost off and the receiver is only known to be in the room (at the center). However, as the beam radius increases, the positioning error of MLEM and OPLL proximity IPS falls. Conventional positioning systems show a constant positioning error at about1.9m. At beam
0 500 1000 1500 2000 2500 3000 3500 4000 4500 5000
Beam radius r (mm) 600
800 1000 1200 1400 1600 1800 2000
Positioning error
e
(mm)
[image:4.595.113.264.304.423.2]Conventional proximity IPS MLEM Proximity IPS OPLL Proximity IPS
Figure 4 Positioning errorefor conventional proximity IPS, MLEM
proximity IPS and OPLL proximity IPS as the beam radiusris increased
from0to5000mm
radiusrmof2.14m, MLEM system shows a minimum positioning
error of 1.637m. However, the OPLL system shows an error of about0.735m when the beam radiusrois1.33m. As the
beam radius is further increased towards5m, all three systems behave similarly since all beams overlap with themselves and the receiver determines its location largely as the center of the room when this happens. Therefore, by appropriately designing the beam radius, the OPLL system shows a great reduction in positioning error compared to MLEM and conventional proximity IPS. With the average shoulder breadth of humans between0.45and0.6m [16], the OPLL system proves very accurate for human positioning. If OPLL is designed to include more uniquely identified LEDs, the error in this system can be further reduced. For instance, using OPLL in a system of 4 luminaires with 128 LEDs each the positioning error reduces to 3.8 cm. In the next section, the performance of the OPLL system in terms of positioning time is presented.
4.2. Performance of OPLL based on positioning time: The performance of OPLL in terms of positioning time is dependent on the number of overlaps and on the area covered by the overlap region. Two forms of overlap region that are possible are overlap based on TDM and overlap based on PDM. The positioning time for TDM-based overlap is deterministic since the intra-Lum probability of collision is zero in a TDM-based system. However, inter-Lum PDM-based overlap is probabilistic and this probability affects the positioning time. The level of PDM-based overlap is determined by the beam radius. For very small beam radius, there are no
overlaps and at very large radius, the beam from every LED in both luminaires overlap and the system behaves like a point source as seen in the conventional proximity IPS illustrated in Fig. 4. For analysis in this section, the beam radius with the lowest positioning error is used to estimate positioning time. The levels of overlap at this beam radius are illustrated by the shaded regions in Fig. 5. In Fig. 5, each of the numbers(11,12,13,14,21,22,23,24)can be generalized asijwhich represents the footprint of thejth LED in theith luminaire Lumiand from the illustration in Fig. 5, the
following deductions are made to compute the positioning time.
•No packet collisions in overlap areas from LEDs of the same luminaire. Therefore positioning time in overlap regions between 11and12,12and13,13and14,14and11(same applies to Lum2) does not depend on collision.
•Packet collisions occur in overlap areas from LEDs of different luminaires. Therefore positioning time in overlap regions between11and21,12and21,12and22,14and24,13and 24,13and23depends on collision.
•Maximum number of LED footprints that overlap at any given time is two. Fig. 4 shows overlap between 11,12 and21, geometrically, three LEDs overlap in this region. However, since TDM prevents intra-Lum collision between11and12, so that both LEDs cannot be on at any given time, collision can only occur between11and21or12and21.
The average positioning time is computed by considering the positioning time in regions where collision cannot occur, the positioning time in regions where collisions can occur and weighting them by their areas. When no collisions can occur, the positioning time is computed for a receiver in either a no overlap region, or a TDM based overlap region. In a region of one LED beam with no overlaps, position is known when a packet from that LED is received and, in a region with two overlapping LED beams, position is known when packets from both LEDs are received. However, since the receiver can be in either a single overlap, or double overlap or more than two overlap region (for future designs), the position is determined when packets from an LED is received twice. For MLEM systems, by PDM, the positioning time when no collision can occurtnmvaries betweentyi+tpiand2tyi.
By taking the average,tnmis estimated as:
tnm=3tyi+tpi
2 (5)
wheretyiis the cycle time andtpiis the duration of packets from
LEDs in Lumi. Applying the same argument for OPLL systems, the
positioning time when no collision occurstnocan be written as:
tno=tyi+tpi+tg (6)
wheretgis the guard time. But for CPS, because all luminaires
and LEDs transmit the same data, the positioning time when no collisions can occurtnpis expressed as:
tnp=tpi+tg. (7)
When collision can occur, the positioning time is based on the probability of collision. The probability of collision for two overlaps for the PDM scheme is given in [12] as:
Pc= 2D, D≤0.5 (8)
where D is the duty cycle as described in (2) and it is less than0.5to prevent perpetual collisions between packets from the two luminaires. The probability of no collision isPnc= 1−2D.
Therefore, in regions where collision can occur the positioning time can be written as:
tc=tnPnc+tccPc (9)
wheretnis the positioning time in collision possible regions when
-1000 0 1000 2000 3000 4000 5000 6000 horizontal x-plane (mm)
-1000 0 1000 2000 3000 4000 5000 6000
horizontal y-plane (mm)
Room walls Luminaire installation points LED beams center
11 12 21 22
[image:5.595.100.255.129.279.2]14 13 24 23
Figure 5Illustration of levels of overlap at beam radius with lowest
positioning error with shaded region showing PDM based overlap.ij: the
footprint of thejth LED in Lumi
possible regions when collisions actually occur. For MLEM,tn= tnm, for OPLLtn=tno, and for CPStn=tnp. To give a realistic
estimate of the positioning time when collision can occur, an estimate for the number of cycles required to guarantee a99.99% chance of no collision is used. Given the probability of collision
Pc= 2D, the probability that collision occurs in allncycles is
(2D)n. To guarantee a99.99%chance that collisions do not occur
in one of thencycles, we can writen=log(1−0.9999)
log(2D) . Therefore
when collision occur the time required to know positioning with 99.99%certainty istcc=ntn. By substituting the value ofDfrom
(2) andtccinto (9), the positioning time in a region where collision
can occurtccan therefore be written as:
tc=tn
1−2tpi
tyi+ 2n tpi tyi
. (10)
To compute the weighting areas, we use the area of overlap for two overlapping circles given in [19] as:
Ao= 2
2r2cos−1 d
2r− d
2 p
4r2−d2
(11)
wheredis the distance between the centers of overlapping beams from inter-Lum packets. For MLEM system with one overlap region Acm=Ao and for OPLL system with two overlapping
regions,Aco= 2Ao. IfAcis the area of the room where overlap
collisions occur, such thatAc=Acmfor MLEM,Ac=Acofor
OPLL andAc= 0for CPS (because there are no collisions in this
system), the area of no overlap collisionsAncan be estimated as At−Ac.Atis the total area of the room which is25m2for the
dimensions under consideration. By taking weighted averages, the average positioning timetpis therefore written as:
tp=An Attn+
Ac
Attc (12)
where all variables are as previously defined. For simulations we seti= 1for Lum1andi= 2for Lum2and the values of variables
used for simulations are presented in Table 1.
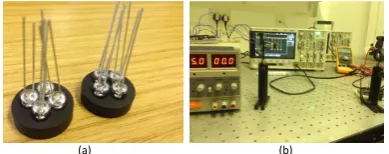
[image:5.595.309.511.130.220.2]4.3. Experimental proof of concept: Results of simulations and experiments measuring the positioning times for all three systems under consideration are presented in Fig. 7. As a proof of the OPLL concept, an OPLL frame which directs LED signals to specific parts of the room is fabricated (Fig. 6a) and an experiment is setup as shown in Fig. 6b to determine the positioning time of the OPLL
Table 1Values of variables for simulation
Variable Value Notes
tpi=tp1=tp2 17 ms
-tp from (12) Plotted on y-axis tyi=ty1=ty2 50-400 ms Plotted on x-axis
tdi - Randomlybetween 0 andselectedt integer yiwith PDM
ro 1331.5 mm For OPLL
rm 2140 mm For MLEM
tg 5 ms
-system for luminaire and inter luminaire LEDs. For intra-luminaire LEDs, the positioning time is determined by measuring the time it takes the receiver to correctly decode its position in an intra-luminaire TDM-based overlap region. For measurements, the receiver is placed at the overlap between regions11and12and the cycle time is increased from 50 ms to 400 ms. As expected, the TDM positioning time averages at 126.5 ms which is the time for a packet to be received twice. For the inter-luminaires LEDs both PDM and TDM are used as the receiver is placed in an inter-luminaire overlap region (between12and21) as presented in Fig. 5 and the measured positioning time matches the expected theoretical results.
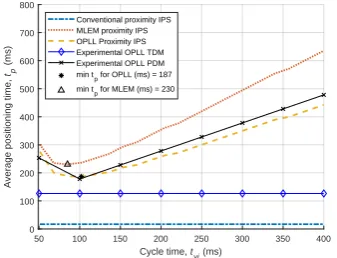
The positioning time plots presented in Fig. 7 show that the conventional proximity IPS has the fastest positioning time at10ms and this value is constant since the positioning time of these systems is independent on cycle time. The MLEM proximity IPS has a minimum positioning time of230ms occurring at a cycle time of80 ms while the OPLL system has a minimum positioning time of187 ms occurring at a cycle time of100ms. This implies the positioning time of OPLL system is43ms lower than that of the MLEM system and as the cycle time increases, this difference in positioning time between MLEM and OPLL is observed to increase. The OPLL system with two luminaires and a total of eight uniquely identifiable LEDs has better positioning time and error than the MLEM system with two luminaires (two uniquely identifiable LEDs).
5. Conclusion: This letter proposes OPLL as a method to improve the accuracy of proximity based indoor positioning systems. OPLL IPS takes advantage of the advances in optically engineered freeform lenses to separate the region of coverage of LED beams in a luminaire. The LED beams are programmed to transmit positional coordinates of the center of their beam. By directing LED beams to specific areas of a room, the positional coordinates picked up by a receiver are used to infer the position of the receiver. This system also takes advantage of overlap between LED beams and at a beam radius of about1.33m, in the system under consideration, the OPLL IPS is shown to reduce positioning
(a) (b)
Figure 6Fabricated luminaire and experimental implementation of Fig. 3 to determine positioning time using TDM and PDM for OPLL.
a OPLL Luminaire frames each with 4 LEDs tilt b Experimental set-up for investigation
[image:5.595.308.503.557.634.2]50 100 150 200 250 300 350 400 Cycle time, tyi (ms)
0 100 200 300 400 500 600 700 800
Average positioning time,
tp
(ms)
Conventional proximity IPS MLEM proximity IPS OPLL Proximity IPS Experimental OPLL TDM Experimental OPLL PDM
min tp for OPLL (ms) = 187
min t
[image:6.595.106.275.130.259.2]p for MLEM (ms) = 230
Figure 7 Positioning timetp for conventional proximity IPS, MLEM
proximity IPS and OPLL proximity IPS as the cycle timetyiincreases from
50to400ms (min: minimum)
error to0.735m. This error can be further reduced by increasing the number of LEDs in a luminaire. The novel design in this work uses 4 uniquely identifiable LEDs to reduce positioning error by 55.1%and it achieves it1.2times faster than the MLEM system. By achieving sub-meter positioning error, the OPLL system proves suitable for positioning of PWAD since the average human width is about half a meter. OPLL opens up a new inexpensive technology for positioning where reduction of positioning error can be achieved using optical pixelation techniques which is applicable to any room, enclosed space or indoor location. With OPLL, PWAD can be effectively monitored and, over time, data on movement profiles of PWAD can be used to learn more about managing Alzheimer’s disease.
For future work, freeform lenses to suit OPLL applications will be designed and the OPLL will be fabricated and tested with currently built receiver prototype. The results will be compared to the performance of other systems and methods for indoor positioning.
6. Funding and Declaration of Interests: The work described in this letter was funded by the research studentship of the School of Engineering and Built Environment of the Glasgow Caledonian University. Conflict of interest: None declared.
7 References
[1] Kuo, Y. S., Pannuto, P., Hsiao, K. J., and Dutta, P.: ‘Luxapose: Indoor positioning with mobile phones and visible light’, 20th international conference on Mobile computing and networking, 2014, pp. 447-458
[2] Alzheimer’s Association and others: ‘2014 Alzheimer’s disease facts and figures’,Alzheimer’s & Dementia, 2014, 10(2), pp. e47–e92
[3] Alzheimer’s Association and others: ‘2016 Alzheimer’s disease facts and figures’,Alzheimer’s & Dementia, 2016, 12(4), pp. 459–509
[4] Norton, S., Matthews, F. E., Barnes, D. E., Yaffe, K., and Brayne, C.: ‘Potential for primary prevention of Alzheimer’s disease: an analysis of population-based data’ ,The Lancet Neurology, 2014,13(8), pp. 788–794
[5] Panza, G. A., Taylor, B. A., MacDonald, H. V., Johnson, B. T., Zaleski, A. L., Livingston, J., Thompson, P. D., Pescatello, L. S.: ‘Can Exercise Improve Cognitive Symptoms of Alzheimer’s Disease?’, Journal of the American Geriatrics Society, 2018,66(3), pp. 487–495
[6] Stephen, R., Hongisto, K., Solomon, A., Lönnroos, E.: ‘Physical activity and Alzheimer’s disease: a systematic review’, Journals of Gerontology Series A: Biomedical Sciences and Medical Sciences, 2017,72(6), pp. 733–739 [7] Qian, H.: ‘Correlation of walking speed and time up to
go (TUG) with Dementia’,Alzheimer’s & Dementia: The Journal of the Alzheimer’s Association, 2014,10(4), pp. p891
[8] Yong, K., Carton, A. M., Yang, B., McCarthy, I., Suzuki, T., Holloway, C., Serougne, R., Boampong, D., Sullivan, M. P., and Tyler, N.: ‘Object localisation deficits in posterior cortical atrophy and typical Alzheimer’s disease: tracking position, movement and fixation patterns within a simulated real-world setting’,Alzheimer’s & Dementia: The Journal of the Alzheimer’s Association, 2016,12(7), pp. p310 [9] Jung, S.Y. and Park, C.S.: ‘Lighting LEDs based indoor
positioning system using received signal strength ratio’, Proceedings of 3DSA, 2013,8(5)
[10] Jung, S.H., Lee, G. and Han, D.: ‘Methods and tools to construct a global indoor positioning system’, IEEE Transactions on Systems, Man, and Cybernetics, 2017 [11] Dividis, K.: ‘Design and Prototyping of a Visible Light
Indoor Positioning System’,Citeseer, 2007
[12] Popoola, O. R., Ogunkoya, F., Popoola, W., Ramirez-Iniguez, R., and Sinanovi´c, S.: ‘Indoor localization based on multiple LEDs position estimation’,17th IEEE International Workshop on Signal Processing Advances in
Wireless Communications (SPAWC), 2016, pp. 1–6
[13] Lv, H., Feng, L., Yang, A., Guo, P.,Huang, H., and Chen, S.: ‘High accuracy VLC indoor positioning system with differential detection’,IEEE Photonics Journal, 2017,9(3), pp. 1–13
[14] Chen, L.W., Chen, C.R. and Chen, D.E.: ‘VIPS: A video-based indoor positioning system with centimeter-grade accuracy for the IoT’, IEEE International Conference on Pervasive Computing and Communications Workshops (PerCom Workshops), 2017, pp. 63–65
[15] Lin, B., Tang, X., Ghassemlooy, Z., Lin, C., and Li, Y.: ‘Experimental demonstration of an indoor VLC positioning system based on OFDMA’,IEEE Photonics Journal, 2017, 9(2),, pp. 1–9
[16] Masson, A. E., Hignett, S., and Gyi, D. E.: ‘Anthropometric study to understand body size and shape for plus size people at work’,Procedia Manufacturing, 2015,3, pp. 5647–5654 [17] Gannon, C., and Liang, R.: ‘Ray mapping with surface information for freeform illumination design’, Optics Express, 2017,25(8), pp. 9426–9434
[18] Babadi, S., Ramirez-Iniguez, R., Boutaleb, T., and Mallick, T.: ‘Performance analysis of a DTIRC-LED illumination structure’, Proceedings SPIE, Optics and Measurement Conference, 2015,9442
[19] Popoola, O. R., and Sinanovi´c, S.: ‘Design and Analysis of Collision Reduction Algorithms for LED-Based Indoor Positioning With Simulation and Experimental Validation’, IEEE Access, 2018,6, pp. 10754–10770
[20] Winzer, P. J. and Essiambre, R. J.: ‘Advanced optical modulation formats’,Proceedings of the IEEE, 2006,94(5), pp. 952–985