Increasing
hybrid
PV/wind/diesel generator power output
with increased PV module efficiency.
L O Idoko1, O Anaya-Lara1 and A Attya2
1 Department of EEE, University of Strathclyde. Glasgow, UK.
2 School of Computing & Engineering, University of Huddersfield, UK.
E-mail: [email protected]
Abstract. This research work focuses on increasing the power output of a hybrid energy system by giving a boost to the energy supplied from the PV module. It embraces the cooling of the PV module using a multi-concept cooling technique. An experiment was set up to reduce the surface temperature of the PV module to 20°C in order to increase its efficiency and hence power output. The experiment was performed using two 250 watts PV modules, water spraying was carried out on one of the modules which, was also attached with an Aluminium heat sink at the rear, while the other module was mounted without any form of cooling. The modelling of the hybrid energy system was done using MATLAB Simulink. An equation for PV module power output was used with a derating factor of 95% and the result of the experiment shows that power output of 262.4 watts is achievable, and the simulation result shows an increase in the power contributed by the module.
1. Introduction
The growth of any developing nation depends largely on the accessibility of adequate Power, as the availability of adequate power is a necessity, for an appreciable economic and technological development to be achieved.
Sources of energy supply from natural resources such as wind and sunlight provides a clean alternative source of power in locations which experiences high sunshine and high wind speed and as a result, energy from renewable sources can compete favourably with energy generation from fossil fuel, which usually introduce pollution to the environment [1].
The PV module is a good source of energy in Nigeria and other parts of the world, which experiences long periods of sunshine. In locations where long period of sunshine hours is experienced during the day, the excess sunlight is not fully utilized due to the effect of temperature on the PV module.
As the intensity of the sun increases, the temperature of the module surface also increases. Temperatures about 25°C causes the power output from the solar panel to reduce. Imagine a situation where the temperature of the surface of the module increases above 45°C, a lot of the incident radiation is converted to electricity and heat energy.
The energy converted to heat energy is wasted in the process, hence, the power output generated by the PV module reduces as the temperature of the module surface increases. In order to make the module more efficient, cooling of the surface of a PV module is a necessity [2]. A recent research, [3] shows that when you place a PV module under sunlight, only about 31% of the energy from the sun is converted to useful energy, the remaining percentage is converted to heat energy which usually causes the temperature of the module to increase and this gives rise to the following challenges:
• There is a reduction in the electricity produced by the module
• The conversion efficiency of the PV module also reduces.
In order for us to maximize the use of the available energy from the sun to generate electricity, cooling of the PV module is a necessity.
1.1.Multi-concept cooling technique
This research work embraces a multi-concept cooling technique to help reduce the energy wasted as heat energy when a PV module is placed under sunlight. The aim is to extract the excess energy, which causes the temperature of the PV module surface to rise to a level, where the power output reduces due to a reduction in the conversion efficiency of the module. The concept involves:
• Cooling the surface of the PV module to a temperature of 20°C using water
• Attaching aluminium heat sink at the rear of the PV module.
• Mounting of the module at a considerable height above the ground to enhance air-cooling. Cooling of the module surface with water helps to reduce the temperature of the module surface considerably; this helps to increase the conversion efficiency of the PV module. Conversely, the aluminium heat sink attached to the rear of the module serves two functions: it helps to extract heat from the rear of the module and, it also helps the module to maintain a uniform temperature.
1.2.New features and advantages of proposed method.
The new features of the proposed method include the followings: cooling of the module is achieved using multi-concept cooling technique, ice blocks is added to the cooling water to reduce its temperature and cooling is applied at the surface as well as the rear of the module.
Conversely, the main advantages of this method are as follows: maintaining the temperature of the module surface at 20°C ensures the module yields steady increase in power output, at an irradiance of 1000w/m2, more power than the module rated capacity is achieved and in the absence of any of the three
concepts of cooling involved, a certain amount of cooling can be achieved.
1.3.The efficiency of PV module
The efficiency,
η
of a PV module is generally defined as in [2], as the ratio of the energy produced by the module to the energy obtained from the sun. It can be represented mathematically as equation (1)m ax
/ / .
p d o b
E E P E A
η = = (1)
Where Pmax represents the maximum power obtained from the module, the solar irradiance at STC in
W/m2 is represented by E, while A represents the module surface area (m2).
Epd and Eob represent the energy produced by the module and the energy obtained from the sun
respectively. The PV module efficiency can also be represented as equation (2).
[1 ( )]
m rT Tm TrT
η =η −β − (2)
Where
η
mis the module efficiency,η
rT represents the module efficiency at 25°C, Tm is the module temperature,β
is the temperature coefficient of power and TrT represents module reference temperature.1.4.The effect of Temperature on PV module
In order to account for the effect of temperature on a PV module, the PV module power output as in [4] is expressed using equation (3).
)] (
1 )[ /
(
. pv T T,STC p C C,STC
pv
pv Y f G G T T
P = +α − (3)
Where
fpv represents the derating factor (%) of the PV module,
Ypv represents the PV array rated capacity at STC ((KW)
GT represents the amount of solar radiation incident on the PV array (KW/m2)
GT, STC represents the amount of incident radiation at STC (1Km/m2)
α
p represents the temperature coefficient of power (%/°C)TC represents the temperature of the PV cell (°C)
1.5.Research location
[image:3.595.103.493.176.294.2]The experiment carried out in order to increase the efficiency of the PV module was performed in Sokoto state, in northern Nigeria located within Latitude 13.1274 and Longitude 5.2046, an area which, experiences a long period of intense sunlight. The sunshine hours data for Sokoto, Sokoto State, Nigeria is as shown in Figure 1.
Figure 1. Sunshine hours in Sokoto in the 2016.
The aim of the experiment is to improve the efficiency of the PV module and in the process, increase the amount of energy contributed to the hybrid energy system by the PV.
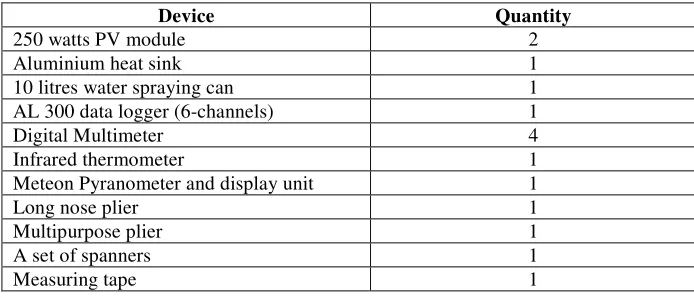
2. Materials
The experiment was carried out successfully using the following devices as shown in Table 1
Table 1. Devices used for the experiment.
Device Quantity
250 watts PV module 2
Aluminium heat sink 1
10 litres water spraying can 1
AL 300 data logger (6-channels) 1
Digital Multimeter 4
Infrared thermometer 1
Meteon Pyranometer and display unit 1
Long nose plier 1
Multipurpose plier 1
A set of spanners 1
Measuring tape 1
The experiment requires the use of both 250 watts, as one of the modules was mounted without an attached aluminium heat while the other has an attached aluminium heat sink. The Aluminium heat is fabricated using an Aluminium sheet with a dimension of 154 cm x 93cm x 0.1cm on which several Aluminium fins with fin base of 2.4cm each, were mounted.
3. Method
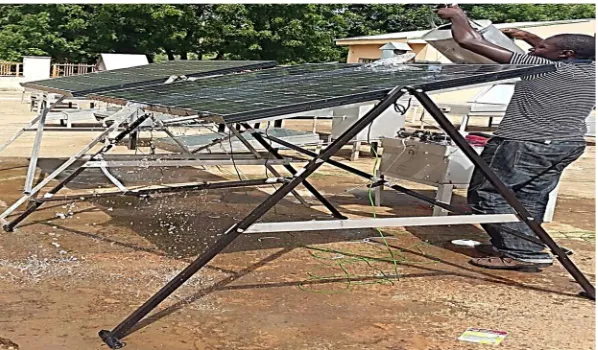
[image:3.595.123.470.405.554.2]Figure 2. Project setup
The function of the Al heat sink attached to the rear of one the module, is to extract heat from the module and keep the temperature uniform while, cooling of the surface of the PV module was carried out by spraying the surface of the PV module with water.
Ice blocks were introduced into the cooling water to reduce the temperature of the cooling water, spraying of the module was done with the cold water and a module surface temperature of about 20°C
was achieved. Spraying of the module was carried out as shown in Figure 3.
Figure 3. Spraying of PV module with cold water.
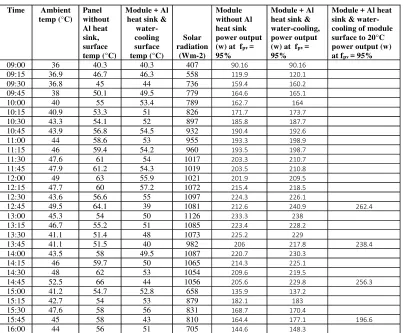
The results of the experiment are as shown in Table 2, the power output of the PV module at a derating factor of 95% was calculated using equation (3). The calculation was carried out for the module without aluminium heat sink and cooling, the module with Aluminium heat sink + water-cooling, and finally it was used to compute the power output of the module when the module surface temperature was reduced to 20°C
[image:4.595.149.448.369.544.2]Table 2. Module power output at a derating factor of 95%.
[image:5.595.98.501.113.446.2]A section through Table 2 which, indicates the difference in the power output produced by the module when subjected to different conditions is as shown in Table 3
Table 3. Power outputs obtained from the experiment
Time Module without Al heat
sink power output (w) at
fpv = 95%
Module + Al heat sink & water-cooling, power output
(w) at fpv = 95%
Module + Al heat sink & water-cooling of module surface to 20°C
power output (w) at fpv = 95%
12:45 212.6 240.9 262.4
13:45 206 217.8 238.4
14:45 205.6 229.8 256.3
15:45 164.4 177.1 196.6
From Table 3 above, more power is obtained with the module + Al heat sink & water cooling, but maximum power output of 262.4 w was achieved with cooling the PV module + Al heat sink & water-cooling of module surface to 20°C.
In order to implement the effect of the increase in power output using MATLAB, the module operating temperature set to 20°C, is used as an input to the PV array MATLAB Simulink block.
4. Model composition of hybrid PV/wind/diesel generator
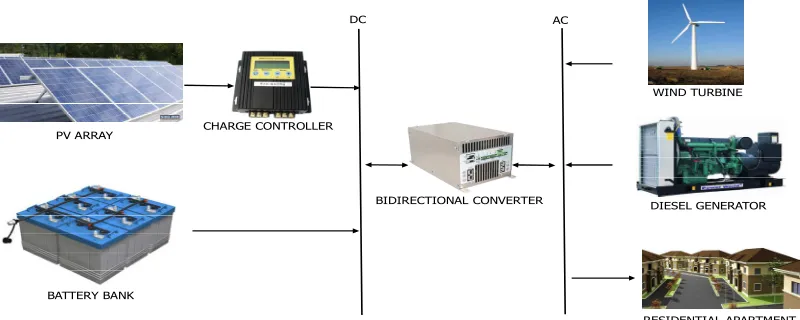
The research project comprises of 60kw PV array, 50kw diesel generator, 50kw PMSG driven wind turbine, 480 Vision 6FM200D batteries made up of a string size of 30 with 16 strings in parallel, each battery have a nominal voltage of 12volts and a nominal capacity of 200AH (2.4KWh). The configuration of the hybrid energy system is as shown in Figure 4
Time Ambient temp (°C) Panel without Al heat sink, surface temp (°C)
Module + Al heat sink &
water-cooling surface temp (°C) Solar radiation (Wm-2) Module without Al heat sink power output (w) at fpv =
95%
Module + Al heat sink & water-cooling, power output (w) at fpv =
95%
Module + Al heat sink & water-cooling of module surface to 20°C power output (w) at fpv = 95%
09:00 36 40.3 40.3 407 90.16 90.16
09:15 36.9 46.7 46.3 558 119.9 120.1
09:30 36.8 45 44 736 159.4 160.2
09:45 38 50.1 49.5 779 164.6 165.1
10:00 40 55 53.4 789 162.7 164
10:15 40.9 53.3 51 826 171.7 173.7
10:30 43.3 54.1 52 897 185.8 187.7
10:45 43.9 56.8 54.5 932 190.4 192.6
11:00 44 58.6 53 955 193.3 198.9
11:15 46 59.4 54.2 960 193.5 198.7
11:30 47.6 61 54 1017 203.3 210.7
11:45 47.9 61.2 54.3 1019 203.5 210.8
12:00 49 63 55.9 1021 201.9 209.5
12:15 47.7 60 57.2 1072 215.4 218.5
12:30 43.6 56.6 55 1097 224.3 226.1
12:45 49.5 64.1 39 1081 212.6 240.9 262.4
13:00 45.3 54 50 1126 233.3 238
13:15 46.7 55.2 51 1085 223.4 228.2
13:30 41.1 51.4 48 1073 225.2 229
13:45 41.1 51.5 40 982 206 217.8 238.4
14:00 43.5 58 49.5 1087 220.7 230.3
14:15 46 59.7 50 1065 214.3 225.1
14:30 48 62 53 1054 209.6 219.5
14:45 52.5 66 44 1056 205.6 229.8 256.3
15:00 41.2 54.7 52.8 658 135.9 137.2
15:15 42.7 54 53 879 182.1 183
15:30 47.6 58 56 831 168.7 170.4
15:45 45 58 43 810 164.4 177.1 196.6
BATTERY BANK PV ARRAY
BIDIRECTIONAL CONVERTER CHARGE CONTROLLER
RESIDENTIAL APARTMENT DIESEL GENERATOR
WIND TURBINE
[image:6.595.99.499.104.264.2]DC AC
Figure 4. Hybrid energy system configuration
4.1.Design of 60kw PV array
The maximum power delivered by a photovoltaic array as in [5] is given by the expression
( I ).( ).
m p p m p s m p
P = N × N ×V (4)
Where the Np and Ns stand for the number PV modules connected in parallel and in series respectively.
Imp and Vmp stand for the maximum current and voltage at MPPT respectively. This is because adding
PV modules in series increases the voltage while adding PV modules in parallel increases the current. In order to achieve a PV array with a capacity of 60KW, a PV array voltage of 614V was considered by connecting 20 PV modules in series, conversely 12 PV modules are connected in parallel and each module has a maximum voltage, Vmp of 30.7v and a maximum current, Imp of 8.15A at maximum power.
4.2.Sizing of battery bank
The size of the battery bank can be calculated as in [6] using equation (5).
. . .
d A c p
s y s
D D
B
V D o D η
= (5)
Where DoD, η, Vsys, Bcp, Dd and DA stand for depth of discharge, efficiency, Battery capacity, daily load
demand and battery days of autonomy respectively. Battery round trip efficiency of 85% was selected for this project.
Sizing of battery bank for this project does not require any further design as the sizing was achieved with the help of HOMER software simulator. A total of 480 batteries, each with nominal voltage of 12V and a nominal capacity of 200Ah (2,4Kwh) is required for this project and it comprises of a string size of 30 with 16 battery strings in parallel.
Batteries add up in series to increase the voltage while the amperage remains the same, conversely, they add up in parallel to increase current while the voltage remains the same. A string size of 30 implies connecting 30 batteries in series.
This generates 30 (12V), at an amperage of 200Ah and hence, the bus voltage is 360V, hence a battery string size of 30 generates 360V, 200Ah. Sixteen, 16 parallel strings of battery connected in parallel yields 360V, 16 (200Ah). Therefore, the 480 batteries required for this research work generate a bus voltage of 360V and an amperage of 3200Ah.
4.3.Boost converter design
In this case, the boost converter is used to give the PV voltage, Vpv a boost from 614V to 700V, which is the selected Vdc of the VSC DC bus.
7 0 0 6 1 4
0 .1 2 6 1 4
d c p v
d c V V D V − − = = = (6) The capacity of the boost converter inductor is given as
3 3
6 1 4 0 . 1 2
1 . 5 0 8 5 6 0 1 0
1 0 1 0
1 0 0 6 1 4 i n
b c
s w p v
V D
L m H
f I × = = = × × × △ (7)
Where △Ipv is considered as the input current ripples (5%) of Ipvand fswrepresents the switching
frequency in hertz, the value of the inductance, Lbc is selected as 1.6mH.
4.4.DC link capacitor design
The size of the DC link capacitor can be calculated as in [7] using the expression
1 2
/
4 8 75
2( 2 2 (2 )
d d c
d crip d crip
I P V
C C F
V V µ
ω ω = = = = × × × × △ △ (8) Where Vdcrip is the ripple voltage, its value is 2% of the Vdc, Id represents the VSC DC link current, the
angular frequency is represented by
ω
, the value of the selected DC link capacitors are C1=C2=500μF Interfacing Inductor design and selectionThe value of the interfacing inductor is achieved using the expression in [7] as
i n t
3 3 0 .9 0 7 0 0
3 .8 9 1 2 1 2 1 .2 9 0 0 0 .2 5 8 6 .6 0
d c f s w R r
m V
L m H
O f I
× × × ×
= = =
× × × × × × ×
(9) Where Of represents the overloading factor, m represents the modulation index, fsw represents the
switching frequency, Vdc represents the DC link voltage, IRr represents the ripple in the grid current, its
value is 25% of the grid current, IR.
3
6 0 1 0
8 6 . 6 0 3 4 0 0
R
I = × = A
×
(10)
4.5.Modelling of diesel generator
The diesel generator is made up a diesel engine and an alternator for electricity generation; it consist of a diesel engine, a synchronous generator, an excitation system and speed controller. The diesel engine and governor system exert control on the speed of the governor to supply mechanical power. Its diesel engine comprises of the governor and an internal combustion (IC) engine.
The diesel generator ensures the conversion of energy from fuel such as diesel or bio-diesel into mechanical energy with the help of its internal combustion engine, after which, this mechanical energy is converted into electrical energy with the help of its electric machine operating as a generator. The governor is made up of actuator and speed controller, the maintenance of a constant speed during the period of operation of a diesel generator is maintained by the governor [8] [9]
The transfer function of the actuator as well as that of the regulator as in [8] is as shown in equation 11 and 12 respectively
1
2 3
(1 )
(1 ) (1 )
a a
a a
T s H
s T s T s
+ =
+ + + (11)
2
1 2
(1 )
(1 )
r r a
r
r r
T s H
T s T s
ϒ + =
+ + (12)
Where, Ta1, Ta2 and Ta3 represent the time constants of the actuator, ϒrrepresents the gain of the
regulator while, the time constants of the regulator is represented by Tr1, Tr2 and Tr3.
Conversely, the speed regulation and diesel engine of the diesel generator can be described using differential equations as in [8] as equation (13) and equation (14).
2 2 2 1 ( ) B c B
r e f
d m K
K P m
d t =τ − ω R ∆ −ω
(13)
1
r e f
d P c K
d t ω ω
−
Where the rate of fuel consumption of the diesel engine is denoted mB, ωref is the engine reference speed
in rad/sec, R is the permanent speed drop of the diesel engine, K1 is the summing loop amplification
factor of the governor, the gain and dead time of the engine is represented by K2 and Ʈ2 respectively.
The dead time, Ʈ2 can be represented as in [8] as equation (15). 2
6 0 6 0
2 4
t
S
N n N
τ = + (15)
N refers to the speed in rev/min, n is the quantity of cylinders, St represents the number of stroke engine,
in this case, St=4 and due to combustion, the generated mechanical power is expressed as equation (16)
1 B
P= Εm
η
(16)η represents the efficiency and E1 represents the proportionality constant.
4.6.Modelling of wind energy conversion system
With the help of the wind turbine, wind energy is converted into mechanical power and hence. The mechanical power is transformed into electrical power. The value of the mechanical power can be computed using the equation (17) [10]
0.5 ( , )
m p wind
P =
ρ
ΑCλ β
V (17)Whereρ represents the density of air, its value is within the range of 1.22-1.3Kg/ms, Vwind refers to the
speed of the wind in m/s, A represents the swept area of the turbine blades (m2)
, the coefficient of power
is denoted by Cp (λ,β), it’s influenced by two factors, the pitch angle of the blade, β and the speed slip
ratio, mathematically, the tip speed ratio is defined as / wind
R V
λ = Ω (18)
R is the radius of the blade (m) and Ωrefers to the angular speed (m/s) The coefficient of power is defined as in [10] as
5 2
1 3 4 6
1 1
( , ) ex p
p
C C
C λ β C C β C C λ
λ λ
−
= − − +
(19)
Where
3
1 1 0 .0 3 5
1 0 .0 8 1
λ λ β β
= −
+ +
(20) The rotational torque can be expressed as
/
m m
T = P Ω (21)
And the optimal angular speed is represented by the relation
/
opt wind
opt
λ
V RΩ = (22)
In order to achieve the maximum mechanical power, the following relation is used 3
_ m ax 0.5 m ax
m p w ind
P = ρA C V (23)
4.6.1. PMSG driven wind turbine
The PMSG driven wind turbine was chosen for this project as a result of certain advantages in [11] as follows:
• There are absence of brush/slip ring.
• The mechanical stress is low
• The rotor does not experience any form of copper loss
• Reactive/active power controllability is higher
The sign of the torque input of the PMSG is what determines its mode of operation, if its sign is negative, the PMSG operates as a generator and if its sign is positive, the PMSG operates as a motor [12]. The implementation of PMSG model is done in the dq-coordinates, which implies AC states does not exist in the model. Its mathematical equation is developed from the synchronous rotating reference frame by ensuring that the d-axis aligns with the rotor flux direction [10] [13].
q
q s q q e d d e m
d i
V R i L L i
d t ω ω ϕ
a
d s a d e q q
di
V R i L L i
dt ω
= + − (25)
Where Vq and Vd represent the q and d components of the voltages in the stator, iq and id represent the q
and d components of the currents in the stator, Lq and Ld represent the inductances (H) of the machine, m
ϕ
represents the magnetic flux (wb),ω
erepresents the electrical speed (rad/s). In order to obtain the electrical torque, the following expression is used.(
)
{
}
3
2 m q d q d q
T e = P ϕ i + L − L L i (26)
P in the expression above represents the poles pair and the machine rotor dynamics can be represented by the following expression
r
m e r
d T T B J
dt
ω ω
− = + (27)
Where J represents the inertia of the rotor (kgm2), r
ω
is the speed of the rotor (rad/s), B represents the friction in the rotor Kgm2/s, the mechanical torque that was produced by the wind is represented bym
T
Assuming Ld=Lq=0, and the d-reference current, id*=0, then the (Ld-Lq)idiq becomes negligible.
4.7.Control of the hybrid energy system
The battery bank performs two roles in this project as it serves a sink, and also as a source, hence it charges or discharges when the network experiences surplus or lack of power from the sources of energy due to the situation of the weather. When the amount of electricity supplied by the sources of power is greater the load on the network, the battery controller charges the battery and when the load on the network is more than the electricity supply from the sources, the controller causes the battery bank to discharge [14].
The control of the battery storage is done in such a way as to ensure the DC voltage is stabilized and this is achieved through the control of the DC/DC bidirectional converter in the network.
When there is a shortage of power from the sources, the bidirectional converter serves as a boost converter to provide power by discharging the battery and when the power supplied from the sources is in excess, it operates as a buck converter to charge the battery [15].
The hybrid system is also, incorporated with a dump load, the dump load is made up of a bank of resistors and a power converter, the capacity of the dump load power is such that it exceeds the amount of power produced by the wind, PV and diesel generator by 30%. It is to ensure the control of the network should, a condition arises when there is no load and the battery storage fails or is fully charged.
The flow of power in the network can be represented as
network pv wt diesel load
P
=
P
+ +
P
P
−
P
(28)Where, the net power generated is represented by Pnetwork, Ppv is the amount of power supplied by the
PV, Pwt represents the power supplied by the wind turbine and Pload is the power of the load
When Pnetwork < 0, it means the power supplied by the energy sources is not enough and the battery
provides power to make up for the shortage of power, but when Pnetwork> 0, it implies the amount of
power produced by the energy sources is in excess, the excess power is stored in the battery, but the moment it becomes more than the rated power of the batteries in the battery bank, a fraction of the excess power is transferred to the system dump load.
5. Results
Figure 5. I-V and P-V curve of 60KW PV array.
The I-V and P-V curve below shows the usual characteristic of a PV module, which generate less power as the temperature of the module increases.
[image:10.595.89.505.374.631.2]The research location for this project usually experiences low wind speed unlike some part of Europe where the wind speed is high and as a result the simulation was carried out at a wind speed of 6.1m/s and at a constant irradiance of 1000w/m2. The result is as shown in Figure 6 and Figure 7.
Figure 6. 60KW PV array power output at 45°C.
Figure 7. 60KW PV array power output at 20°C.
From Figure 6 and Figure 7, it can be observed that the power output produced by the PV array at a temperature of 20°C is more, this is because, the PV module works better when the module surface temperature is low
[image:10.595.93.503.378.496.2]Figure 8. Vdc reference and Vdc measured
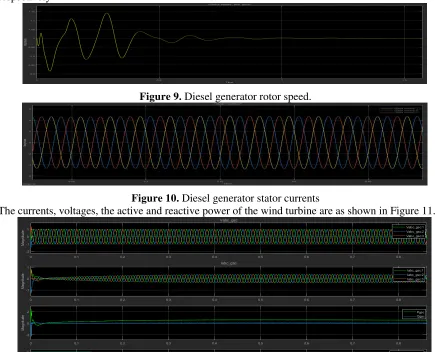
[image:11.595.73.508.234.586.2]The diesel generator rotor speed in pu and the stator currents are as shown in Figure 9 and Figure 10 respectively
[image:11.595.82.506.443.623.2]Figure 9. Diesel generator rotor speed.
Figure 10. Diesel generator stator currents
The currents, voltages, the active and reactive power of the wind turbine are as shown in Figure 11.
Figure 11. Wind turbine currents, voltages, active and reactive power output
6. Conclusion
7. References
[1] Engin M. Sizing and simulation of PV-wind hybrid power system. Int J Photoenergy. 2013;2013 [2] Chikate B V, Sadawarte Y A. The Factors Affecting the Performance of Solar Cell. Int J Comput Appl Sci Technol [Internet]. 2015 [cited 2017 Sep 16];975–8887. Available from: http://research.ijcaonline.org/icquest2015/number1/icquest2776.pdf
[3] Koteswararao B, Radha K, Vijay P and Raja N. Experimental Analysis of solar panel efficiency with different modes of cooling. 2016;8(3):1451–6.
[4] Homer Energy. How homer calculates the PV array power output [Internet]. Homer Energy Support. 2014 [cited 2017 Oct 31]. p. 1. Available from: https://www.homerenergy.com/support/docs/3.10/how_homer_calculates_the_pv_array_power _output.html
[5] Kumar S, Verma A K, Hussain I and Singh B. Performance of Grid Interfaced Solar PV System under Variable Solar Intensity. [cited 2017 Nov 22]; Available from: https://www.researchgate.net/profile/Ikhlaq_Hussain/publication/280562137_Performance_of_ grid_interfaced_solar_PV_system_under_variable_solar_intensity/links/55b9c8c608aed621de0 879dc/Performance-of-grid-interfaced-solar-PV-system-under-variable-solar-inte
[6] Akinyele D O and Rayudu R K. Community-based hybrid electricity supply system: A practical and comparative approach. Appl Energy [Internet]. Elsevier Ltd; 2016;171:608–28. Available from: http://dx.doi.org/10.1016/j.apenergy.2016.03.031
[7] Mohan N, Undeland T M and Robbins W P. Power electronics : converters, applications, and design. 3rd ed. John Wiley & Sons; 2003. 824 p.
[8] Faten Hosney Fahmy. PV/Diesel Hybrid System for Fuel Production from Waste Plastics Recycling. Ijmer [Internet]. 2014;4(12):68–79. Available from: http://www.ijmer.com/papers/Vol4_Issue11/Version-1/H04011_01-6879.pdf
[9] Pachori A, Suhane P and Scholar P. Design and modelling of standalone hybrid power system with MATLAB/simulink. Int J Sci Res Manag Stud [Internet]. [cited 2017 Dec 3];1(2):2349– 3771. Available from: http://www.ijsrms.com/media/3n2-IJSRMS0102116_v1_is2_65-71.pdf [10] Babu N R and Arulmozhivarman P. Wind energy conversion systems - A technical review. J Eng
Sci Technol. 2013;8(4):493–507.
[11] Kim H S and Lu D D. Wind Energy Conversion System from Electrical Perspective — A Survey.
2010;2010(November):119–31. Available from:
http://www.scirp.org/journal/PaperInformation.aspx?PaperID=3324
[12] Mishra S, Gupta M, Garg A, Goel R and Mishra V K. Modeling and Simulation of Solar Photo-Voltaic and PMSG Based Wind Hybrid System. lEEE Students’ Conference on Electrical, Electronics and Computer Science [Internet]. 2014 [cited 2017 Nov 19]. Available from: http://ieeexplore.ieee.org/stamp/stamp.jsp?arnumber=6804430
[13] Gajewski P and Pieńkowski K. Analysis of a wind energy converter system with PMSG generator. 2015;
[14] Samrat N H, Ahmad N Bin, Choudhury I A and Taha Z B. Modeling , Control , and Simulation of Battery Storage Photovoltaic-Wave Energy Hybrid Renewable Power Generation Systems for Island Electrification in Malaysia Modeling , Control , and Simulation of Battery Storage Photovoltaic-Wave Energy Hybrid Renewab. Sci World J. 2014;2014(February 2016):22. [15] Yasin A, Napoli G, Ferraro M and Antonucci V. Modelling and control of a residential
wind/PV/battery hybrid power system with performance analysis. J Appl Sci [Internet]. 2011
[cited 2017 Sep 6];11(22):3663–76. Available from: