R E S E A R C H A R T I C L E
Open Access
Risk-adjustment methods for all-payer
comparative performance reporting in
Vermont
Karl Finison
1*, MaryKate Mohlman
2, Craig Jones
3, Melanie Pinette
1, David Jorgenson
1, Amy Kinner
1,
Tim Tremblay
2and Daniel Gottlieb
4Abstract
Background:As the emphasis in health reform shifts to value-based payments, especially through multi-payer initiatives supported by the U.S. Center for Medicare & Medicaid Innovation, and with the increasing availability of statewide all-payer claims databases, the need for an all-payer,“whole-population”approach to facilitate the reporting of utilization, cost, and quality measures has grown. However, given the disparities between the different populations served by Medicare, Medicaid, and commercial payers, risk-adjustment methods for addressing these differences in a single measure have been a challenge.
Methods:This study evaluated different levels of risk adjustment for primary care practice populations–from basic adjustments for age and gender to a more comprehensive“full model”risk-adjustment method that included additional demographic, payer, and health status factors. It applied risk adjustment to populations attributed to patient-centered medical homes (283,153 adult patients and 78,162 pediatric patients) in the state of Vermont that are part of the Blueprint for Health program. Risk-adjusted expenditure and utilization outcomes for calendar year 2014 were reported in 102 adult and 56 pediatric primary-care comparative practice profiles.
Results:Using total expenditures as the dependent variable for the adult population, the r2for the model adjusted for age and gender was 0.028. It increased to 0.265 with the additional adjustment for 3M Clinical Risk Groups and to 0.293 with the full model. For the adult population at the practice level, the no-adjustment model had the highest variation as measured by the coefficient of variation (18.5) compared to the age and gender model (14.8); the age, gender, and CRG model (13.0); and the full model (11.7). Similar results were found for the pediatric population practices.
Conclusions:Results indicate that more comprehensive risk-adjustment models are effective for comparing cost, utilization, and quality measures across multi-payer populations. Such evaluations will become more important for practices, many of which do not distinguish their patients by payer type, and for the implementation of incentive-based or alternative payment systems that depend on“whole-population”outcomes. In Vermont, providers, accountable care organizations, policymakers, and consumers have used Blueprint profiles to identify priorities and opportunities for improving care in their communities.
Keywords:Primary care practice, Risk adjustment, APCD, Population health, Accountable care
* Correspondence:[email protected]
1Onpoint Health Data, 254 Commercial Street, Suite 257, Portland, ME 04101,
USA
Full list of author information is available at the end of the article
Background
In order to achieve the triple aim of improving health outcomes across a population, improving the experience of care, and reducing health care costs, [1] the U.S. Cen-ter for Medicare & Medicaid Innovation (CMMI) at the Centers for Medicare and Medicaid Services (CMS) is implementing value-based Advanced Payment Models that reward health outcomes rather than volume of ser-vices. The expansion of these models offered through ac-countable care organizations (ACOs) increasingly emphasizes multi-payer involvement, primary care fo-cused on comprehensive patient-centered care, account-ability for outcomes of a whole population, and use of population-level data for care management, comparative evaluation, and performance-based payments [2, 3].
However, in the United States, a complex web of health insurers has developed over time. These include Medicare, which covers individuals over the age of 65 as well as disabled people under 65; Medicaid, which covers lower income individuals and families; and commercial insurers, which cover insured people under 65 and their families. This system has complicated analysis as data are often stored in isolation and contain variation in quality, services, and prices. Some of these challenges can be overcome through development of all-payer claims databases (APCDs), which facilitate a higher level of uniformity. Additionally, CMMI has awarded State Innovation Model (SIM) grants to support investment in health data infrastructure that facilitates data aggrega-tion and consistent measurement across different payers and settings, including practices, hospitals, health service areas (HSAs), and ACOs [4, 5]. However, analytic methods that evaluate “whole-population” outcomes while accounting for diversity among subgroups are needed to meet the demands of Advanced Payment Models.
First, these methods require access to multi-payer data. Efforts to develop statewide APCDs began more than a decade ago and have expanded significantly in re-cent years. Currently, 18 states have existing APCDs or are in the process of implementing these critical re-sources. Additionally, 22 states have expressed strong interest in APCDs, and four have voluntary databases; only six states have no APCD-related activity [6]. Sixteen states have legislation enabling collection of claims data [7]. APCDs typically collect eligibility and all-setting claims and pharmacy data for residents of the state from commercial payers and often Medicare and Medicaid data sources. The data are used to generate a wide var-iety of cost, utilization, and quality measures.
Second, these methods need to support a “ whole-population” measurement system that reports on the whole population while adequately adjusting for differ-ences across practices and across their patient
populations. With increased emphasis on primary care transformation as foundational for an accountable health system and with the expanded availability of all-payer data, practices and state initiatives need to understand how practice transformation is affecting care and patient health.
Provider and primary care practice profiles are tools often used to assess a provider’s or practice’s perform-ance, and a variety of efforts have been made to ad-dress issues related to risk adjustment, measures standardization, and comparability across practices [8–13]. In addition, guidelines for profiling identified by organizations representing physicians, [14, 15] highlight the importance of providing consistent measurement and information across an entire practice population instead of single-payer reports that cover only a portion of the practice’s population and use varying measures standards and methods of risk adjustment.
The state of Vermont has tackled many of the chal-lenges of building an accountable health system. Its Blueprint for Health (Blueprint) program is charged with reforming health care delivery through supporting prac-tices as they transform to patient-centered medical homes (PCMHs), supporting multi-disciplinary commu-nity health teams bridge medical and social services, implementing per patient per month payment reforms, and using data to drive quality improvement at multiple levels–practice, organization, HSA, and state [16]. With access to the state’s APCD, which includes expenditure, utilization, and quality data from commercial, Medicaid, and Medicare payers, as well as clinical data from elec-tronic medical records, the Blueprint has developed practice profiles for each PCMH’s“whole population” of patients. These profiles use a single measurement system with large sample sizes and a consistent method of mea-sures generation, risk adjustment, and measurement of error in estimates. The result is a profile that evaluates a medical home’s whole patient population through claims and clinical data and compares outcomes to other med-ical homes, HSAs, and the state.
This study describes the creation of these provider-specific reports. Specifically, it describes the risk adjust-ment and other methods developed to evaluate whole populations. Beyond providing meaningful information to the practices, this study, in achieving its aim, also contributes to the ongoing discussion of how to assess the effect of alternative payment methods on realizing an accountable health system and the Triple Aim.
Methods
Data sources
reported to the state’s APCD, the Vermont Health Care Uniform Reporting & Evaluation System (VHCURES). The data contained services incurred during calendar year 2014 by Vermont residents enrolled in commercial health plans, Medicaid enrollees for whom Medicaid was the primary payer, and Medicare fee-for-service benefi-ciaries for whom Medicare was the primary payer. Each member was attributed to a Blueprint primary care prac-tice using a consistent cross-payer methodology that used the plurality of primary care visits based on Evalu-ation and Management (E&M) codes over a 24-month look-back period. Because patients may have visited dif-ferent practitioners within the same primary care prac-tice group, attribution was made at the pracprac-tice level. The APCD data was used to generate a wide range of claims-based cost, utilization, and quality measures. Each practice was compared to all Blueprint practices in the practice’s geographic (HSA) and to all practices across the state. Practice-level data is not publically available but practice data rolled-up to HSA level is pub-lically reported [17].
Methods of risk adjustment
Stratification of pediatric & adult populations
Two types of primary care practice measure sets and profiles were generated: adult (ages 18 years and older) and pediatric (ages 1–17 years). The adult profiles in-cluded members with commercial, Medicaid (ages 18– 64 years), or Medicare (ages 18 years and older) as primary payer. The pediatric profiles included members ages 1–17 years with commercial payers or Medicaid as primary.
While many practices treat both adult and pediatric populations, others treat primarily only adults or chil-dren. Because the pediatric and adult populations have very different health, utilization, and cost distributions, segregating profiles by adult and pediatric populations provides a more accurate look at practice differences. An alternative — basing practice profiles on physician specialty — would be problematic since attribution is at the practice level and practice groups may have included practitioners with different primary care specialties.
Newborn infants under the age of 1 year were not in-cluded since they (1) have high cost compared to the re-mainder of the pediatric population, (2) have a small number of outlier cases requiring neonatal intensive care, and (3) are often reported as bundled newborn claims by payers resulting in incomplete reporting of expenditures.
Treatment of outliers
The method used in this study capped outliers in expenditure and utilization at the 99th percentile of pa-tients for each measure. Capping was done at the
state-level for each major payer type (i.e., commercial, Medic-aid, Medicare), and capped values were used for practice-level analysis. For the 2014 study population, the dollars truncated by capping represented 7% for the adult population and 13% for the pediatric population.
Adjustment for demographics & health status
Demographic and health status information determined from the APCD data formed the basis for the risk-adjustment methods used for the Blueprint Practice Pro-files. These factors included age, gender, presence of a Blueprint-selected chronic condition, health status as measured by 3M Clinical Risk Groups (CRGs), and (for adult profiles) the occurrence of a maternity diagnosis.
Adjustments were made for the partial length of en-rollment in payer insurance reported for some members during the calendar year. Average members — i.e., cu-mulative member months divided by 12 — were re-ported for each practice.
For the purposes of risk adjustment and to facilitate interpretation of results, member age was grouped. Due to the potential for interaction effects of age and gender, the full model used age and gender groupings (e.g., males aged 18–34 years, females aged 18–34, etc.).
There are several systems for measuring health status being used in the United States, each with its different point of emphasis, yet no single system has emerged as the“gold standard.”In this study, the primary method of adjustment for each member’s health status was based on the application of 3M Clinical Risk Groups (CRGs) to the APCD data. CRGs used to measure health status are applicable to all ages, are updated regularly, are de-signed for use with claims data, are transparent in docu-mentation, perform as well as other available systems, and represent a practical solution to meet the needs of the Blueprint project [18]. The grouper classifies each member into a hierarchy of 1080 distinct clinical groups and nine major clinical CRG statuses based on the diag-noses reported. Due to small numbers, and to create an efficient model that was easily understood, these nine categories were further combined during the risk model development process into (1) Healthy (reference group), (2) Acute or Minor Chronic (e.g., acute ear, nose, or throat condition or minor join pain), (3) Moderate Chronic (e.g., diabetes or moderate chronic joint pain), (4) Significant Chronic (e.g., diabetes with other comor-bid conditions such as congestive heart failure (CHF) or chronic obstructive pulmonary disease (COPD)), and (5) Cancer or Catastrophic (e.g., malignant breast cancer, HIV, cystic fibrosis, muscular dystrophy, quadriplegia).
attention deficit disorder (pediatric model only). A “chronic” (0/1) variable was created if a member was identified with any of these conditions. Since CRGs do not include pregnancy and child birth in clinical classifi-cation, a“maternity”(0/1) variable was created for mem-bers with pregnancy or delivery claims during the year.
Adjustment for practice’s Medicaid & Medicare population
The primary care practice profiles combine the popula-tions from three different payer types (or “payers”) — commercial, Medicaid, and Medicare — that have significant differences in demographics, socioeconomic status, health status, provider reimbursement structures, and services covered and used. For the full model, Medicaid members were identified in the indicator vari-able as: Commercial = 0, Medicare = 0, Medicaid = 1.
Another distinguishing attribute of the Medicaid data was the inclusion of members who received“special Me-dicaid services” (SMS) uncommon in the commercial and Medicare populations. Members receiving SMS may have had a level of disability not adjusted for through the CRGs. Examples of SMS include members receiving day treatment, residential treatment, case management services, and special school services covered by the De-partment of Education. These types of services can con-tribute significantly to a member’s total expenditures. After evaluation of statistical distributions for these ser-vices, members with SMS expenditures over $500 during the 12-month study period were identified by a binomial (0/1) variable.
During model development, it was determined that a practice’s percentage of total members covered by Me-dicaid was a statistically significant predictor of higher total expenditures. Practices in Vermont varied consider-ably in their percentage of members who were covered by Medicaid. Therefore, the full risk-adjustment model included a practice’s percent Medicaid for each Medicaid enrollee in the practice.
Given widely observed healthcare disparities, women covered by Medicaid may be at higher risk for poor ma-ternity and neonatal outcomes than women covered by commercial plans [19–22]. To account for these differ-ences, an interaction term was added between Medicaid and maternity.
As was done for Medicaid, the full risk-adjustment model identified Medicare-eligible beneficiaries through the indicator variable: Commercial = 0, Medicaid = 0, Medicare = 1. The model also included a variable for “practice’s percent Medicare” for members contributing to the practice’s percent Medicare. Using Medicare-specific eligibility elements, “disability” (0/1) and “ end-stage renal disease” (0/1) variables also were created. Pediatric members covered by Medicare were excluded from the pediatric profiling due to small numbers.
Full model & the computation of risk-adjusted rates
The risk-adjustment methods used for reporting used SAS (Version 9.3) regression methods (SAS GENMOD procedure). The full model included age/gender stratifi-cation groups, Blueprint-selected chronic conditions, CRG classification, maternity status, and the additional Medicaid and Medicare adjustors. Adjusted rates were produced by summing the differences between each member’s actual value and the member’s predicted measurement from the model. Rates were weighted for partial lengths of enrollment. Detailed descriptions of the model’s computation of risk-adjusted rates and 95% confidence intervals for the adult and pediatric popula-tions are provided below.
To calculate the adjusted rate, adjusted values were computed for each member by adding model residuals (e) to the population grand mean ð Þy . To report the overall adjusted rate for each practice, the mean of the adjusted values for the members in each practice
ypractice
, in each HSA (yhsa), and statewide (ystatewide) were computed. The following equations represent the models for the adult and pediatric practice profiles.
Adult model
y¼αþðFAGE1834Þβ1þðFAGE3544Þβ2þðFAGE4554Þβ3þðFAGE5564Þβ4þ
FAGE6574
ð Þβ5þðFAGE7584Þβ6þðFAGE85PLUSÞβ7þðMAGE3544Þβ8þ
MAGE4554
ð Þβ9þðMAGE5564Þβ10þðMAGE6574Þβ11þðMAGE7584Þβ12þ
MAGE85PLUS
ð Þβ13þðMEDICAIDÞβ14þðMEDICAREÞβ15þðDUAL ELIGIBILITYÞβ16þ
SMS
ð Þβ17þðPRACTICEPERCENTMEDIÞβ18þðPRACTICEPERCENTMCAREÞβ19þ
DISABLED
ð Þβ20þðESRDÞβ21þðCHRONICÞβ22þðCRGACUTEMINORÞβ23þ
CRGCHRONIC
ð Þβ24þðCRGSIGNIFICANTCHRONICÞβ25þ
CRGCANCERCATASTROPHIC
ð Þβ26þðMATERNITYÞβ27þðMATERNITYMEDICAIDÞβ28þε
Pediatric model
y¼αþðFAGE0104Þβ1þðMAGE0511Þβ2þðFAGE0511Þβ3þðFAGE1217Þβ4þ MAGE1217
ð Þβ5þðMEDICAIDÞβ6þðSMSÞβ7þðPRACTICEPERCENTMEDIÞβ8þ CHRONICPED
ð Þβ9þðCRGACUTEMINORÞβ10þðCRGCHRONICÞβ11þ CRGSIGNIFICANTCHRONIC
ð Þβ12þðCRGCANCERCATASTROPHICÞβ13þε
y¼
X
yi MMA
!
yadj¼yþe e¼y−^y
y
practice¼
X
yadji
X
MMAi !
for each practice
yhsa ¼
X
yadji
X
MMAi !
for the practices in each HSA
ystatewide¼
X
yadji
X
MMAi !
for all members equals the grand meanð Þ
αis the intercept
εis the error term
ŷis the predicted value from the regression model for each member
eis the residual
MMAis the average enrollment for each participant (i.e., the cumulative member months of enrollment during the year divided by 12)
Subscriptiindicates a value for an individual member
For practice-level reporting, 95% confidence intervals were generated based on the standard error of the mean. For utilization measures (e.g., inpatient hospitalizations), the Poisson distribution was utilized. The outlier cap-ping and risk-adjustment models were run separately for each individual expenditure and utilization measure re-ported to practices.
Outcome measures
Blueprint practice profiles reported included 27 expend-iture, 15 utilization, 10 HEDIS, and 5 additional National Quality Forum (NQF) endorsed measures. This study fo-cused on four measures for the adult and pediatric prac-tice reporting: (1) total expenditures per capita, (2) total expenditures per capita excluding SMS, (3) total Re-source Use Index excluding SMS, and (4) a quality com-posite measure constructed from HEDIS measures (described below). Total expenditures were based on the allowed amount on claims, which includes both the plan payments and the member’s out-of-pocket payments (i.e., deductible, coinsurance, and copayment). For en-hanced expenditure parity across payers, an additional total expenditures measure — this time excluding SMS costs — was also examined. Within the Medicaid popu-lation, SMS represented 26% of adult Medicaid popula-tion expenditures and 61% of pediatric Medicaid population expenditures.
Because pricing and reimbursement can vary, total expenditure measures do not provide a measure of actual consumption of resources (i.e., the actual fre-quency and intensity of all services used). Therefore, Blueprint used a measure of overall resource use: the total Resource Use Index (RUI), which is based on the NQF-endorsed measure (NQF #1598) Total Care Relative Resource Values (TCRRVs). The measure was implemented by applying HealthPartners’ Total Cost of Care (TCOC) software to the claims data [23]. The resulting standardized relative RUI was in-cluded to measure aggregate resource consumption across all components of care (i.e., inpatient, out-patient facility, professional, and pharmacy). The RUI for each practice was calculated by dividing the ad-justed TCRRV rate by the statewide TCRRV rate.
Since the TCRRVs do not include many of the spe-cial Medicaid services, these services were excluded from the RUI.
Effective and preventive care measures were produced by applying NCQA HEDIS specifications to the APCD data. A composite adult measure was constructed at the practice level using the practice average for three HEDIS measures: comprehensive diabetes care hemoglobin A1c testing, breast cancer screening, and imaging studies for low back pain. A composite pediatric measure was constructed using the practice average for three HEDIS measures: well-child visits, appropriate testing for pharyngitis, and appropriate treatment for upper respiratory infection. These measures were a subset of six adult and four pediatric HEDIS mea-sures available in the profile data and were selected based on sufficient sample size at the practice level for statistical reliability and to ensure that no focus area was over-weighted (e.g., limiting cancer screening measures to a sin-gle measure). Rates for HEDIS measures were not risk adjusted, and NCQA provides no recommendations for risk adjustment.
Comparing risk-adjustment models
The following risk-adjustment models were compared:
No adjustment
Age and gender (no interaction)
Age and gender (no interaction) and CRGs
Full model (includes age, gender, CRGs, maternity, and payer-specific variables)
At the patient level, the percentage of variance ex-plained by each model was evaluated using the re-gression r2. The relative difference between models was evaluated using the log-likelihood ratio test. At the practice level, each model’s results were evaluated using the coefficient of variation (CV).
Results
During 2014, an average of 283,153 adult patients and 78,162 pediatric patients were attributed to patient-centered medical homes in the Blueprint program. Blue-print delivered 102 adult and 56 pediatric comparative primary care practice profiles to medical homes that met a minimum volume threshold of 300 patients.
Practice-level variation in demographic, health status, & payer predictors
Results revealed substantial variation across Blueprint primary care practices regarding payer mix, demograph-ics, and health status of the patient population. Tables 1 and 2 provide descriptive statistics for the adult and pediatric populations including mean and range of prac-tice size, age, and proportions for gender, CRGs, targeted chronic conditions, maternity status (adult only, Table 1), and Medicaid and Medicare status. The results also de-scribe practice-level variation. Based on coefficients of variation, practices in the adult population varied less on age (9.8) and more on patients with maternity (81.6), special Medicaid services (67.0), Medicare dual-eligible status (48.3), and significant chronic conditions CRG (42.4) (in descending order). For the pediatric popula-tion, practices varied less on age (8.4) and more on sig-nificant chronic conditions CRG (46.9) special Medicaid services (35.2), patients with Medicaid (27.7), and chronic conditions CRG (24.5) (in descending order).
Comparing risk-adjustment models
Comparative results for each risk-adjustment model are provided in Table 3. The model for total expenditures
for the adult population resulted in an r2of 0.028 when adjusted for only age and gender. The r2 increased to 0.265 with the addition of CRGs and to 0.293 in the full model. A similar pattern for the r2was found for expen-ditures excluding SMS and for total resource use exclud-ing SMS. The log-likelihood ratio test indicated that the model differences were statistically significant. For total expenditures at the practice level for the adult popula-tion, the no-adjustment model had the highest practice-level variation as measured by the coefficient of variation (18.5) compared to the age and gender model (14.8); the age, gender, and CRG model (13.0); and the full model (11.7). Again, a similar pattern for the CV was found for expenditures excluding SMS and for total resource use excluding SMS.
[image:6.595.66.540.397.664.2]The model for total expenditures for the pediatric population resulted in an r2 of 0.008 when adjusted for only age and gender. The r2increased to 0.253 with the addition of CRGs and to 0.352 in the full model. A simi-lar pattern was found for expenditures excluding SMS and total resource use excluding SMS. As with the adult comparisons, the log-likelihood ratio test for pediatrics indicated that the model differences were statistically significant. For total expenditures at the practice level
Table 1Vermont Blueprint for Health Practice Variation in Demographics, Health Status, & Payer Mix–Adult Population, CY2014
Metric Patient-Level Variation (N= 283153) Practice-Level Variation (N= 102)
Mean Mean SD CV Median IQR (25%) IQR (75%) Min. Max.
Practice Size N/A 2699.7 2010.2 74.5 2233.0 1272 3578 352 10756
Age (in Years) 50.0 52.0 5.1 9.8 51.7 49.1 53.5 40.1 67.7
Gender = Male 45.1% 44.9% 7.1% 15.9 46.1% 42.3% 48.7% 9.3% 58.6%
Clinical Risk Group
Healthy Reference group
Acute/Minor 19.9% 19.7% 2.5% 12.5 19.8% 18.3% 21.1% 13.2% 26.2%
Chronic 24.1% 24.8% 3.9% 15.5 25.0% 22.5% 27.0% 14.5% 35.4%
Significant chronic 12.4% 13.4% 5.7% 42.4 12.5% 9.7% 15.0% 2.1% 36.3%
Cancer or catastrophic 1.4% 1.5% 0.7% 43.5 1.4% 1.2% 1.7% 0.0% 4.3%
Targeted chronic conditions 43.9% 44.8% 8.0% 17.8 44.9% 39.7% 49.9% 17.6% 65.5%
Maternity 1.6% 1.5% 1.3% 81.6 1.3% 1.0% 1.7% 0.0% 10.8%
Medicaid 18.8% 19.0% 9.1% 48.1 18.4% 13.0% 25.7% 1.0% 47.6%
Special Medicaid services 3.8% 3.6% 2.4% 67.0 3.2% 2.2% 4.9% 0.0% 14.9%
Medicare 26.3% 29.2% 11.2% 38.3 28.8% 23.9% 34.3% 0.0% 63.3%
Medicare dual eligible 6.3% 6.8% 3.3% 48.3 6.9% 4.6% 8.9% 0.0% 15.1%
Medicare disabled 6.8% 7.2% 3.1% 43.6 7.0% 5.2% 9.0% 0.0% 15.9%
Medicare End-Stage Renal Disease (ESRD) 0.08% 0.08% 0.09% 109.3 0.06% 0.00% 0.11% 0.00% 0.48%
All percentages use the whole population as denominator and are not specific to payer (e.g., Special Medicaid Services for Medicaid). Examples of special Medicaid services include patients receiving day treatment, residential treatment, case management services, and special school services covered by the Department of Education. Clinical Risk Groups utilize a hierarchy to classify a patient into one and only one CRG for the year. Example conditions include Acute or Minor Chronic (e.g., acute ear, nose or throat condition or minor join pain), Moderate Chronic (e.g., diabetes or moderate chronic joint pain), Significant Chronic (e.g., diabetes with other comorbid conditions such as CHF or COPD), and Cancer or Catastrophic (e.g., malignant breast cancer, HIV, cystic fibrosis, muscular dystrophy, quadriplegia). Target Conditions include asthma, chronic obstructive pulmonary disease, congestive heart failure, ischemic heart disease, hypertension, depression, diabetes, and attention deficit disorder
for the pediatric population, the no-adjustment model had a higher CV (23.4) compared to the full model (11.4). Again, a similar pattern for the CV was found for expenditures excluding SMS and for total resource use excluding SMS.
The HEDIS composite measures were not risk ad-justed. The practice-level coefficient of variation for the adult (5.4) and pediatric (7.8) populations were both lower than variation in the expenditure or RUI measures.
Primary care practice-level variation & associations
Compared with the no-adjustment model, the full model showed reduced variation at the practice level. For the adult population, the practice-level range in per person annual expenditures without adjustment ($3506–$13,056) was reduced in the full model ($5113–$9666). For the pediatric population, the same trend held true, with the practice-level range in per-person annual expenditures without adjustment ($1112–$2193) demonstrating a re-duction in the full model ($1331–$2002).
When stratifying the practices’average per person an-nual expenditures excluding SMS into quintiles for both the adult and pediatric populations, the results (Table 4) demonstrated a reduction in the variability between practices in the full model compared to the no-adjustment model. Comparing the first (i.e., the lowest average annual expenditures) and fifth (i.e., the highest average annual expenditures) quintiles, the full model decreased the range by $1335 (37%) for the adult
population practices and by $238 (37%) for the pediatric population practices relative to non-risk-adjusted rates. In addition, a large proportion of practices shifted into a different expenditure quintile in the full model com-pared to no adjustment–77% for adult population prac-tices and 54% for pediatric population pracprac-tices.
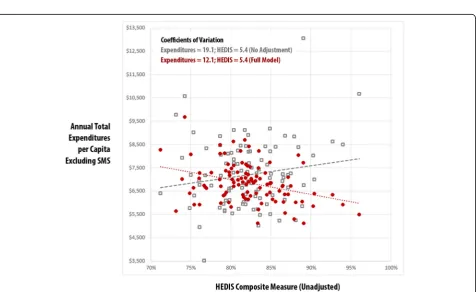
Using the practice-level risk-adjusted expenditures, total Resource Use Index (RUI) rates, and HEDIS com-posite measures, Figs. 1, 2, 3 and 4 compare practice-level variation between the no-adjustment and full models.
Figure 1 displays the adult population’s practice-level association between total expenditures per capita and total Resource Use Index (both excluding SMS). As mea-sured by the practice-level coefficient of variation, there was less variation in the full model adjustment for ex-penditures (12.1 vs. 19.1) and RUI (11.5 vs 22.4). The re-sults also indicate that utilization is significantly associated with expenditures at the practice level for the full model (r2.83,p< .001).
[image:7.595.63.538.100.293.2]Figure 2 displays the adult population’s practice-level association between the HEDIS composite meas-ure and Total Expenditmeas-ures Per Capita Excluding SMS. Because the HEDIS composite is not risk ad-justed the coefficient of variation (5.4) was identical for both models. While the no-adjustment model in-dicated a moderate positive association between HEDIS composite, the full model indicated a negative association between HEDIS composite and expendi-tures (r2 .12, p< .001). This underscores the potential
Table 2Vermont Blueprint for Health Practice Variation in Demographics, Health Status, & Payer Mix–Pediatric Population, CY2014
Metric Patient Level (N= 78162) Practice-Level Variation (N= 56)
Mean Mean SD CV Median IQR (25%) IQR (75%) Min. Max.
Practice size NA 1264.7 1109.7 87.7 880.5 455 1678 317 5303
Age (in years) 9.1 9.4 0.8 8.4 9.3 8.7 10.1 7.7 11.1
Gender = Male 51.2% 51.0% 2.4% 4.8 51.1% 49.6% 52.8% 44.9% 55.4%
Clinical risk groups
Healthy Reference group
Acute/Minor 15.8% 16.1% 2.1% 12.7 16.1% 15.0% 17.4% 10.9% 21.0%
Chronic 8.8% 8.6% 2.1% 24.5 8.3% 7.2% 9.6% 5.0% 16.6%
Significant chronic 1.1% 1.0% 0.5% 46.9 1.0% 0.6% 1.3% 0.2% 2.3%
Cancer or catastrophic 0.2% 0.2% 0.1% 92.4 0.1% 0.0% 0.3% 0.0% 0.7%
Targeted chronic conditions 20.0% 20.2% 3.9% 19.3 19.9% 17.5% 22.9% 12.2% 30.3%
Medicaid 53.8% 54.3% 15.0% 27.7 56.6% 43.6% 64.8% 24.8% 82.9%
Special Medicaid services 18.1% 18.3% 6.4% 35.2 18.3% 13.2% 22.0% 6.9% 33.4%
All percentages use the whole population as denominator and are not specific to payer (e.g., Special Medicaid Services for Medicaid). Examples of special Medicaid services include patients receiving day treatment, residential treatment, case management services, and special school services covered by the Department of Education. Clinical Risk Groups utilize a hierarchy to classify a patient into one and only one CRG for the year. Example conditions include Acute or Minor Chronic (e.g., acute ear, nose or throat condition or minor join pain), Moderate Chronic (e.g., diabetes or moderate chronic joint pain), Significant Chronic (e.g., diabetes with other comorbid conditions such as CHF or COPD), and Cancer or Catastrophic (e.g., malignant breast cancer, HIV, cystic fibrosis, muscular dystrophy, quadriplegia). Target Conditions include asthma, chronic obstructive pulmonary disease, congestive heart failure, ischemic heart disease, hypertension, depression, diabetes, and attention deficit disorder
for differential interpretation of results when risk-adjustment is applied. In this case, using the full model suggests the possibility that practices with im-proved higher HEDIS composite score had lower expenditures.
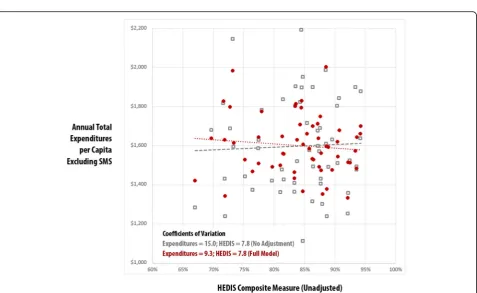
Figures 3 and 4 display no-adjustment and full-model adjustment results at the practice level for the pediatric population. Like the adult population, there
[image:8.595.60.537.107.423.2]was less variation in in the full model than the no adjustment model in the coefficient of variation for expenditures (9.3 vs. 15.0) and RUI (9.0 vs 17.0) and strong association between utilization and expendi-tures in the full model results (r2 .67, p< .001). Unlike the adult model, no association between HEDIS com-posite and expenditures was found in the full model results (r2.01, p= .458).
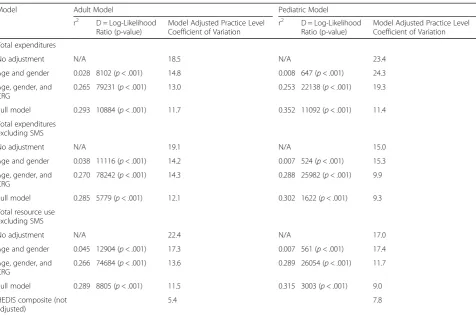
Table 3Vermont Blueprint for Health Risk-Adjustment Model Comparisons & Resulting Practice Level Coefficient of Variation, CY2014
Model Adult Model Pediatric Model
r2 D = Log-Likelihood
Ratio (p-value)
Model Adjusted Practice Level Coefficient of Variation
r2 D = Log-Likelihood
Ratio (p-value)
Model Adjusted Practice Level Coefficient of Variation Total expenditures
No adjustment N/A 18.5 N/A 23.4
Age and gender 0.028 8102 (p< .001) 14.8 0.008 647 (p< .001) 24.3
Age, gender, and CRG
0.265 79231 (p< .001) 13.0 0.253 22138 (p< .001) 19.3
Full model 0.293 10884 (p< .001) 11.7 0.352 11092 (p< .001) 11.4
Total expenditures excluding SMS
No adjustment N/A 19.1 N/A 15.0
Age and gender 0.038 11116 (p< .001) 14.2 0.007 524 (p< .001) 15.3
Age, gender, and CRG
0.270 78242 (p< .001) 14.3 0.288 25982 (p< .001) 9.9
Full model 0.285 5779 (p< .001) 12.1 0.302 1622 (p< .001) 9.3
Total resource use excluding SMS
No adjustment N/A 22.4 N/A 17.0
Age and gender 0.045 12904 (p< .001) 17.3 0.007 561 (p< .001) 17.4
Age, gender, and CRG
0.266 74684 (p< .001) 13.6 0.289 26054 (p< .001) 11.7
Full model 0.289 8805 (p< .001) 11.5 0.315 3003 (p< .001) 9.0
HEDIS composite (not adjusted)
5.4 7.8
The r2
[image:8.595.59.539.593.688.2]represents the percentage explained by the model at the patient level. The mode-adjusted practice-level coefficient of variation represents the degree of variability in rates between practices at the practice level, with a lower value indicating reduced variation
Table 4Vermont Blueprint for Health Practice-Level Comparison of Mean Total Expenditures Excluding Special Medicaid Services (SMS)–No Adjustment vs. Full Model, CY2014
Total Expenditures Excluding Special Medicaid Services (SMS)–Quintiles
Adult Practices (N= 102) Pediatric Practices (N= 56)
No-Adjustment Mean Full-Model Mean No-Adjustment Mean Full-Model Mean
1 $5555 $5812 $1301 $1415
2 $6464 $6424 $1454 $1517
3 $7093 $6823 $1578 $1596
4 $7886 $7189 $1738 $1664
5 $9179 $8101 $1949 $1825
Fig. 1Vermont Blueprint for Health Practice-Level Comparison: Total Expenditures vs. Total Resource Use Index (RUI) Excluding Special Medicaid Services (SMS)–Adult, No Adjustment vs. Full Model, CY2014
[image:9.595.60.539.86.367.2] [image:9.595.62.539.411.703.2]Fig. 3Vermont Blueprint for Health Practice-Level Comparison: Total Expenditures vs. Total Resource Use Index (RUI) Excluding Special Medicaid Services (SMS)–Pediatric, No Adjustment vs. Full Model, CY2014
[image:10.595.59.539.85.366.2] [image:10.595.61.539.410.703.2]Discussion
This study assessed risk-adjustment models in support of a “whole-population” approach to measuring and comparing healthcare expenditures and utilization at the practice level. The findings suggest that a more complete risk-adjustment model is appropriate for all-payer, “whole-population” analytics when comparing outcomes at the practice level; this study’s results are in line with a limited number of studies that support the need for risk adjustment. Pope, et al. demonstrated the importance of adjusting for additional variables beyond age and gender for improving the prediction of expenditures [24] However, that study was limited to Medicare data. Another study concluded that risk-adjusted performance measures based on multi-payer claims data were feasible for the assessment of per-formance and bundled payments to medical homes [25]. Additional studies that applied and compared robust risk-adjustment methods for “whole popula-tions” were not found, indicating a gap that this paper begins to fill.
This risk-adjustment method has been used in the comparative practice profiles developed by the Blueprint, which evaluates practices’ whole populations relative to other practices and to HSA and state outcomes. Follow-ing the initial work with state stakeholders on the devel-opment of risk-adjustment methods, these profiles, which use the full risk-adjustment model, have been rep-licated semi-annually for several years, consistently yielding similar results for practices.
The adult and pediatric populations were addressed separately due to the differences in the health status, utilization, and expenditure patterns specific to each population. For example, within the pediatric population, more than half of expenditures for the combined com-mercial and Medicaid populations were for special Me-dicaid services (SMS). It should be noted, however, that while this variable was a significant predictor in the Ver-mont model, coverage of these non-medical social sup-port services may vary by state [26]. Spending on social services and public health as a percent of state gross do-mestic product (GDP) varies significantly by state, with Vermont ranking highest in the country based on a re-cent study [27].
Practice-level results indicated that practices varied significantly in patient demographics, health status, and payer mix, so additional payer-specific factors were included in the model to control for these factors. Risk-adjusting for these differences reduced the variability between practices in reported expenditures and total re-source use measures. As measured by r2
and the log-likelihood ratio test, the predictive ability of the full model over the no-adjustment and simpler models was demonstrated. Measured at the practice level by the
coefficient of variation, the reduction in variation be-tween practices using the full model was substantial. For the adult population, a modest practice-level association between higher composite HEDIS preventive and effect-ive care measures and lower per capita expenditures was found for the full-model results but not for the no-adjustment model.
The Blueprint primary care practice profiles are dis-seminated semi-annually to participating practices. While practice-specific results have not been made pub-licly available to date, the profiles have provided a tool for the Blueprint program and participating practices to understand expenditure, utilization, and quality of care outcomes relative to other practices in their HSA and across the state. The profiles have contributed to a new level of dialogue and data use across practices and orga-nizations and are routinely used to guide quality and co-ordination initiatives in each HSA.
This study used a parsimonious model. Additional so-cioeconomic factors (e.g., housing, income, race, ethni-city, etc.) as well as self-reported health status may improve the model, but were not available in the APCD. A practice’s percent Medicaid served as a proxy for the socioeconomic status of patients in the practice. This paper reports actual payments (i.e., allowed amount) which may be subject to regional variation in prices [28] and a Resource Use Index that is a price-neutral com-parison of resource consumption.
A sample of HEDIS measures were selected for this study to create a simple, overall composite measure. The purpose of this study was not to examine a larger sam-pling of quality measures, but instead to evaluate and demonstrate that there can be a change in the relation-ship between quality and expenditure measures when risk adjustment is applied to the expenditure measures. Strong correlations between quality measures and ex-penditure measures also were not found in other studies [29]. Debate continues at the national level as to whether effective and preventive care quality measures should be risk adjusted. Since these measures represent recommended care according to clinical guidelines, the case can be made to not risk-adjust these measures in a “whole-population”system.
This was a quantitative study. Formal qualitative re-search to use focus groups, interviews, or survey prac-tices to determine their perspectives on what other drivers of differences between high-cost practices versus low-cost practices may prove beneficial.
Conclusions
This study demonstrated the feasibility of combining populations covered by commercial, Medicaid, and Medicare into a single “whole-population” measure-ment system. The study demonstrated that primary care practices varied significantly in demographics, health status, payer mix, and patients receiving social support services from Medicaid for their adult and pediatric populations. It also indicated that an en-hanced risk-adjustment model improved the predictive power and reduced practice-level variation for total expenditure and utilization measures reporting, which has helped to gain acceptance among providers and other stakeholders in contrast to single-payer reports on practice subpopulations. In light of efforts taking place across the United States to move towards an ac-countable health system, the“whole-population” measure-ment approach may have value to accountable care organizations, policymakers, and consumers alike.
Abbreviations
ACO:Accountable care organization; APCD: All-payer claims database; BCS: Breast cancer screening; CDC: Comprehensive diabetes care; CHF: Congestive heart failure; CMMI: Center for Medicare & Medicaid Innovation; CMS: U.S. Centers For Medicare & Medicaid Services; COPD: Chronic obstructive pulmonary disease; CPC+: Comprehensive Primary Care Plus; CPCi: Comprehensive Primary Care initiative; CRG: 3M Clinical Risk Group; CV: Coefficient of variation; CWP: Appropriate Testing for Children With Pharyngitis (an NCQA HEDIS measure); E&M: Evaluation and Management; ESRD: End-stage renal disease; GENMOD: Generalized Linear Model Analysis; HCC: Hierarchical Clinical Classification; HEDIS: Healthcare Effectiveness Data and Information Set; HSA: Health service area; IQR: Interquartile range; LBP: Use of Imaging Studies for Low Back Pain (an NCQA HEDIS measure); MAPCP: Multi-Payer Advanced Primary Care Practice; NCQA: National Committee for Quality Assurance; NQF: National Quality Forum; PCMH: Patient-centered medical home; RUI: Resource Use Index; SAS: Statistical Analysis System; SD: Standard deviation; SIM: State Innovation Model; SMS: Special Medicaid services; TCOC: Total Cost of Care; TCRRV: Total Care Relative Resource Value; URI: Appropriate Treatment for Children with Upper Respiratory Infection (an NCQA HEDIS measure); VHCURES: Vermont Health Care Uniform Reporting & Evaluation System
Acknowledgements
The authors would like to thank Jeff Spaulding at Onpoint Health Data for final editing of the manuscript.
Funding
This work was funded by the Blueprint for Health program, which is based in the Department of Vermont Health Access. The Blueprint for Health program is a state-based program established in statute with responsibility to help lead statewide delivery system and multi-insurer payment reforms, with an emphasis on prevention and continuous quality improvement. The program’s budget is funded annually through an appropriation in the Vermont state budget. The co-authors on this paper that are employed as part of the Blueprint program were directly involved in the design of the study, the development of Vermont’s data infrastructure, the collection of data used for the study, and the writing of the manuscript.
Availability of data & materials
Data generated during the study are subject to a data-sharing mandate and are available in Vermont’s all-payer claims database, the Vermont Health Care Uniform Reporting & Evaluation System (VHCURES), a public repository that does not issue data sets with digital object identifiers. Patient-level or primary care practice-level data used in this study are not publicly available. Practice-level data summarized at the regional level (i.e., health service area) in Vermont using the same methods described in this study are available at the Blueprint for Health website.
Authors’contributions
KF was the primary author of this manuscript and worked on the
development of the risk-adjustment methodology. DG provided consultation services regarding the development of the risk-adjustment methodology and provided input on the analysis and writing of this manuscript. MP, DJ, and AK worked on generating the measures and practice-level risk-adjust-ment rates used in this study. CJ, MM, and TT contributed to the struc-ture and writing of the manuscript and continue to lead the effort to develop and disseminate the practice profiles described in this study to primary care medical home practices in Vermont. All authors read and approved the final manuscript.
Competing interests
The authors declare that they have no competing interests.
Consent for publication Not applicable.
Ethics approval and consent to participate Not applicable.
Author details
1Onpoint Health Data, 254 Commercial Street, Suite 257, Portland, ME 04101,
USA.2Vermont Blueprint for Health, 280 State Dr. Waterbury, Vermont 05671, USA.3U.S. Department Health and Human Services, Vermont Blueprint for
Health. Office of the National Coordinator for Health Information Technology, 330 C Street, SW; Floor 7, Washington, DC 20024, USA.4The Dartmouth
Institute for Health Policy and Clinical Practice, Dartmouth Hitchcock Medical Center, Lebanon, NH 03766, USA.
Received: 3 August 2016 Accepted: 12 January 2017
References
1. Institute for Healthcare Improvement. IHI triple aim initiative. http://www.ihi. org/engage/initiatives/tripleaim/pages/default.aspx. Accessed 9 Oct 2016. 2. U.S. Centers for Medicare & Medicaid Services. Innovation models. https://
innovation.cms.gov/initiatives/index.html#views=models. Accessed 5 July 2016.
3. Sessums LL, McHugh SJ, Rajkumar R. Medicare’s vision for advanced primary care: New directions for care delivery and payment. JAMA. 2016;315(24): 2665–6. doi:10.1001/jama.2016.4472.
4. U.S. Centers for Medicare & Medicaid Services. State Innovation Models initiative: General information. https://innovation.cms.gov/initiatives/State-Innovations. Accessed 5 July 2016.
5. U.S. Centers for Medicare & Medicaid Services. Advance Payment ACO model. https://innovation.cms.gov/initiatives/Advance-Payment-ACO-Model. Accessed 5 July 2016.
6. APCD Council. Interactive state report map. https://www.apcdcouncil.org/ state/map. Accessed 5 July 2016.
7. APCD Council. APCD legislation by state. https://www.apcdcouncil.org/ apcd-legislation-state. Accessed 5 July 2016.
8. National Committee for Quality Assurance. HEDIS & quality measurement: Other measurement activities - Pay for performance. http://www.ncqa.org/ HEDISQualityMeasurement/OtherMeasurementActivities/PayforPerformance. aspx. Accessed 5 July 2016.
10. Welch HG, Miller ME, Welch WP. Physician orofiling - An analysis of inpatient practice patterns in Florida and Oregon. N Engl J Med. 1994;330:607–12. doi:10.1056/NEJM199403033300906.
11. Thomas JW, Grazier KL, Ward K. Economic profiling of primary care physicians: consistency among risk-adjusted measures. Health Serv Res. 2004;39(4 Pt 1):985–1003. doi:10.1111/j.1475-6773.2004.00268.x. 12. Huang IC, Frangakis C, Dominici F, Diette GB, Wu AW. Application of a
propensity score approach for risk adjustment in profiling multiple physician groups on asthma care. Health Serv Res. 2005;40(1):253–78. doi:10. 1111/j.1475-6773.2005.00352.x.
13. Adams JL, Mehrotra A, Thomas JW, McGlynn EA. Physician cost profiling -Reliability and risk of misclassification. N Engl J Med. 2010;362(11):1014–21. doi:10.1056/NEJMsa0906323.
14. Auerbach BS, Bell K, Bloomberg M, et al. Principles for profiling physician performance. The Health Report from the Publishers of the NEJM. Waltham: Massachusetts Medical Society; 1999. ISBN 0-910133-42-5.
15. American Academy of Family Physicians. Physician profiling, guiding principles. http://www.aafp.org/about/policies/all/physician-profiling.html. Accessed 5 July 2016.
16. 2015 annual report. Vermont Blueprint for Health. http://blueprintforhealth. vermont.gov/sites/blueprint/files/BlueprintPDF/AnnualReports/Vermont-Blueprint-for-Health-2015-Annual-Report-FINAL-1-27-16.pdf. Accessed 9 Oct 2016. 17. Green Mountain Care Board. Vermont Blueprint for Health hospital service
area (HSA) healthcare data profiles. http://blueprintforhealth.vermont.gov/ reports_and_analytics/hospital_service_area_profiles. Accessed 5 July 2016. 18. Winkelman R, Mehmud S. A comparative analysis of claims-based tools for health
risk assessment. Society of Actuaries. 20 April 2007. https://www.soa.org/research/ research-projects/health/hlth-risk-assement.aspx. Accessed 9 Oct 2016. 19. D’Angelo D, Williams L, Morrow B, et al. Preconception and interconception
health status of women who recently gave birth to a liveborn infant -Pregnancy Risk Assessment Monitoring System (PRAMS), United States, 26 reporting areas, 2004. MMWR Surveill Summ. 2007;56(10):1–35. 20. D’Angelo D, Williams L, Harrison L, Ahluwalia I. Health status and health
insurance coverage of women with live-born infants: An opportunity for preventive services after pregnancy. Matern Child Health J. 2012; 16(0 2): 222–230. doi: 10.1007%2Fs10995-012-1172-y.
21. U.S. Centers for Disease Control and Prevention. PRAMS and smoking. http://www.cdc.gov/prams/tobaccoandprams.htm. Accessed 5 July 2016. 22. Johnson K. Addressing women’s health needs and improving birth
outcomes: Results from a peer-to-peer state Medicaid learning project. Issue Brief (Commonw Fund). 2012;21:1–19.
23. HealthPartners. Total Cost of Care. https://www.healthpartners.com/public/ tcoc. Accessed 5 July 2016.
24. Pope GC, Kautter J, Ellis RP, Ash AS, et al. Risk adjustment of Medicare capitation payments using the CMS-HCC model. Health Care Financ Rev. 2004;25(4):119–41. https://www.ncbi.nlm.nih.gov/pubmed/15493448. Accessed 9 Oct 2016.
25. Ash AS, Ellis RP. Risk-adjusted payment and performance assessment for primary care. Med Care. 2012;50(8):643–53. https://www.ncbi.nlm.nih.gov/ pmc/articles/PMC3394905/. Accessed 9 Oct 2016.
26. The Henry J. Kaiser Family Foundation. State health facts: Medicaid benefits data collection. http://kff.org/data-collection/medicaid-benefits. Accessed 5 July 2016. 27. Bradley E, Canavan M, Rogan E, et al. Variation in health outcomes: The role
of spending on social services, public health, and health care, 2000–09. Health Aff. 2016;35(5):760–8. doi:10.1377/hlthaff.2015.0814.
28. Franzini L, White C, Taychakhoonavudh S, Parikh R, Zezza M, Mikhail, O. Variation in inpatient hospital prices and outpatient service quantities drive geographic differences in private spending in Texas. HSR, 49: 1944–1963. doi: 10.1111/1475-6773.12192.
29. Yasaitis L, Fisher ES, Skinner JS, et al. Hospital quality and intensity of spending: Is there an association? Health Aff (Millwood). 2009;28(4):w566– 72. doi:10.1377/hlthaff.28.4.w566. Epub 2009 May 21.
30. Wennberg JE, Staiger DO, Sharp SM, Gottlieb DJ, et al. Observational intensity bias associated with illness adjustment: Cross sectional analysis of insurance claims. BMJ. 2013. 346 :f549. http://www.bmj.com/content/346/ bmj.f549. Accessed 9 Oct 2016.
• We accept pre-submission inquiries
• Our selector tool helps you to find the most relevant journal • We provide round the clock customer support
• Convenient online submission • Thorough peer review
• Inclusion in PubMed and all major indexing services • Maximum visibility for your research
Submit your manuscript at www.biomedcentral.com/submit