THE PRO-t
-
CON PROJECT
THE
D
EVELOPMENT OF
A
SYSTEM FOR
CONTINUOUS PROCESS IMPROVEMENT USING
PRO-t-CON PROCESS OPTIMISATION
SOFTWARE
AT
AEP FILMPAC LTD.
A thesis
submitted
tothe Faculty of Technology and Engineering, Massey
University, in partial fulfilment of
the requirements for the degree of
Master of Technology
In
Quality Systems.
Paul I
<enneth Moynagh
ABSTRACT
This project details the work done to develop a methodology for process improvement at AEP Filmpac in Auckland, New Zealand. The company had purchased a process
optimisation software package called Pro-t-con which they intended to use to improve the operating conditions for each product on each machine in the plant. Early use of the Pro+con software produced a number of questions as to its ability to optimise processes
as effectively as expected. Thus research was done to test the effectiveness of the package and analyse its strengths and weaknesses. The results of this work suggest that Pro-t-con although very easy to use is limited in its ability to effectively optimise processes. Statistically it lacks the rigor of Classical and Taguchi design of experiment
methods and cannot resolve processes with interactions or non-linear factors.
At the outset of the project the plant did not possess a system for suitably storing and
retrieving machine set-up information, thus any improvements made to the settings one day would not be available for use the next time that product was run. Consequently in
order to longitudinally develop process settings it was also necessary to develop a setting sheet system to support the process improvement initiatives.
The combination of a methodology for continuously improving processes and one for actually undertaking experiments to exploit such a process produced a coherent 10 step
DECLARATION
I declare that this is my own, unaided work. It is being submitted in partial fulfilment of
the requirements for the degree of Master of Technology at Massey University. It has not
been submitted before for any degree or examination in any other University.
Paul Kenneth Moynagh
This
Twentieth day of October 2000
,-\CKl"\J O\'\'.LEDGEMENTS
Thanks to,
The Foundation for Research Science and Tcchnolo,gy for funding under the
Graduate in Industry Fellowship (GRIF) Program.
AEP Industries Australasia in particular AEP Filmpac, Auckland
J\like Mason, company supervisor
Mr Alan Wright, first academic supervisor
Mr Tom Robertson, second academic supervisor.
The staff of the AEP plants visited in particular those 111 extrusion at AEP
CONTENTS
ABSTRACT ... 2
Declaration ... 3
Acknowledgements ... 3
1.0-INTRODUCTION ..... 9
1.1 J,Jlhy Pro-t-con? ......... 9
1.2 Aims ... 10 1.3 Objectives .................... 10
1.4 Thesis Structure .................... 11
1.5 Background ...................................... 12
1.1.1: Company History ... 12
1.1.2: Competitors ... 13
1.1.3: Sales Initiatives ... 13 1.1.4: Company Performance ... 13
1.1.5 Machinery ... 15
1.1.6: Work force ... 16
1.1.7: Work Order System ... 16
1.1.8: A Tangled Web of Knowledge ... 17
2.0-LITERATURE REVIEW ......................... 19
2.1 Research Strategy ..................................... 19 2.2 Implementation of Process Improvement Initiatives ... 20
2.3 Process Improvement Methodologies ........... 23
2.3.1: Eight Stages of Knowledge ... 23
2.3.2: A Seven Step Method of Process Improvement ... 24
2.3.3: Upton's 4 Levels of Involvement ... 25
2.3.4: Flow Charts for Process Improvement and Problem Solving ... 28
2.3.5: Goldratts five Steps ... 30
2.3.6: Pro-t-con Methodology ... 30
2.3.7: Taguchi 8 Stage Process ... 31
2.3.8: Summary ... 32
2.4 Statistical Techniques for Process Optimisation ........... 33
2.4.1: Classical Design of Experiments (DoE) ... 35
2.4.2: Response Surface Methodology (RSM) ... 36
2.4.5: Statistical Process Control. ... 40
2.4.6: Pro-t-con ... 41
2.4.7: Summary ... 47
2.5 Blown Film Extrusion Fundamentals . ... 49
2.5.1: The Extrusion Process and Equipment. ... 49
2.5.2: The Extrusion Process ... 53
2.5.3: Fabrication Variables Influence On The Physical Properties of Blown Film ... 54
2.5.4: Resin Properties ... 57
2.5.5: Mechanical Properties and Film Defects ... 59
2.5.6: Palletfast Stretch Cling Film (SCF) Strength Measurement ... 61
2. 6 Conclusions ... 65
3.0-METHODOLOGIES ... 69
3.1 Recommended Method/or Process Improvement (10 Steps) ... 69
3.1.1: Explanation of 10 Step Flow Chart. ... 71
3.1.2 Testing the 10 Step Methodology ... 73
3.2 Setting Sheet System Development (Stage 4) ... 75
3.2.1 The Continuously Improving Setting Sheet System ... 76
3.2.2 Measuring the Effect of the Setting Sheet System ... 76
3.3 Pro-t-con Testing Methodology ... 78
3.3.1 Ability to Do Optimisations ... 79
3.3.2: Pro-t-con Testing Methods ... 81
3.4 Process Measurement Methods ... 82
4.0-ANALYSIS OF THE 10 STEP METHOD ... 85
4.1: Case Studies For Analysis of the 10 Step Process Improvement Method ... 85
4.1.1: Case Study Experiments ... 85
4.1.2: Suggested Improvements to the 10-Step Method ... 92
5.0-SETTING SHEET SYSTEM AT FILMP AC ... 97
5.1 Setting Sheet System ... 97
5.1.1: Environmental Considerations ... 98
5.1.2: Pro-t-con Recording Sheets ... 99
5.1.3: The Operators Role ... 100
5.1.4: The Supervisors Role ... 100
5.1.5: The Administrator ... 101
5.1.6: Work Order System ... 101
5.1.7: The Data Base ... 102
5.1.8: Improving/Updating Setting Sheets ... l 02 5.1.9: The Role of Pro-t-con ... 103
5.1.10: Expected Benefits of the System ... 104
5.3 Testing the System ...... 107
5.3.1: Measuring The Improvement in Performance Due to the System ... 107
5.4 Results ... 108
5.4.1: Financial Effect of the Results ... 11 O 5.5 Discussion .......................................... 111
6.0-ANALYSIS OF PRO-t-CON ...... I 13 6.1 Testing Pro+con Using Known Dummy Processes .................... 113
6.1.1: Non Linear Process ... 113 6.1.2: All Linear Dummy Process ... 121
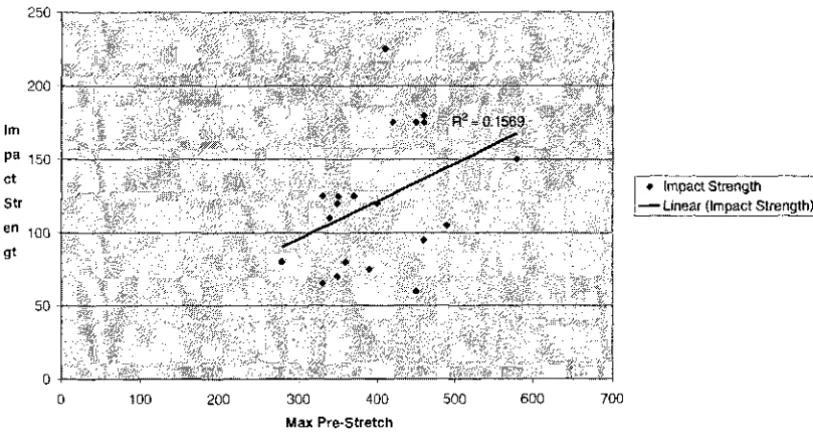
6.2 Palletfast Stretch Cling Film Optimisation (case Study) ....................... 125
6.2.1: Experimental Design ... 125
6.2.2: Confirmatory Experiments ... 127
6.3 Machine C22, Chester Hill Plant, Sydney (Case STudy) ........... 129
6.3.1: Approach ... 129
6.3.2: Regression Analysis ... 130
6.3.3: Results ... 131 6.4 Other Experimental Data Sets ...... 133
6.4.1: Shrink Film Optimisation ... 133
6.4.2: Data sets from Glenvern Associates ... 134
6.5 Critique of Pro-t-con ....................................... 137
6.5.1: Concerning Observations ... 137
6.5.2: Probable Pro-t-con Optimisation Algorithm ... 139
6.5.3: Ability to Do Optimisations ... 139
6.5.4: How Much Information Does Pro-t-con Give? ... 140
6.5.5: Number of Experiments Necessary ... 141 6.5.6: Ease of Use ... 142
6.5.7: Summary of Pro-t-cons Capabilities ... 143
6.6 Discussion ............................ 144
7.0-OVERALL DISCUSSION ...................... 147
7. I. I: A side note ... 150
8.0-CONCLUSIONS .................................. 151
8.1 Further Work ... 152 8.1.1: Filmpac ... 152
1.0-INTRODUCTION
The flexible packaging industry is very competitive. AEP Industries is the second largest manufacturer of flexible packaging products in Australasia. In order to compete effectively in a competitive commodity market it is necessary to not only be better than the competition in the present, but also be better at getting better for the future. There are many initiatives that promote the improvement of a company's competitive advantage, one of the most important of these is continuous processes improvement . The management of AEP Filmpac understood this concept and on the recommendation of AEP Industries International, purchased a process optimisation software tool called "Pro-t-con". The intention was to apply Pro+con to a variety of Filmpac's manufacturing machines in order to identify optimal operating conditions and thus improve their processes. Pro+con came highly recommended by various European plants within the AEP group where it had made significant improvements to their processes in terms of throughput and quality.
This work reports on the development of a system to support Pro+con and investigates the suitability and effectiveness of Pro+con within AEP Filmpac in Auckland.
1.1 WHY PRO-T-CON?
the software would enhance the competitive position and long term viability of the
company by helping to exploit its machinery constraints more effectively.
GS Technology marketed the Pro-t-con software worldwide and approached AEP
Filmpac regarding its purchase. Steve Tilly from GS Technology thus visited Filmpac and
gave a demonstration of the software on Machine 9. He spent three days organising and
conducting experiments with 35 micron Palletfast stretch cling film and achieved a
significant improvement in the machine's output through the study. This confirmed the
value of Pro-t-con for Filmpac and they thus undertook to purchase it.
1.2 AIMS
The aims of this research are to
1) Develop a system for applying PRO-t-CON process optimisation software to the
AEP Filmpac plant.
2) Analyse the performance of the software and system.
3) Make suggestions for the future development of the system and software.
1.3 OBJECTIVES
1) Define the necessary systems and procedures required to achieve a substantial and
permanent improvement in the current machine operating conditions and to enable
continuous improvement to take place
2) Demonstrate, on selected machines, a significant increase in plant output potential
through application of the ideas developed in (1).
3) Demonstrate, on selected machines, the potential of the systems defined in (1) to
reduce variation in machine output and quality.
4) Improve product quality and consistency on the companies' key products.
The establishment of a system for continuous improvement will help to reduce variation
between runs of the same product and longitudinally develop the company's variety of
products. This will make it more difficult for competitors to enter such markets and
them.
A significant increase m output and quality will allow Filmpac to re-evaluate their
products in terms of their competitive dimensions i.e. cost, time, quality and flexibility. A
reduction in process variation will enable better planning of resources and make it easier
to reliably meet customer demands.
The achievement of the above objectives will help the company to maintain and grow
their competitive advantage over other manufacturers in an aggressive market.
1.4 THESIS STRUCTURE
The literature review follows this section and discusses issues relevant for achieving the
project's aims. A brief methodology section follows to describe the project's approach
and introduce the three key areas of work.
1) A 10 step approach to process improvement,
2) The development of a setting sheet system for documenting and saving
machine settings.
3) An analysis of the Pro-t-con software.
1.5 BACKGROUND
AEP Industries NZ Ltd. is a division of AEP Industries Australasia and operates plants
that produce a wide range of flexible packaging products. Blown film extrusion,
flexographic printing, laminating, and bag converting processes are utilised in these
plants.
1.1.1: COMPANY HISTORY
Alex Harvey Industries (AHi)
Filmpac was started in the early 1970's as part of what was then AHI. An amalgamation
of fledgling plastic film manufacturing companies was put together on a new site in Mt
Wellington, Auckland, to form a powerful new company to take advantage of the
growing demand for flexible packaging. AHI Plastic Film Company was born, flexible
packaging was coming of age and waxed paper was a thing of the past. The company
very quickly became a producer of a wide range of products centred on bread packaging,
agricultural films, packaging for New Zealand's primary produce such as meat and butter
and a broad range of industrial packaging products, such as shrink and stretch cling films.
Borden
Through the various mergers and acquisitions that took place, the company grew to be
the largest and most diversified film manufacturing plant in New Zealand. In 1990
Borden, an American based company founded on the food industry, acquired the flexible
packaging division of what was then Printpac UEB.
AEP
In late 1996, AEP Industries Inc. purchased the worldwide packaging group from a
troubled Borden. Three specialised plants were set-up in New Zealand as separate
divisions.
Filmpac focussed on polyethylene and PVC films for general packaging. The emphasis
was on extrusion with flexographic printing and bag making to support it.
Flexipac specialised in printing with strong bag converting capabilities. A small
extrusion operation supported their laminating requirements.
Similar operations were also set up m Sydney and Melbourne to make up the Australasian group.
1.1.2: COivfPETITORS
The flexible packaging industry in New Zealand is extremely competitive. This is
particularly so in the polyethylene films sector that Filmpac operates in. Due to the relatively low cost of entry and the flexibility of film manufacturing, printing and bag
converting processes, it is relatively easy for small companies to enter the market. With a
single extruder, printing press and bag machine a wide range of products can easily be produced.
1.13: S:\LES INITIATIVES
Filmpac has pursued a strategy of being the market leader in many high volume sectors
of the flexible packaging market. In many of these sectors, Filmpac has secured the business of the market leaders and the secondary suppliers, often with sole supply
contracts.
Many of Filmpac's customers are subsidiaries of large multinational organisations. As
such, these companies have access to international benchmark pricing. The
"commodification" of packaging in most cases sees it viewed as a pure expense and an area of focus for companies to cut cost. Over capacity in the flexible packaging industry,
results in most manufacturers being eager to fill this capacity, thus packaging manufacturers are easily played off against each other by their customers.
1.1.4: COt1PANY PERFORMANCE
The following graphs (Figs 1 to 5) show details of the last six years of actual results and a
projection for the year 2000.
Figure 1: Sales Tonnes
8,400
8,200 I..J-- - - ---~!!'!"'---1
8,000
7,800 I.J---- - - -• •t
-7,600
7,400 I..J-- -- - - - ----1~
Figure 2: Sales Revenue - $000
35,000 30,000 25,000 20,000 15,000 10,000 5,000 0
1994 1995 1996 1997 1998 1999 2000
Figure 3: Capital Expenditure - $000
4,000 3,500 3,000 2,500 2,000 1,500 1,000 500 0
1994 1995 1996 1997 1998 1999 2000
Figure 4: Total Employees
160 140 120 100 80 60 40 20 0
1994 1995 1996 1997 1998 1999 2000
Figure 5: Operating EBIT - $000
Figure 5 shows a rapid decline in profitability from 1994 to 1997, this was due to significant increases in raw material costs that were not passed on to customers due to competitive pressures. The company began to downsize and simplify their business while aiming to increase the volume of product made.
1.1.511ACHINERY
Filmpac Auckland is divided into three sections, Extrusion, Printing and Conversion. The extrusion facility consists of nine machines that vary considerably in their capabilities. Two of these machines are three layer co-extrusion lines and the capital spent in 1998 was for the purchase of Machine 1 from Maachi in Italy. This high output line is used to make much of the company's bread, form-fill-n-seal and lamination films. The other seven blown film extruders are mono-layer lines and vary in their use from high output industrial films to low output lamination films. Low Density, Linear Low Density and High Density Polyethylenes are used in these machines which are generally accompanied by a regrinding "Exact" unit for reprocessing trim. Corona treaters are included in six lines to produce a printable surface on the film. Six lines have Weighbatch gravimetric dosing systems and much of the pelletised raw materials are distributed to the machines though a silo system.
The printing facility consists of two high-speed flexographic printing presses (Uteco and Comexi). The eight colour Uteco press was purchased in 1997 to improve the performance of the printing facility as the demand for high quality printing increases. A microdot mounting machine was purchased in 1999 to improve the plate mounting process.
The conversion facility consists of a variety of machines for making bags, perforating, slitting and sealing. Two high speed Amplas Wicketers and one old FMC Wicketer are the backbone of the bread bag manufacturing operation. Two Gunters allow sealing and perforation of anything from rubbish bags to mattress covers. The slitter enables a wide extruded roll to be slit into narrower rolls for use in various products.
1.1.6: WORK FORCE
The work force at Filmpac consists of a variety of skill levels, generally extrusion and conversion operators can be described as unskilled to semi skilled with varying levels of experience and ability with their specific machines. It was decided that the present
experienced operators were incapable of running Machine 1 efficiently so a recent
initiative in extrusion has been to employ qualified electricians to operate this new
co-extrusion line and do small electrical jobs,. This has freed up these experienced operators
for other machines and for training the new electrician operators. Printers are trade qualified, there being two per shift, help is provided by semi skilled print assistants.
The extrusion supervisor manages up to nine operators on an extrusion shift and helps
with machine set-ups and problems. Supervisors have historically been promoted from
good/ experienced operators however recently a new supervisor was appointed from outside the company with no experience in the industry in an effort to broaden the
knowledge base. Conversion is run by team leaders who also operate machines and
Printing is run by the trade qualified team leaders who also run one of the machines. The
plant manager oversees all these.
Because of the continuous nature of the extrusion process the plant must be run 24 hours a day 7 days a week. Filmpac has recently changed from a complicated mixture of
12 and 8-hour shifts to having all production staff on a 12-hour, two days on, two nights
on, four days off shift structure. This requires that there be four shifts in each
department and enables machines to be run more consistently without the need for
significant overtime during busy periods.
1.1.7: WORK ORDER SYSTEM
Jobs are raised by customer service and sales staff in relation to customer requirements. This information is passed on to the planner who raises a work order and plans the product for a specific machine. Work order information is retrieved from MFG. Pro, the company's accounting system, and a work order developed. Work-orders contain important information for running a job including end use, product dimensions, material
and specification details. The work-order print system is a "front end" used by operators and supervisors on the floor for printing out the work orders they are to complete for
work order number.
Runs vary significantly in length but generally the longer the run the better, as set-up
costs become a lower proportion of the total. Often however sales staff promise a
product without consultation with production, this causes an otherwise reasonable job to
be interrupted so that the new one can be done. Consequently production is
characterised by shorter than optimal run lengths and day to day planning. Also as many
products can be made on a variety of the machines and these machines vary in their
output, the time taken to complete an order can vary significantly.
Over one thousand products exist and these are identified by individual item codes. In
many cases products are exactly the same in many dimensions but, for example, a change
in width or roll length will require a new item code.
1.1.8: ,\ TA GLED \X/EB OF KNO\XILEDGE
In the manufacturing area of AEP Filmpac many operators have a note book of settings
and tips for running specific products to help them next time these products are run.
They tend to protect this information, as there is a feeling that it ensures their continued
employment. Anecdotes of operators who have struggled for hours to start up a machine
exist. Occasionally skilled operators are phoned up in the middle of the night to dictate
machine settings over the phone so another shift can get a job going. As there is no
documentation to suggest how the product should be run This produces the situation is
that machines are set differently each time they are run, an obvious special cause that
increases variation in the final product.
Operating staff skill levels are limited, particularly in the area of line optimisation. Staff
training has mostly focussed on the primary job functions of operating machines rather
than on process optimisation and increasing the throughput of the process. Due to
limited formal training and traditional empirical learning styles, the understanding of
process fundamentals and their cause and effects is low. Consequently the settings used
by operators to set up jobs are often far from optimal. No guidelines exist for the
development of these settings and it is up to the operator to set it the way he feels is best.
Depending upon the operator this might mean at a low output and unless the supervisor
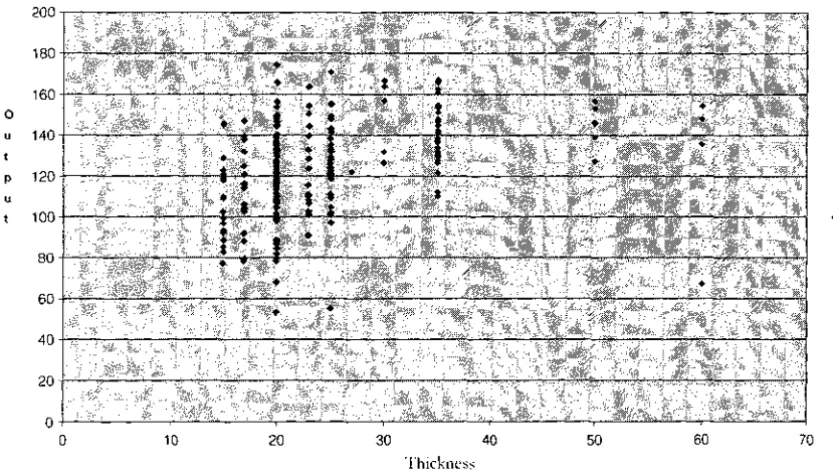
Figure 6: Variation in output between runs of the same product (Machine 9)
200
180
160 0
u 140 p 120
u
t 100
80
60
40
20
10
Output Kg/hr by Thickness for Palletfast (MC 9)
•
20 30 40 50 60 70
Thickness
Figure 6 shows a worrying problem with the output from Machine 9. It can be seen from
the graph that production rates vary from 80kg/hr. to 170 kg/hr. Machine 9, unlike all
other machines in the plant, runs only one type of product (Palletfast stretch cling film
(SCF)) and should therefore be relatively stable in its output. The variation in actual
machine output seen above is likely to be due to a number of factors including: machine
settings, operator ability, running problems, job changes and probably also reporting
errors. This variation makes it very difficult to plan how long each job will take, to
estimate the cost of the job and to guarantee the quality of the product. Such things
frustrate customers, the planning department and the operators themselves as the
decisions based on this poor information produce inaccurate plans, frequent job changes,
poor quality and missed deliveries.
[image:19.569.74.491.118.353.2]2.0-LITERATURE REVIEW
2.1 RESEARCH STRATEGY
The tasks detailed in the research aims suggest a variety of areas to discuss within this
literature review. These are
1) The factors that influence the success of process improvement projects in
industry.
2) The different methods for process improvement in industry.
3) The tools available for process optimisation and experimentation in industry.
4) Methods for objective analysis of the Pro-t-con software/method and the process improvement system developed in 2 above.
The crux of areas one and two was to review papers that made suggestions for improving manufacturing processes, implementing process change, developing systems for process
maintenance, the effect such change has on manufacturing staff and how to get their
support. Ali to enable the development of a suitable system for applying Pro-t-con at Filmpac.
Area three involved a discussion of the options available to industry for experimentation
and optimisation of their machinery and an analysis of how these options fit into a
process of continuous improvement. The focus was on the usability of these techniques,
the information they gave and the number of experiments necessary to get this information.
Many authors suggest that a thorough knowledge of the system to be improved is
essential to experimental efforts, therefore research into the blown film extrusion process was also undertaken.
When aiming to improve a process or system it is important to be able to measure its
2.2 IMPLEMENTATION OF PROCESS IMPROVEMENT INITIATIVES.
Consistent factors in businesses include; [Statistical Methods for Quality, 1997]
1) There are customers.
2) The value chain consists of interconnected processes.
3) Improving the value chain processes is fundamental to being competitive.
The International Quality Study of Management Practices, having examined many
different management practices, found only three to have universal benefit across all the
industries studied. [1v!ahlen, 1993] These were:
1) Widespread deployment of the organisation's strategic plan.
2) The use of formal programs for supplier certification.
3) The use of process improvement practices.
Since this project is interested in the development and application of a process
improvement strategy within AEP Filmpac, research into the factors that influence the
success of such initiatives in manufacturing plants was deemed necessary.
Some of the most poignant comments from the reviewed articles are presented below.
"Top management support affected implementation results" [Sanchez, 1996]
"The existence of a champion to defend the project increases the probability of success"
[[Sanchez, 1996]]
"Training reduces resistance to change and makes workers better prepared to solve problems
that arise, .. . those firms that invested more training hours per worker achieved a higher
increase in production flexibility. " [ [Sanchez, 1996]]
"... it is very important to promote early worker participation during automation because
opposition to technological change reduces productivity and can jeopardise the new
technology. Worker opposition to automation disappears when the workers who are affected
by the automation are consulted or bought into the process before hand". [Sanchez, 1996]
"Focus, accountability, involvement and response to performance are key to getting staff to
buy into a project that affects them. What gets measured gets done. " [Brooks, 1995]
"The new line jobs are direct labour plus a variety of indirect duties ... data recording, data
"Consider the change in self-concept when an operator who has always just chunked out
parts takes on data recording duties. Recording disturbances is what managers and
technicians have always done. The operator thinks; maybe I am now a part of the
management and technical operation of this place." [Schonberger, 1986]
"The most successful programs put the responsibility and leadership in the hands of the
machine operators. The results are as follows: Machine set-up is transformed from skilled to
unskilled work; the set-up persons value shifts from manual skills to mental and problem
solving skills. "[Schonberger, 1986]
"As organisations adapt to SPC, as well as other changes, they will encounter the natural
resistance to change of management and non-management personnel. Organisations with a
long-term perspective will have a better chance of overcoming this resistance" [Keys and
Reding, 1992}
"Using shop floor data collection to monitor production and improve planning can result in
significant reductions in lead times and work in progress. For more fundamental gains, the
task for manufacturing managers is to make improvements in the production process itself
-cutting out stages, making machines more efficient or reducing the time it takes to switch the
line from one product to another being obvious examples. Recent research by Custom Micro
Products suggests that using shop floor data collection can help in the effort. Accurate
information from the shop floor is the base of successful process improvement". [ Anon, 1999}
A major issue that appeared in the reviewed articles was that support from the people
who were to be most affected by the change had to be gained early. Authors differed in
their approach to gaining this support, this is likely to be due to the differing
environments such studies were done in. They did however agree that training in the new
way and involvement in its design were critical to successful change. Support from upper
management and the existence of a project champion to defend the project were
considered extremely important. These concepts are supported by the suppliers'
recommendations for the introduction of Pro-t-con and are known by them as the
"Pro-t-con Culture Change". !Lo 1999]
It was clear from the outset that the ma1or barriers to implementation of a process
improvement system at Filmpac were likely to be of a people and organisational nature.
comprehensive system for collecting and analysing data was an early focus. The model
proposed by Upton 19986 was helpful in this regard. The Pro-t-con user manual details
useful suggestions for encouraging the Pro-t-con culture change and recommends the
following ingredients as essential for success of Pro-t-con endeavours. [Lo 1999]
The process is capable of achieving each target on its own or achieving
some targets in groups
Approval and commitment from Management
A Project Team Approach, involving planning, operating & QC personnel
Detail planning of timing, target setting, resource-people & equipment
Adequate resources available for Study
Basic knowledge of process set-up
Equipment and process in standard running conditions (Y ery Important)
Accurate gauges and instrumentation for data collection
Well defined quality standards
Good collection of derivative values for process confirmation
Carefully conducted trial
Carefully conducted validation trial
A report and recommendation for further improvements
Practical considerations relevant to the AEP Filmpac plant were the most important
factors in the design of an approach to using Pro-t-con for process improvement there.
However the suggestions detailed above and found throughout the articles were used
2.3 PROCESS IMPROVEMENT METHODOLOGIES
In order to design a methodology for applying Pro-t-con to the manufacturing plant at AEP Filmpac it is important to understand some of the methods proposed and used by others for process improvement. Authors present process improvement systems that vary in their level of discussion from the management of an overall continuous improvement culture to the actual process of experimentation. Most approaches however involve planning, analysis, design and implementation phases for obvious reasons.
Many of those proposed utilise various tools or techniques such as Design of Experiments (DoE), Statistical Process Control (SPC), Quality Function Deployment
(QFD) or fish bone diagrams. However they often ignore the fact that scientific knowledge development is basically an iterative learning process where each study builds upon the knowledge of those that went before. It helps to view the process of improvement in terms of knowledge development and therefore follow such a progression in this type of work.
2.3.1: EIGHT SL-\GES OF KNO\VLEDGE
Barnes 19976 discusses eight stages of knowledge that a company may go through in understanding their processes and uses a case study on Nabisco biscuits to illustrate them. The stages are
1. Complete Ignorance. No knowledge of the variables that affect the response and one considers all variation to be random. May not even know how to measure the response itself.
2. Awareness. Begin to build a list of the factors that one believes could affect the process. (e.g. ingredients, baking time, weather etc)
3. Learn to Measure Key Variables. Begin to measure the variables that one thinks may affect the response. (e.g. time baking using a watch, measure ingredients using cups, count the number of strokes used in mixing etc.)
5. Process Capability and a Recipe. Work on reducing the variation in key variables
and document a process that gives reasonable results i.e. write down a recipe and
maintain control of all the variables. Cookies should then become more consistent.
6. Process Characterisation. Conduct a series of experiments to discover how certain
variables affect the response so that if a customer wants a sweeter or a lower fat cookie
one knows which variables to change.
7. Know Why. Develop knowledge of the interactions between input variables and the
response as well as the strength and direction of these relationships. Build a model of the
process to predict what effect changes in certain variables will have on the cookie. E.g.
you know how much less sugar to put in for the desired reduction in cookie sweetness.
8. Complete Knowledge. Since there are infinite secondary variables it is impossible to
have perfect knowledge of a process. It is however practical to say that one has reached
stage eight when you have a model which will predict output characteristics to 10% of
the tolerance band for changes in inputs across a 2: 1 range, including all interactions.
The 8 stages of knowledge development detailed above suggest a stepwise process of
improvement in them self. It may theoretically be possible to skip stages 4 and 5 in a rush
to know why a process behaves as it does. However without instilling the disciplines
involved in these middle stages it is easy for the developed knowledge to be lost, and for
the process fall back to stage 3. The total approach described above ensures that
improvements that are made to the process are maintained over the long term.
2.3.2: A SEVEN STEP METHOD OF PROCESS Il'vfPROVEMENT
An example of an improvement methodology presented by Brydone et al [Statistical
Methods for Quality, 1997] is the following 7 Step Method of Process Improvement
1) Define Project.
2) Define current situation - (flowcharts, focus groups).
3) Analyse the causes - (fish bone diagrams, data collection).
4) Determine possible solutions and implement them.
6) Make sure any improvements are ongoing- (SPC, documentation).
7) The future, can more improvements be made?
This is a general method that resembles the Plan Do Check Act (PDCA) cycle. It could
be used at any of the 8 stages of knowledge detailed above however it is most suited to
knowledge development at stages 5,6 and 7. It adds to the 8 stages of knowledge by
asking whether further improvements can be made and thus turns back upon itself to
form a loop that encourages continuous improvement.
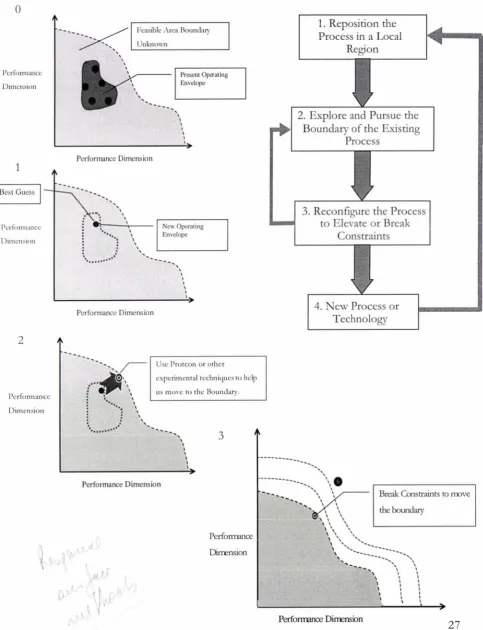
2.3.3: UPTON'S 4 LEVELS OF I VOLVEi\IENT
Upton 19986, describes process improvement in terms of 4 levels of involvement, these
are discussed below with the inclusion of a preliminary step, level 0.
Level 0. Establish Process Measurement Methods and Document the Process.
This step involves recording information on the process settings and outputs and 1s
important for analysing where the process is and what variation is present in it. This is
the beginning of process knowledge and takes it up to level 3 of the 8 stages detailed by
Barnes i.e. learn to measure key variables.
Level 1. Reposition the Process in a Local Region
The information recorded on process settings can be used to establish the present
operating envelope. From this a stable operating point can be developed using a best
guess method or an optimisation package such as Pro-t-con. The best settings are then
fixed in place and reduced variation within the process due to changes in operating
conditions should be experienced. The performance of the previous best settings should
now be the average. This extends process knowledge to level 4 or 5 of the 8 stages of
knowledge, lifting the average performance of the process and reducing its variation.
Level 2. Explore and Pursue the Boundary of the Existing Process
Conduct experiments to gain an understanding of the greater processing region and
explore its boundary. Use this information to help optimise the process for its current
configuration. Pro-t-con, Design of Experiments etc. are useful for this. This is known as
knowledge up to level 8.
Level 3. Reconfigure the Process to Elevate or Break Constraints.
In exploring the process boundary a constraint or constraints are often discovered to be
keeping the process from better performance. In order to improve the process further it
is necessary to break these constraints. This is known as the elevation of a constraint
[Goldratt 1992] and involves developing new knowledge of the elevated process
boundary.
Level 4. New Process/Radical Redesign.
At some point it may be decided that the process is not capable of performing as
required no matter how much work is done to it. It is necessary then to access a superior
boundary through a radical redesign of the old process or through the purchase of a new
one. The process of knowledge development therefore begins again.
This is a powerful framework for process improvement as it encourages companies to
iteratively learn about their processes and utilises the well regarded Theory of Constraints
(TOC) concepts [Goldratt 1992] in levels 2, 3 and 4. It is useful for management decision
making by helping them to understand the different levels at which an improvement
project could be approached. Management's decision making process may pose the
following questions.
1) Has the limit of what the process can achieve through experimentation
been reached? Has it been exploited fully?
2) How may the process be reconfigured to access a new performance
boundary?
3) ls it possible to develop a new process to achieve the same task more
effectively?
The danger is in either abandoning a process which holds significant potential for
exploitation or in fighting too long to improve an existing process that has no further
capability. A balanced approach is necessary to ensure the right decisions are made in a
timely fashion.
0
Pcrfoa11ance
Din1cnsion
1
Best Guess
Pcrfo1111ancc Dimension
2
Figure 7 was adapted from Upton 19986 and was very helpful m conceptualising the
methodology for process improvement at Filmpac
Figure 7: Upton's Levels of Process Improvement
-- ,____ ~ Feasible r\rea Boundary
-->-,,,
.__U_n_kn_o,_v,_1 _ _ _ _ _ __,---' '
Performance Dimension
---.
··
·
.
',~--..;'.~--...
.
'··:
\, ',,_·•.
...
... ... _Performance Dimension
---' '
Present Operating
Envelope
I
' I
' ' I
New Operating Envelope
-,,
' I
I
I
' I
I
---,,
~
Use Protean or other• I
1. Reposition the
Process in a Local
Region
2. Explore and Pursue the
Boundary of the Existing
Process
3. Reconfigure the Process to Elevate or Break
Constraints
4. New Process or Technology
Performance
Din1cnsion
...
,..\
:
~ \:
.
.
':
··•...
\.
.
'experimental technic1ues to help
us 1110,·e to the Boundary,
.
: \.
'··
.
.
...
•· ' ... _ ... _'
Performance Dimension
' \
I I
' ' I
[image:28.561.24.508.150.781.2]3 Performance Dirrension
-
---
-... ... ,,,---
... \ ' • I... ',
\
, I I
\ I \
\ I I \ I I
\ \\ \,, \ ' ... , ... _ \
....
___ _ ', ... _ ... ' \Break Constraints to m:>ve
the boundary
--
--
,
... ,, \
I I
I I
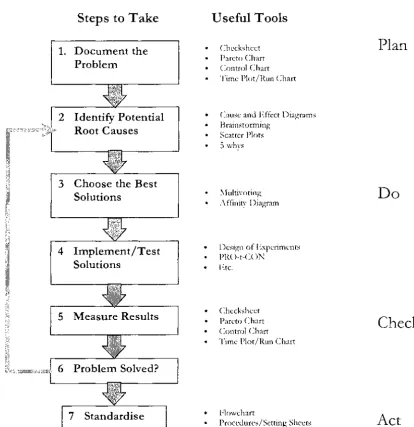
2.3.4: FLOW CHARTS FOR PROCESS HvfPROVEl'vfENT AND PROBLEM SOLVING
Adapted From Hoerl and Snee 1995 [Statistical Methods for Quality, 1997]
The Flow Charts in figures 8 and 9 are typical of the process improvement and problem
solving strategies used in practice. They work well because they
1) Emphasise work as a process,
2) Separate the two steps to reducing process variation i.e. the elimination of special
cause variation and the analysis of common cause variation.
3) Promote a cycle of constant learning.
4) Incorporate the principles of the PDCA Cycle.
Figure 8: A 7 stage Flow Chart for Problem Solving
Steps to Take
1. Document the Problem
2 Identify Potential
P-~•
Root Causes3 Choose the Best Solutions
4 Implement/Test Solutions
5 Measure Results
6 Problem Solved?
Useful Tools
• Checkshcet • Pareto Chart • Control Chart • Time Plot/Run Chart
• Cause and Effect Diagrams • Brainstorming
• Scatter Plots • 5 whys
• Multivoting • Affinity Diagram
• Design of Experiments • PRO-t-CON
• Etc.
• Checkshcet • Pareto Chart • Control Chart • Time Plot/Run Chart
Plan
Do
[image:29.568.67.481.334.761.2]Figure 9: An 8 Stage Method for Process Improvement
Steps to Take
1. Understand the Process
2. Collect Data on
Key Process and
Output Measures
3. Assess Process Stability
4. Eliminate Special Cause Variation
5. Evaluate Process Capability
6. Analyze Common Cause Variation
7. Study Cause and Effect
Relationships
8. Plan and Implement Changes
Useful Tools
Flow Chart
Fundamental Mechanisms
Checksheet
Surveys
Control Charts
Time Plot/Run Chart
Problem Solving
Frequency Plot/ Histogram
Cpk value
Standards
Pareto Chart
Statistical In fercnce
Design of Experiments
Pro-t-con
Scatter Plots
Cause and effect diagrams
Model Building
The suggestion of tools to use at each stage is a useful element of the two methods.
Although the problem solving flow chart in fig 8 suggests a cyclical method of constant
learning the process improvement method in fig 9 seems to omit this important element.
Fig 9 also fails to explicitly encourage the maintenance of improved process settings
deemed necessary by Barnes. However the cyclicity and process maintenance of the
[image:30.562.65.411.73.621.2]the process improvement method combine to suggest a strong and useful overall process
improvement method.
2.3.5: GOLDRATTS FIVE STEPS
Goldratts five steps for process improvement Goldratt 1992
1) Identify the constraint.
2) Exploit the constraint.
3) Subordinate resources to the constraint.
4) Elevate or break the constraint.
5) Go back to step one but don't allow inertia to cause another constraint.
Goldratts five steps concentrate attention on the factors that are constraining a process
from better performance. Goldratt, then, provides less of a detailed method than others,
suggesting a similar type of guiding approach to that of Upton and recommending that
process improvement should begin by exploiting constraints i.e. the process should be
"optimised". However it also acknowledges that it may not be possible to achieve the
desired results without breaking (elevating) the constraint altogether. It suggests a cyclical
approach that encourages continuous improvement but does not suggest specific tools to
use in defining, exploiting or elevating constraints. Barnes's 8 stages of knowledge and
the other experimental methods such as proposed by Pro-t-con, Taguchi and Hoerl and
Snee fit into the first 3 steps of Goldratts 5 steps above, as methods which enable the
exploitation of constraints.
2.3.6: PRO-T-CON METHODOLOGY
The suggested Pro-t-con process optimisation method is as follows.
1) Brainstorm with operators, technical etc to develop a process recording sheet that
includes all factors and responses i.e. all inputs and important outputs from the
process.
3) Conduct experiments and record data from the process.
4) Enter the experimental running conditions and their quality/ output characteristics
into Pro-t-con.
5) Define variables as controllers, derivatives (co-variates) and resultants in
Pro-t-con.
6) Define the targets of the optimisation study including their order of priority in
Pro-t-con.
7) The software performs the optimisation and gives the optimal settings and
expected results.
8) Perform a confirmatory run to check that the optimal settings achieve the
expected results.
The method revolves around the Pro-t-con software and its capabilities, the end result
being a setting sheet to run the machine to in the future. It is a very simple methodology
that is applicable wherever the development of a set of "optimal" settings is being
attempted. In terms of the 8 stages of knowledge it, using the software, involves
development of knowledge up to stages 6 and 7 but could also be used for development
of a recipe at stage 4. This is discussed in further detail next in sub section 2.4.
2.3.7: TAGUCHI 8 ST.AGE PROCESS
Taguchi proposes a method for process improvement that focuses on first reducing
process variation (making the process more precise) and second making the process
more accurate. This is due to the emphasis on the cost to society of variation suggested
by Taguchi's loss function.
Taguchi 8 stage process improvement methodology. Antony et al. 1999a
1) Set Objectives.
2) Select quality characteristic or response.
3) Identify control, noise and signal factors.
5) Prepare experiments.
6) Run experiments.
7) Statistical analysis and interpretation of results.
8) Perform a confirmation run.
This methodology is specific to Taguchi but similar to those suggested by Barnes and
Antony and compares well with the methodology recommended by Pro-t-con above. It
is involved with the process of knowledge development at levels 6 to 8 and fits into the
previous methodologies wherever experimentation is necessary. A variety of tools exist
for knowledge development through experimentation and these are discussed in detail in
sub section 2.4.
2.3.8: SUl\fM:ARY
The methods discussed above suggest that the following aspects of process improvement
are important for the design of a method for implementing Pro-t-con at Filmpac.
1) Emphasise process improvement as a knowledge creation and
development process.
2) Process improvement initiatives should include stages that ensure
improvements are ongoing, i.e. include maintenance stages that involve
process documentation and measurement.
3) An iterative approach to process improvement promotes a continuous
search for improvement opportunities.
4) Begin process improvement initiatives by optimising/ exploiting the
current process.
5) Consider process redesign and constraint breaking exercises only when
sure that the process is incapable of achieving the necessary performance
2.4 STATISTICAL TECHNIQUES FOR PROCESS OPTIMISATION
A major element of the methods described above was the use of statistical methods to
aid in the process improvement initiatives. Research into techniques such as Classical,
Taguchi and Shainin Design of Experiments, Statistical Process Control, and Response
Surface Methodologies has thus been conducted to help compare these methods with
Pro-t-con. This research will enable a fuller understanding of the options and approaches
available to experimenters and help in the design of experiments so that they may be
compared. Analysis of the way in which improvements were demonstrated due to the
reviewed articles will suggest methods to employ for a similar task at Filmpac.
A normal approach to a process optimisation project might be to use Design of
Experiment (DoE) techniques in order to help understand and optimise processes. A few
descriptive quotes are presented below.
*
"Experimental design involves making purposeful changes to the inputs or factors of aprocess to observe the corresponding changes in outputs or responses. A process is
defined as some combination of machines, materials, people, environment and
measurement which when used together perform a service, produce a product, or
complete a task. Experimental design is a scientific approach which allows the researcher
to better understand a process and determine how the inputs affect the response. "
[Barnes 1997b].
*
"The Classical tools start with fractional factorials and end with evolutionaryoptimisation (EVOP). The Taguchi methods use orthogonal arrays (inner and outer) in
"tolerance design," employing analysis of variance and signal to noise for statistical
evaluation... All three approaches (Shainin methods included) are far superior to
conventional SPC, which attempts to solve chronic problems by means of control
charts-a total waste of time. All three approaches are also far superior to old fashioned
experiments, taught in universities and widely practised by engineers in which one
variable at a time is varied, with all other variables kept rigidly constant. Besides the
inordinate amount of time necessary for such experimentation, the central experimental
weakness of this approach is the chronic inability to separate main effects from
interaction effects. " [Bhote, 1991]
* "DoE required that we interrupt production on the machine involved in the experiment
for a lengthy period. A typical experiment involves a matrix with 12 different set-ups,
days to run this experiment to conclusion. The level of guesswork and up-front planning
also made it difficult to justify continued use of DoE. "[Litsikas, 1995]
*"
Because Sequential Process Optimisation (SPO) (the software that Arrow Molded plastics chose to use) works in process and doesn't require machine down time, ArrowPlastics scheduling department is also pleased. Jobs don't have to be interrupted; thus
the company can realise the productivity and costs savings of tooling a mold once,
instead of several times. " [Litsikas, 1995}.
*
*
*
"Pro-t-con is applicable to any continuous process as "every process is only a
combination of process variables influencing a combination of product variables".
Providing you can measure variables, it is possible to establish the relationship between
them and optimise the process with the Pro+con technique". [Lo, 1999
J
"A modelling system for all types of plastics processing uses actual production data to
optimise parameter settings .. . Protcon calculates relationships between a large number of
variables, in order to show
if
and how the process can be controlled. One expert who has"test driven" the package says it could have "profound significance" in process
modelling. The program will calculate the importance of given machine parameters on
given part parameters" [Mapelston, 1994}.
"Every process, no matter how well controlled, still has opportunities for improvement by
a Pro-t-con Study. The improvements could be in output, better quality and better
knowledge of the process for engineering improvements." [Lo, 1999]
*
"Another less widely acknowledged method of process optimisation, known as responsesurface methodology, is endorsed by many statisticians as a technique for modelling
complex manufactun'ng processes with a minimal number of experiments." [Bn'nkley,
1993]
A fundamental paradigm of Pro-t-con is that "every process is only a combination of
process variables influencing a combination of product van·ables "[Lo 1999]. So providing
inputs and outputs can be measured, the process can be optimised. A variety of other
methods for discovering the effects of a processes inputs on its outputs exist and these
include DoE, RSM, Taguchi and Shainin techniques. However some of the people
involved in the articles quoted above seem to have had problems using these methods as
they can require a significant knowledge of statistics, a large number of experiments and
such problems and is thus more easily used in an industrial setting. These issues shall be
discussed further, during this section.
2.4.1: CLASSICAL DESIGN OF EXPERIMENTS (DOE)
"Classical experimental design is a scientific approach which helps the researcher to
determine how the inputs affect the response". [Barnes 1997b]
Two level factorial experimental designs involve analysing k factors in n observations
with each factor at two levels. This is a useful technique for analysing a process for its
factor effects and allows the provision of independent (orthogonal) assessments of the
effects of each factor under study as well as the interactions between factors. The number of experiments or treatment combinations necessary (tJ for a two level factorial
experiment is tc = 2k so for four factors it is necessary to do 24 = 16 experiments. This
number can be reduced through fractionalisation of the design but this comes at the
expense of the information about interactions between factors. The above equation then becomes tc = 2k•r where p is the fractionalisation element so 24
-1 = 8 experiments could be done if the effect of the four way interaction was not deemed important. DoE is designed so that the analysis is more powerful in terms of the ratio of number of
experiments necessary and the information resulting from these experiments than from a "non-designed" data set. The Plackett Burman screening experiment is designed to give a
processes single factor effects with the minimum number of experiments. It is often used
for reducing a large number of variables down to a smaller number of important ones for
more in depth analysis. It ignores interaction and non-linear effects and is thus
questionable in terms of its predicative value.
DoE work is often supported by statistical data analysis that may involve model building
by regression, Analysis of Variance (ANOVA) and further in depth analysis of the
important factors and their interactions/ non linearity's.
Many books exist on the topic of experimental design, however the major text consulted
in this review was an accumulation of knowledge from many of these into a set of course
notes for Industrial Analysis Techniques 1997, a paper provided by Massey University
Department of Production Technology. This text covered a variety of the options
A number of papers were reviewed that also discussed DoE. Antony (3] discussed a
series of suggestions for making industrial experiments more successful that compare
well with those found in Barnes [4,5]. Brinkley [9] presents a case study on the
combination of DoE and SPC for improved quality discussing the option of Response
Surface modelling for process optimisation, another important option available to
industry. Litsikas [25] presents a short article discussing the reasons that Arrow Molded
Plastics dumped DoE for another methodology called Sequential Process Optimisation
(SPO). The suggestion was that SPO was more user friendly than DoE as it required less
interruptions to production and was easier to implement. She lists the benefits of SPO
over DoE as 1) Significantly reduced machine down time, 2) Facilitates reaching optimal
combinations, 3) Last minute changes not as overwhelming, 4) Reduced scrap and 5)
Verification of theories and opinions. This is similar to what the Pro-t-con operations
manual suggests are Pro-t-cons benefits over DoE. Unfortunately no further information
was found about SPO.
The power of DoE to develop information and knowledge about processes is seldom
questioned. It is however often seen as difficult to implement, as it requires significant
prior planning and can involve a large number of experiments. It is generally for the use
of capable engineers, statisticians and scientists and requires significant training in its
application.
2.4.2: RESPONSE SURFACE METHODOLOGY (RS;\f)
Response surface techniques are special cases of the previously discussed DoE methods
and are used when curvature is suspected in the response. The objective is to provide
empirical contour diagrams of how factors under the control of the experimenter
influence the response. They give more information about the effect of factors on the
response and consequently require significantly more experiments. The main options
available are Three Level, Central Composite and Box Behnken Designs [Barnes, 19976].
Because RSM techniques require so many experiments they are usually undertaken with a
small number of variables i.e. when it is known which variables are significant and the
interest is in a fuller understanding of how they affect the response.
DoE and SPC for improving quality. The primary goal of the study was to longitudinally minimise defect levels and variation. He discussed a methodology that involved the design of central composite and three level experiments to allow linear and non-linear
effects to be estimated. Response surfaces were constructed and constrained
optimisation was performed using GAMS-MINOS non-linear optimisation software to
determine the optimal factor settings for implementation on the shop floor. Confirmation experiments were performed to verify the solution.
Because RSM techniques give so much information about the relationship between important factors and the response they are useful for optimisation and help in setting
factors to achieve specific targets. They do however, like DoE, require the user to have a
strong statistical background.
2.4.3: L-\GUCHI i\IETHODS
Taguchi methods are an important part of the history of experimental design and are as
much a quality philosophy as a quiver of tools to use for process improvement.
Taguchi advocates a two stage process for process optimisation that aims to reduce response variation and set the response mean. Firstly the factors that significantly affect
the Signal to Noise Ratio (S R) should be identified using a suitable combination of
inner and outer orthogonal arrays and setting all factors that affect the S R to the levels where the process has the lowest SNR. This reduces variation in the performance
characteristic prior to shifting the mean to the desired target. The next stage is to select an adjustment factor that has little effect on the SNR but a large effect on the response mean and use this to shift the mean to the desired target. So first the process is made
more precise and then more accurate. This methodology is discussed by Barnes 19976
and used by Antony et al. 1999a.
Barnes 1997a gives a comparison between Taguchi and DoE his conclusions are that.
1). Taguchi's design matrix is a special case of a DoE matrix.
2) Taguchi methods stress simplicity and are thus attractive to engineers.
is recommended.
4) Taguchi is considered to be 60 to 80% effective whereas classical DoE with Response
Surface Methodology techniques are believed to be 80 to 100% effective.
S) Optimisation is done with an iterative approach in DoE whereas a true optimum is
not really found with Taguchi.
Antony et al 1999a discusses the background, methodology and results observed using
DoE and Taguchi Methods in an industrial setting. The aim being to identify critical
factors affecting process variability and mean and to use this information to minimise
process variability whilst achieving the desired mean. They detail an eight step Taguchi
process which was discussed previously. Using this methodology their process capability
(Cpk value) was improved from 0.534 to 1.69, clearly showing a significant improvement
in the processes ability to reliably produce to specification. Using Taguchi's loss function
analysis the estimated potential annual savings to the company due to the above
improvement was
£
75000 through improved customer satisfaction, better reputation,reduced complaints and a greater market share.
2.4.4: SHAININ METHODS
Bhotc 1991 begins by discussing the strengths and weaknesses of Classical and Taguchi
DoE against the methods used by Dorian Shainin. The suggestion is that although the
classical and Taguchi methods of DoE are significantly better than "one factor at a time"
experiments for understanding processes, the Shainin techniques are easier and more
powerful than either. The main reason for this is that in order to analyse processes for a
large number of factors with a reasonable number of experiments the experimental
designs must be fractionalised and thus ignore possibly important interactions. A paper
written by Shainin is included in appendix A and relates a case study about the danger of
analysing processes with interactions using experimental designs that are not able to
analyse for them. The conclusion being that this can produce misleading and spurious
results.
He then presents and discusses seven techniques used by Dorian Shainin (i.e. Multi-Vari

![Figure 11: Spiral mandrel and die. [Exxon 1999]](https://thumb-us.123doks.com/thumbv2/123dok_us/8524543.353931/52.557.98.432.370.622/figure-spiral-mandrel-and-die-exxon.webp)
![Figure 13: Cooling air flow against the bubble. [Exxon 1999]](https://thumb-us.123doks.com/thumbv2/123dok_us/8524543.353931/53.563.192.381.236.369/figure-cooling-air-flow-bubble-exxon.webp)
![Figure 14: Factors effecting blown film properties. [Dow (17)]](https://thumb-us.123doks.com/thumbv2/123dok_us/8524543.353931/54.566.54.510.546.759/figure-factors-effecting-blown-film-properties-dow.webp)
![Figure 17: Low Density Polyethylene (LDPE) [Exxon 1999]](https://thumb-us.123doks.com/thumbv2/123dok_us/8524543.353931/59.560.215.334.348.455/figure-low-density-polyethylene-ldpe-exxon.webp)
![Figure 19: branches) High Density Polyethylene (HDPE) (lowest number of short chain [Exxon 1999]](https://thumb-us.123doks.com/thumbv2/123dok_us/8524543.353931/60.561.204.332.371.476/figure-branches-high-density-polyethylene-lowest-number-exxon.webp)