Glacsweb: a sensor network for hostile environments
Kirk Martinez, Royan Ong
School of Electronics and Computer Science. University of Southampton
Southampton, UK {km, hlro1}@ecs.soton.ac.uk
Jane Hart
School of Geography University of SouthamptonSouthampton, UK [email protected]
Abstract— A sensor network is described which obtains data from nodes on and inside glaciers. Power management through scheduling and selective control is used to allow a lifetime of at least one year on batteries. Radio links in the glacier and across 2.5km distances are used for data and commands. The prototype system was installed in Norway in 2003 and this paper describes details of the full design for 2004 through discussion of the lessons learnt.
Keywords - sensor network, , radio communications, low power, environmental monitoring, glaciology.
I. INTRODUCTION
Recent developments in wireless network technology and miniaturisation have meant that for the first time, the environment can be realistically monitored. These studies can potentially provide advances in environmental science, vital hazard warning as well as sensor network engineering. This is particularly important in remote or hazardous environments where many fundamental processes have never been studied due to inaccessibility.
The overall aim of this project is to produce a sensor network capable of measuring several parameters relating to ice caps and glaciers [1]. This involves placing sensor nodes in extremely hostile environments: underneath, on and inside glaciers. The hazards are not confined to mechanical problems due to the weather and cold but also to radio communications. Together with the size and power constraints this has led to a variety of solutions to produce a working system.
There have been few sensor networks deployed in the environment. Of particular relevance here are NASA/JPL’s project in Antarctica [2], NASA/JPL’s Huntington Gardens project [3], Berkeley’s habitat modelling at Great Duck Island [4] and the CORIE project which studies the Columbia river estuary [5].
One of the most important elements of climate change is its affect on sea level rise. Glaciers are a key element in this behaviour, but their behaviour is poorly understood. Today 90% of the discharge of West Antarctica is not controlled by mass balance, but by subglacial behaviour [6]. Our research aims to use technological advances to understand the behaviour of rocks beneath the glacier in order to understand both the dynamics and estimate glacier motion [7].
At the same time, the overall aim of this research is the development of technology to understand and monitor glacier behaviour. The discharge from glaciers feeds directly into the
sea, to either raise sea level (if glacier melts due to global warming). In the case of the Norwegian glaciers, they feed into the north Atlantic and so bring increased supplies of fresh water into the sea which may cause the shut down of the thermohaline circulation which would cause a dramatic decrease in North West European temperatures [8]. Both sea level rise and climate change directly affect society so any monitoring and understanding of this process will help provide solutions to these far reaching effects.
The glaciological objectives are to measure the relative motion of the bed to the surface, study the motion of small rocks in the bed and other parameters useful for subglacial dynamics. These are the most novel and challenging problems, which are combined with more conventional data from weather stations and satellite imagery. In order to mimic rocks, sensor nodes (probes) are placed in and under the glacier which contain appropriate sensors but must communicate their data to the surface via radio communications.
These requirements led to the following technical objectives:
• miniaturisation
• low power design
• ad-hoc networking
• autonomous and adaptive behaviour
• position sensing of the probes
We were particularly interested in how the hostile environment would influence the design of the network and hardware. We also expected differences between theoretical designs and the final designs moulded by experience.
Work on the prototype system began in November 2002 and it was deployed in Briksdalsbreen, Norway in the summer of 2003. This glacier was chosen because it had the appropriate logistics and glaciological conditions. The glacier is fast-moving and an outlet of the largest ice-cap in mainland Europe. It has advanced 400m since 1988 and is resting on unconsolidated sediment. Due to tourism the glacier is easily accessible, has GSM telephone coverage, mains electricity and ISDN access in a nearby (2.5km) camp site.
This paper briefly describes the data from the prototype, describes the second system deployed in the summer of 2004 and discusses the new developments based on experiences with the prototype.
II. SYSTEM ARCHITECTURE
Fig. 1 shows the overall system which comprises four main elements: probes in/under the glacier, a base station on the ice and a reference station which relays data to a sensor network server (SNS) in the UK.
Base Station
Ice
Sediment
Reference Station
[image:2.595.36.282.121.196.2]SNS
Figure. 1. System overview
Transmitting data is the most power consuming task for the probes (500 mW) and it was important to minimise not only their time awake but the transmissions. Communications were expected to be intermittent so waking up the probes was not considered a viable option as they have to wake independently in order to take sensor readings. The system must therefore rely on a time schedule and the main design decisions involved the communications protocols. If a network were configured so that a probe could simply wake when it wanted and send a packet out, through the base station then the base station would have to be on all the time and there is a risk of dealing with collisions. Because the base station has sensors as well this option was not considered in order to reduce power supplies on the ice surface. If all the systems had perfectly synchronised real time clocks (RTCs) then the probes could wake up sequentially while the base was on and communicate actively without interference. However it was expected that the clocks would drift by up to 2s per day. More seriously probes may not communicate for a few days or weeks due to environmental conditions or device failures and such a scheme would mean a probe’s communications time could be greatly extended due to the bulk of data which needed transferring. Ad-hoc networking in the future would also require all the probes to be awake at the same time. It was decided to make the probes essentially passive in their communications. The whole system wakes up and the base station sequentially reads probes and puts them back to sleep. Time drifts are compensated for by having a wider base station window open and broadcasting time every day. This leaves the probes on for longer than necessary however their receive mode consumes so little power (90mW) that it is an effective technique.
During the communication window all the systems and communication links are open. The probes are passive and only respond to commands from the base station such as “data-read” or “set-time”. The only packet the base station expects to receive is a reply packet from the same probe it is talking to so communication errors can be detected easily. The design assumes that radio communications will be intermittent so every system which fetches or gathers data maintains a data store locally. The risk with a communication window is that if there are large clock drifts subsystems will become “lost” but this has been minimised by broadcasting GPS time (UTC) regularly.
The Reference Station is the gateway for transferring data and manually controlling the entire system from Southampton. It also acts as a reference point for the differential GPS system for measuring supra-glacial movement. Radio communications use the license-exempted 433MHz and 468MHz channels.
The Linux-based sensor network server contains the final data repository and provides web access for researchers. It also provides the backup text message (SMS) server capable of receiving data directly from the base station.
A. Probes
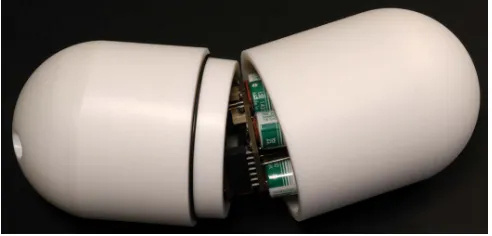
[image:2.595.306.552.344.462.2]So that every level of the electronics could be controlled commercially available electronics were not used for the probes. Instead custom PIC-based boards were produced. The electronics and sensors are enclosed in a plastic (PVC initially then Polyester for 2004) egg-shape capsule. Each capsule is composed of two halves which are permanently bonded (See Fig. 2). Each probe is equipped with the following sensors: pressure, temperature, orientation (tilt in three dimensions), external conductivity and strain gauge. The sensors are glued and potted into the probe to prevent water intrusion. The probes are inserted into the glacier using a hole cut with a high pressure hot water drill and are not recoverable. The external diameter was fixed by the hole size produced and is now 68mm wide.
Figure. 2. Probe housing shown open.
765 12 11 10
8 4
2 1
9 3
RTC
Micro-controller
PIC16LF876A
Temperature sensor Pressure
sensor Tilt sensors
FLASHROM
(64kB)
comms
(433 MHz)
3.
6V b
att
er
y
(Li
thi
um
T
hi
ony
l C
hl
ori
de) Voltage reg.
(digital 3V)
Strain gauge
Voltage reg.
(analogue 3V)
RS232
I2C AN0 AN1/AN2
DC-DC
(5V)
I/O
(6 off)
[image:3.595.58.282.48.221.2]I/O RC0:RC2
Figure 3. Block diagram of Probe (version 2)
Probes collect data six times daily in order to save power and the transceiver is only enabled once each day. This acquisition rate is acceptable as the data is not expected to change rapidly. In sleep mode all the electronics except the RTC and voltage regulators (outputs disabled) are powered off and the current system consumes only 10µA in this state. When powered they consume only 4.2mA (with transceiver off). In order to fit the electronics into the small package a stack of three octagonal PCBs are used (digital, analogue and radio) which also makes the system modular. For example an infra-red module has been developed to allow short range testing in the lab instead of less controllable radio. Battery voltage is measured once a day as it is essential system status data.
The time-stamped data collected (96 bytes/day) is stored in FlashROM in a ring buffer to allow for communication breakdowns.
B. Base Station
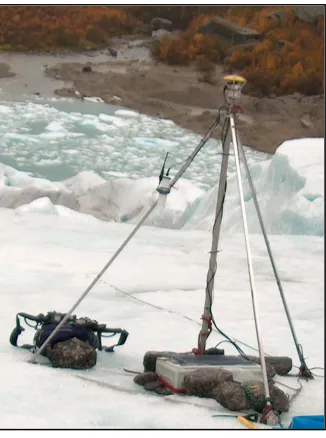
The Base Station controls the probes, gathers surface data and links to the reference station in the valley. Local data is fetched from a weather station and webcam. 96AH of large lead-acid gel batteries are used together with 15W of solar panels for power. Wind-power was considered to be risky due to the stresses it would impose on the base station. A permanent weather and movement tolerant pyramid structure holds sensors, antennas and tethers the equipment (Fig. 4). The weight of the batteries inside the box helps to stabilize the base station as the ice melts underneath and creates an uneven surface. A differential GPS unit is read daily to measure its location in conjunction with data from the reference station’s GPS. A 500mW radio modem provides a 9600 baud link 2.5km down the valley to the reference station PC.
The prototype base station was controlled by a PIC16F877 MCU (main controller) with ancillary PICs used to control the GPS and GSM units.
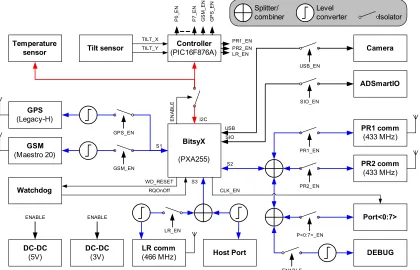
The FlashROM, RTC, temperature and tilt sensors were are identical to the Probe’s. Although power-efficient this was not easily reprogrammable so the current system uses a StrongARM-based board (BitsyX) running Linux. This allows better remote access as diagnostics and maintenance has been found to be a major challenge. Fig. 5 shows the main detail including the extensive power control over each device. Six peripheral devices use RS232 ports but the main board only has three, so a custom switcher has been integrated into a new board which also has the power-control devices. Each unit can be completely powered-off when not in use. A web-cam allows the general condition of the site to be observed and uses the USB port.
A GSM modem was implemented in the prototype which allowed data to be sent directly to the UK server via text messages (SMS) if the long-range link was down. This was highly successful and the final system will include dial-in capability for emergency access as well. Only probe data was transmitted this way as hexadecimal encoded in full size SMS messages. The protocol for this is relatively simple and has been ported to the new Linux platform (which could also allow direct dial-in in the future)
The I2C bus is used to send commands to the PIC which controls the power and also has tilt and temperature sensors. Tilt was found to be useful in determining if the box was about to slip into an approaching crevasse for example.
The GPS system is used in conjunction with the GPS unit in the Reference Station to reduce the spatial errors caused by the surface movement (aprox 30 m/year).
[image:3.595.352.515.60.279.2]C. Reference Station
The Reference Station is a mains-powered 500MHz EPIA-PC running (RedHat 9) Linux and located in a café in the valley. This low-power PC format was chosen as can be supported for longer on a UPS as well as being small and near-silent. It is connected to the Base Station via the radio modem, and periodically to the internet via an ISDN router. It is the position reference point and records a one hour GPS file daily. Each day it sends all new data (as a compressed tar file) to the data server in Southampton and archives all data on disk as a backup. It is interesting to note that this mini-ITX PC and its radio modem were the main devices which failed during the year. The mini-ITX power supply failed (although it was on a UPS).
III. COMMUNICATIONS
The short-range communication has to penetrate up to 100m of glacier ice and some sediment. Under these conditions, RF signals degrade significantly. The centre frequency is a compromise between antenna size and RF losses. Omni-directional dielectric antennas avoid problems with varying probe orientations and are extremely small. The prototype used Adlink 868MHz transceivers with good sensitivity and efficiency. After a transmission test the true losses in glacier ice were found to be much higher than expected and the base station’s transceiver was lowered down a 30m hole to reduce the distances involved. The new version uses 433MHz, which is still high for wet ice but our transceiver
PCB includes a 100mW power amp to boost the signal. The base station also has two wired transceivers 30m down holes to avoid wet ice, allow for redundancy and self-tests. We are also dispensing with the dielectric antennas in favour of conventional compressed helical in order to gain power.
The distance between the Base and Reference Stations is 2.5km without a clear line-of-sight. The rock crest of the valley even causes 500 mW handheld PMR transceivers to deteriorate when working in the foreland but fortunately the extra height of the glacier surface means communications are better there. For reliable communications 468MHz high-powered (500 mW) radio modems were employed which integrate some error correction. An omnidirectional antenna was used on the ice in case the whole structure turned and pointed a directional antenna the wrong way. The reference station’s antenna is a short YAGGI type with reasonable directionality and 3 dB gain.
A 9600 baud rate is used in all radio communications, which gives low bit error rates and is sufficient for the amount of data handled and leads to reasonable transmission times down valley.
A. Communication Protocol
A robust communication method is essential to prevent noise from interfering with system operations and to maintain data integrity. To achieve this, a packet-based communication protocol with error detection was devised for probe communications. The PIC processors do not have the capacity
BitsyX
(PXA255)
GPS
(Legacy-H)
PR2 comm
(433 MHz)
LR comm
(466 MHz)
PR1 comm
(433 MHz)
Controller
(PIC16F876A)
Temperature
sensor Tilt sensor
Watchdog
ADSmartIO Camera
Port<0:7>
DEBUG Host Port
GSM
(Maestro 20)
USB_EN
SIO_EN
PR1_EN
PR2_EN
P<0:7>_EN
ENABLE
GS
M
_
E
N
G
PS_
EN
P0
_E
N
P7
_E
N
I2C
EN
A
B
L
E
TILT_X
TILT_Y
GSM_EN S1
S2
WD_RESET RQOnOff
LR_EN
CLK_EN LR_EN PR1_EN PR2_EN
S3
USB SIO GPS_EN
DC-DC
(3V)
DC-DC
(5V)
ENABLE ENABLE
Splitter/ combiner
Level
[image:4.595.101.521.57.327.2]converter Isolator
to cope with TCP/ip and in the prototype the base station also used these packets for reference station communications. The base station to reference station link has been replaced by TCP/ip over a PPP radio-modem connection. This also makes it possible to telnet into the base station.
The probe packet structure is shown in Fig. 6. The first byte contains the header and the size of the data field. The second byte is the ID of the destination and the command (CMD) field allows up to 256 different commands to be defined. The data field is 1-16 bytes and the checksum (CS) is used to check packet integrity. A variable data width allows simple one byte data payloads to be transferred to save communication time.
0 1 2 3 … 18 19
HD/SZ ID CMD DATA CS
Figure 6. Communication packet format
[image:5.595.36.283.223.254.2]In the current set up, three types of packets are recognized: command, info and broadcast packets. Command packets are sent by the Main controller to any other device. The device in question usually responds with a packet which contains data confirming that the action has taken place. For example an EEPROM write command returns the value read from the address after write has occurred. If a valid reply packet is not received within a preset duration (1s), this signifies a communication (e.g. checksum error) or topology (e.g. unknown device) error. Broadcast packets do not cause a reply and these are used to send information or commands to all devices simultaneously (e.g. setting RTC time and date). An info packet is used mainly for debugging and causes no command to be executed or a reply. A listener can be configured to capture all the info packets in order to monitor the system.
TABLE I. COMMUNICATION SEQUENCE
Time Probe Base Station Ref. Station
0000 Data log
0300 GPS log GPS log
0400 Data log
0800 Data log
1200 Data log
1600 Comms Comms Comms
1900 Transfer
2000 Data log
B. Sequence of Events
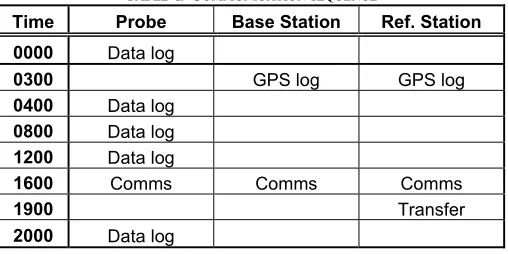
The daily sequence of events for recording and transferring data is shown in Table I. At the end of each period, the Probe and Base Station configure their RTCs to the next “wake-up” time before sleeping/suspending.
Probes only record their sensors during Data log periods. During the Comms period, they enable their transceivers for a fixed duration after recording their sensors. The Base Station powers up during this period and reads its own sensors,
broadcasts the GPS system time and requests unseen sensor readings from the Probes. This is carried out by reading the store pointer addresses and sending eeprom_read16 commands until all the data is read. This allows a base station to read old data or restart data logging as well, which is useful in debugging. Later in the day, the Reference Station connects to the internet to allow communication between Southampton and the entire system. This communication window opens for a short duration once the systems are idle.
The Base Station and Reference Station also “wake up” during the GPS log period to read GPS data. A separate GPS period allows its timing to be shifted manually according to the time of year because satellite visibility varies considerably. Changes in the GPS window can be evaluated using Topcon’s mission planning software which predicts satellite visibility taking into account the obstructions caused by the mountains. There are usually only 4-6 satellites visible (roughly half those possible). The day’s data are transferred to the server in Southampton during the Transfer period.
IV. PROTOTYPE RESULTS
The entire system was installed at Briksdalsbreen, Norway, in August 2003. Nine probes were deployed, mainly at the ice-till boundary (50m to 80m deep). Perfect results were not expected immediately due to the water in the holes; which were expected to close up. However the preliminary results were useful and provided a way of testing the system. Short monitoring fieldwork was carried out in Autumn and Spring to upgrade the Base Station and check the system’s condition. Some holes had closed while others were still draining surface water, so these would have caused communication problems.
8.00 10.00 12.00 14.00 16.00 18.00 20.00
31/07/ 03:0
0
01/08 /03:0
0
02/08 /03:0
0
03/08 /03:0
0
04/08 /03:0
0
05/08 /03:0
0
06/08 /03:0
0
07/08 /03:0
0
Date (dd/mm/yy:hh)
P
ressur
e (
p
si
)
Figure. 7. Probe 8 Pressure Readings
A. Prototype Probe Data
[image:5.595.320.553.425.561.2] [image:5.595.37.291.476.603.2]tightly wedged in the hole and pressure reducing below it due
to water flowing in the river below (Bernoulli effect).
B. Base Station Data
The Base Station has two sets of data so far: one each before and after replacement of the main board. The data shows its battery voltage (Fig. 8) tilt and temperature (Fig. 9).
12.0 12.5 13.0 13.5 14.0 14.5
04/08 /03
11/0 8/03
18/0 8/03
25/0 8/03
01/0 9/03
08/09/ 03
15/0 9/03
22/09 /03
29/0 9/03
06/1 0/03
Date
Bat
te
ry
vo
lt
ag
e
(V
o
lts
[image:6.595.55.291.142.293.2])
Figure. 8. Base Station battery Voltage
The battery level fluctuated between 12.3V and 14.2V over the course of 65 days (and was still 12.2V in April 2004). This ripple is due to the solar panels charging the batteries on bright days and it can be seen that overall battery charge remains high during the summer.
Fig. 9 shows the relationship between the base station’s tilt and temperature. The tilt indicates that the Base Station moves slightly during warm periods (eg Nov 11 2003). The temperature on the glacier slowly decreased during winter and after Feb 11 2004 snow fall stabilised the readings.
-22 -20 -18 -16 -14 -12 -10-8 -6 -4 -20 2 4 6 8 10 12
11/10/03 11/11/03 11/12/03 11/01/04 11/02/04
[image:6.595.54.290.436.589.2]Date
Figure 9. Base Station temperature/C (upper trace) and box tilt (lower two traces/degrees)
V. FUTURE WORK
A. Ad-hoc networking
Due to the wide variation in radio losses in the glacier it is possible for probes to loose contact with the base station. Hence it would be useful to include a probe to probe ad-hoc network which would allow data to pass across them to the
base. This would also be expected to save energy if less power was acceptable for inter-probe communications. Of course the power drain on an overused intermediate probe has to be minimised as well. With this in mind an algorithm is being developed which requires a minimum of setup because the probes should be on for a short time only and can not afford to negotiate too much.
B. Location sensing
One of the requirements is to locate the probes with an accuracy better than 1m. A time-of-flight system has been designed which measures the distance to five antennas on the surface. A command to a probe tells it to send back a pulse and this stops synchronised 1GHz counters on each surface receiver. Data from the five counters together with their position (measured with dGPS) and the velocity of the RF in ice (0.16 m/ns) provides the position of the probe. This technique will be tested in the summer of 2004.
VI. CONCLUSION
This research has necessitated an interdisciplinary team including people from the following fields: glaciology, electronics, computer science, communications, mechanical engineering and surveying. Our experience shows that a prototype installation in the field is necessary in order to actually solve all the engineering problems. This is particularly true of the radio communications. However the daily variations in surface wetness and water depths in the holes mean that absolute confidence in any experiments is extremely difficult. The research has also highlighted the importance of remote diagnostics and control. We have created our own communications layers and these required extremely fine-grained testing in order to locate or avoid faults. One of the draw-backs in real deployments in hostile environments is that there is a limited time window in which to develop improvements and ensure fully tested final versions of everything are made on time. The lessons learnt will ensure that the 2004 system will be a stable platform for sensor network research including ad-hoc networking and autonomous adaptive behaviour.
ACKNOWLEDGMENT
The authors thank the Glacsweb partners Intellisys and BTExact. Topcon and HP for equipment support. Thanks also to Harvey Rutt, Sue Way, Al Riddoch, Dan Miles, Joe Stefanov, Don Cruickshank, Matthew Swabey, Ken Frampton and Mark Long. Thanks to Inge and Gro Melkevol for their assistance and for hosting the reference station.
REFERENCES
[1] K. Martinez, J.K Hart and R. Ong, “Environmental Sensor Networks”, Computer, Vol. 37, No. 8, pp 50-56, 2004.
[2] K.A. Delin, R.P. Harvey, N.A. Chabot, S.P. Jackson, Mike Adams, D.W. Johnson, and J.T. Britton, “Sensor Web in Antarctica: Developing an Intelligent, Autonomous Platform for Locating Biological Flourishes in Cryogenic Environments,” 34th Lunar and Planetary Science Conference, 2003.
[4] R. Szewczyk, et al., “Lessons from a Sensor Network Expedition,” Proceedings of the 1st European Workshop on Wireless Sensor Networks (EWSN '04), January 2004, Berlin, Germany, pp 307-322. [5] D.C. Steere, et al., “Research Challenges in Environmental Observations
and Forecasting Systems,” Proc. ACM/IEEE Int. Conf. Mobile Computing and Networking (MOBICOMM), 2000, pp. 292-299. [6] A. Alley, R. B. “Continuity comes first: recent progress in understanding
subglacial deformation”, In: Maltman, A. J., Hubbard, B., and Hambrey, M. J. (Eds.). Deformation of Glacial Materials, Geological Society Special Publication, Vol. 176, pp.171-180. 2000.
[7] J.K. Hart and J. Rose, “Approaches to the study of glacier bed deformation”, Quaternary International, Vol. 86, pp. 45-58, 2001. [8] M. Vellinga and R.A. Wood, “Global climatic impacts of a collapse of