Fly Photoreceptors Encode Phase Congruency
Uwe Friederich1, Stephen A. Billings1, Roger C. Hardie2, Mikko Juusola3, Daniel Coca1*
1Department of Automatic Control & Systems Engineering, the University of Sheffield, Mappin Street, Sheffield, S1 3JD, United Kingdom,2Department of Physiology, Development and Neuroscience, University of Cambridge, Downing Street, Cambridge, CB2 3DY, United Kingdom,3Department of Biomedical Science, the University of Sheffield, Western Bank, Sheffield, S10 2TN, United Kingdom
Abstract
More than five decades ago it was postulated that sensory neurons detect and selectively enhance behaviourally relevant features of natural signals. Although we now know that sen-sory neurons are tuned to efficiently encode natural stimuli, until now it was not clear what statistical features of the stimuli they encode and how. Here we reverse-engineer the neural code ofDrosophilaphotoreceptors and show for the first time that photoreceptors exploit nonlinear dynamics to selectively enhance and encode phase-related features of temporal stimuli, such as local phase congruency, which are invariant to changes in illumination and contrast. We demonstrate that to mitigate for the inherent sensitivity to noise of the local phase congruency measure, the nonlinear coding mechanisms of the fly photoreceptors are tuned to suppress random phase signals, which explains why photoreceptor responses to naturalistic stimuli are significantly different from their responses to white noise stimuli.
Introduction
In his seminal papers [1][2] Horace Barlow postulated that sensory pathways are tuned to detect, enhance, and efficiently encode the stimuli that are important for survival. However, as Barlow pointed out [1], the signal transformations performed by sensory neurons are difficult to characterize using ordinary physiological investigations. In particular, the responses of sen-sory neurons contain components from linear and nonlinear transductions that are difficult to separate [3].
Although it has been known for some time that sensory neurons, whether auditory [4][5] [6], olfactory [7] or visual [8][9][10], respond nonlinearly when driven by stimuli that have
‘naturalistic’properties, the nonlinear relationship between the statistical properties of the sti-muli and the neuron responses—or in other words, the computations performed by these neu-rons [11]—have not been fully characterized.
In the visual system, the detection of the boundary or edges of objects is crucial for object segregation, categorization and recognition as well as for motion detection [12]. In this context, the temporal structure of the retinal images is very important [12] since moving spatial edges generated by self-motion or by moving objects produce temporal edges at the photoreceptor level. Therefore, selectively enhancing the salience of these temporal features should facilitate a11111
OPEN ACCESS
Citation:Friederich U, Billings SA, Hardie RC, Juusola M, Coca D (2016) Fly Photoreceptors Encode Phase Congruency. PLoS ONE 11(6): e0157993. doi:10.1371/journal.pone.0157993
Editor:Samuel G. Solomon, University College London, UNITED KINGDOM
Received:November 26, 2015
Accepted:June 8, 2016
Published:June 23, 2016
Copyright:© 2016 Friederich et al. This is an open access article distributed under the terms of the
Creative Commons Attribution License, which permits unrestricted use, distribution, and reproduction in any medium, provided the original author and source are credited.
Data Availability Statement:All data will be available fromhttp://www.dflybrain.org/ InteractiveSimulator.html.
downstream processing of the spatio-temporal visual stimuli for motion detection. As edges correspond to points of local maximum phase alignment of the constituent Fourier compo-nents, local phase congruency, which is invariant to illumination and contrast, is an accurate measure of edge saliency that can be encoded by the photoreceptors [13][14][15].
There are many clues, which suggest photoreceptors are tuned to distinguish and selectively process the temporal phase correlations present in light stimuli. These phase correlations are biologically relevant [4][16][17].
It is well known, for example, that photoreceptor responses to naturalistic stimuli are highly nonlinear [8] whereas Gaussian white noise stimuli tend to linearize the response [18].
Naturalistic stimuli exhibit local and global phase correlations caused by the edges, contours and textures present in the natural scene [12,19], which can be described by higher-order statis-tics [20–23] and can only be encoded by applying nonlinear transformations to the stimuli [24]. In contrast, Gaussian white noise signals exhibit no phase correlations and are completely characterised by first- and second-order statistics. Because white noise stimuli lack higher-order correlations present in natural scenes, linear encoding ensures that photoreceptors do not generate spurious higher-order correlations that the fly brain would use to distinguish envi-ronmental features.
Experimental and modelling studies investigating the role of photoreceptors in the detection of moving point objects [25–27] provide further evidence that photoreceptors contribute to the enhancement of image features that are essential for object recognition. The photoreceptors of male houseflies, for example, exhibit surprisingly large responses to moving targets [28] which cannot be explained by linear models derived from photoreceptor responses to white noise sti-muli. This highlights the need to use naturalistic-like stimuli with a higher-order statistical structure, in order to characterize the nonlinear encoding mechanisms of photoreceptors [29].
More recent work [16] has shown that temporal processing performed by photoreceptors of male hoverflies (Eristalis tenax)enhances not only the moving target but also relatively static features present in the background, which are important for navigational purposes. Although this work highlights the importance of nonlinear processing in target detection, the relation-ship between the image features and the nonlinear component of the response is not elucidated.
The current paper provides a quantitative characterization of the relationship between the statistical properties of environmental stimuli and fly photoreceptor responses. The study is based on a nonlinear dynamical model that predicts accurately the responses of individual fly photoreceptors to white noise and naturalistic stimuli, for the entire environmental range of light intensities.
Higher-order frequency response functions analytically derived from the model equations are then used to characterize the nonlinear transformations that enableDrosophila photorecep-tors to encode measures of dependence between phase angles of different frequency compo-nents of the temporal stimuli, which are invariant to contrast and illumination, such as local phase congruency. We argue that these phase-related measures, which are encoded nonli-nearly, may facilitate the identification of behaviourally important features in the natural scenes.
By carrying out a comparative signal-to-noise analysis of the linear and nonlinear compo-nents of the response, we show that photoreceptors are tuned to selectively improve the Signal-to-Noise Ratio (SNR) of the nonlinear component of the photoreceptor response, which encodes the local phase congruency measure. This explains why the photoreceptor responses to naturalistic stimuli are significantly different from their responses to white noise stimuli.
To validate the results, we carried out electrophysiological experiments using temporal sti-muli that allow us to separate the nonlinear component of the photoreceptor responses, which Competing Interests:The authors have declared
encode local phase congruency, directly from the measured responses. It is shown that our model correctly predicts the measured nonlinear component of the photoreceptor response, elicited by local and non-local phase correlations introduced deliberately in the synthetic stimuli.
A similar analysis carried out using recordings from blindhdcJK910mutant flies, indicates that the nonlinear transformations underlying the detection of phase correlations in the tem-poral light stimuli are performed by phototransduction alone, and do not require synaptic interactions between neighbouring neurons.
The results could have important implications beyond fly photoreceptors. A similar nonlin-ear encoding strategy may well be implemented in the mammalian retina or in other types of sensory neurons.
Materials and Methods
Electrophysiology
Flies were prepared for intracellularin vivorecordings from blue-green sensitive R1-R6 photo-receptors according to previously described methods [9,30]. To present the temporal stimulus pattern at different light levels, we designed a computer controlled point light source with two converging light paths (S1 Fig). In each path, LED drivers with light feedback (Cairn Research, model OptoLED) assured a linear relation between the light pattern, stored on a computer and the output of high power LED’s (Seoul, model Z-Power LED P4, white, 240 lm). Neutral den-sity filters (Kodak Wratten, ND gel filters) were used to generate 5 distinct light intenden-sity levels, fromL0(bright) toL-4(very dark). Only one path was active at a time. This allowed modifying
the filter setting of the inactive path in real time. Step changes of light intensity were thus achieved by switching between the two paths implementing different filter settings. Both LED drivers were carefully calibrated to produce exactly the same light output for a given reference signal and filter setting.
The amplified temporal light stimuli (inputs) and voltage responses (outputs), sampled at 2 kHz, were low-pass filtered by analogue low-pass elliptic filters (KEMO Limited, model VBF/ 23) with a 500 Hz cut-off before being used to drive the LEDs or to perform A/D conversion respectively. The measured output of the LEDs was considered to be the input to the photore-ceptor. A/D and D/A conversions (12bit resolution) were performed using National Instru-ments A/D and D/A boards (PCI M-IO 16E4 and PCI 6713). Custom written software was used to interface the NI boards with MATLAB (Mathworks, R7.14). For modelling and analysis purposes the data was down‐sampled to 400 Hz, which provided sufficient bandwidth to cap-ture in full the photoreceptor dynamics.
Stimuli
To characterize in full the nonlinear photoreceptor dynamics, we used naturalistic input sti-muli that resemble the light fluctuations these cells are subjected to in a fly’s natural habitat. Stimulus sequences with an average power spectrumS(f) = 1/ftypical for natural images were selected from the van Hateren stimulus collection [29].
To derive the adaptation rules over the full operating range, we concatenated stimulus sequences with different mean intensity levels as shown inFig 1a, which allowed us to charac-terize the transient photoreceptor responses to step changes of mean light intensity.
and the electrophysiological recordings were subsequently used to reassemble the correspond-ing processed images for comparison.
The synthetic stimulus sequence mimics what a photoreceptor would experience as a fly moves through a natural scene, containing shadows and sunlit areas. As light intensities in such a scene can vary up to 10,000-fold, we modified our relative illumination range accord-ingly in 5 distinct logarithmic levels (L0= bright toL-4= very dark).
Model Development
[image:4.612.201.450.79.443.2]The photoreceptor model was derived directly from electrophysiological recordings using the nonlinear system identification methodology [31,32] based on the NARMAX (Nonlinear
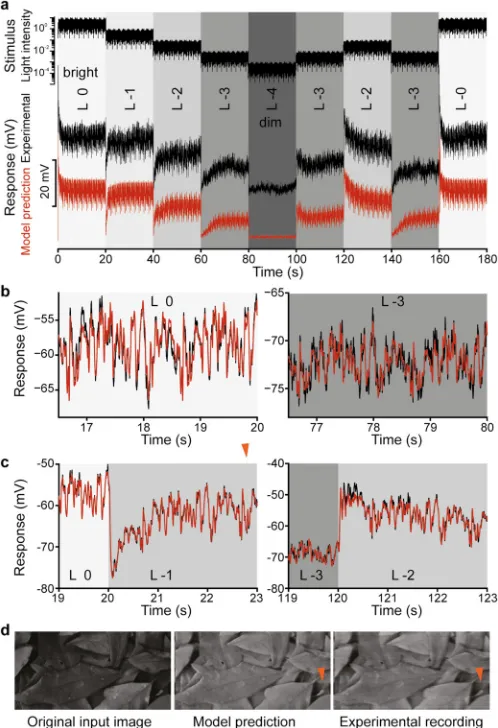
Fig 1. Evaluation of the adaptive photoreceptor model. a, Multi-level naturalistic stimulus sequence (top); in vivoexperimental recordings from a R1-R6Drosophilaphotoreceptor (black) and the photoreceptor model predictions (red) shown with an offset of -25 mV for comparison.b, Short segments of stationary data: experimental (black) and model predicted (red) for two mean intensity levels.c, Model predictions (red) superimposed on experimental response measurements (black) during transient regimes illustrate the performance of the gain control model.d, Images reconstructed from the model predicted response time-series (middle) and thein vivomeasured response time-series (left) corresponding to a temporal stimulus sequence generated by scanning line-by-line the image on the left. The artifacts in the reconstructed images (indicated by a red arrow) reflect photoreceptor adaptation to sharp bright-to-dim changes of intensity values of pixels along the scanned line in the image.
AutoRegressive Moving Average with eXogenous inputs) model, which is applicable to a wide class of nonlinear dynamical systems. The Wiener (Linear-Nonlinear) and Hammerstein (Nonlinear-Linear) models, that are routinely used in neuroscience, can be viewed as special types of NARMAX models. Notable advantages of NARMAX methodology include the fact that it does not require knowledge of the model structure and that the noise is modelled explic-itly to ensure unbiased estimates of model parameters, even if the noise is not additive or white.
The photoreceptor model consists of a polynomial discrete-time NARMAX model with variable input gain complemented by a dynamic gain control model with three adaptation time-scales (S1 FileandS5 Fig). The nonlinear model with an appropriately adjusted gain fully characterizes the photoreceptor dynamics for stimuli with constant mean intensity for the entire operating range. The gain control model captures the dynamic relationship between the stimulus and the gain of the photoreceptor while it adapts to changes in mean light inten-sity. The three control loops reflect the dynamics of different biochemical mechanisms of light adaptation (S1 File) which we characterized in our detailed biophysical model of the photore-ceptor [33].
Photoreceptor Response Decomposition using the Generalized
Frequency Response Functions
Compared with previous models of fly photoreceptors [8,34], the current model not only pre-dicts the photoreceptor responses over the entire environmental range of stimuli but also mod-els explicitly the relationship between the stimulus intensity and the dynamic gain of the nonlinear NARMAX filter. The model can also be used to characterize the nonlinear transfor-mations performed by photoreceptors by deriving analytically the generalized frequency response functions [35–37] (GFRFs) (Fig 2a–2c) of the system. GFRF’s, which are extensions to the classical linear frequency response function, characterize the linear and nonlinear rela-tionships between the photoreceptor’s input and output spectral components.
The approach is similar to that adopted in their pioneering work by Victor and Shapley [3], investigating the receptive field mechanisms of retinal ganglion cells, and by Frenchet al[34] and Asyali and Juusola [38], in their study ofDrosophilaphotoreceptor. Victor and Shapley [3] applied stimuli composed of sums of sinusoids, to estimate, directly from data, the first and sec-ond order kernels of a Wiener series expansion of the response. In the case of the fruit fly, Frenchet al[34] and Asyali and Juusola [38] used steps and white noise sequences, respec-tively, to elicit photoreceptor responses and fit first and second order Volterra kernels.
In contrast, here we use a dynamical model to derive analytically the GFRFs i.e. the Fourier Transforms of the kernels of the Volterra series associated with the nonlinear system (S1 File). The main novelty of our analysis is that we use the GFRFs to compute spectral and temporal decompositions of the response, which allow us to provide an analytical interpretation of the role played by the nonlinear transductions at photoreceptor level rather than in the neurons downstream of photoreceptors. This provides a unique insight into the nonlinear encoding algorithms implemented by the fly photoreceptors.
Specifically, the first-order GFRF,H1(jω) (Fig 2b) can be used to evaluate the magnitude
and phase ofY1(jω), the first-order output spectrum of the system, for any single input
fre-quencyU(jω) = |U(jω)|ejωtasY1(jω) =H1(jω)U(jω).
The second-order GFRF,H2(jω1,jω2) (Fig 2c) can be used to evaluate the magnitude and
phase of the second-order output spectrum of the systemY2(jω) at a frequencyω, in response
to all pairs of input frequenciesUðjo1Þ ¼ jUðjo1Þjejo1t;Uðjo2Þ ¼ jUðjo2Þjejo2tsatisfying
ω=ω1±ω2. In general, thenth-order frequency response function describes the contributions
output spectrum of the photoreceptor, subject to an arbitrary stimulus, is given by [39].
YðjoÞ ¼XN
n¼1
YnðjoÞ ð1Þ
whereYn(jω) is obtained by integrating the contributions from all possible combinations ofn
input frequencies satisfyingω1+ω2+ +ωn=ω
YnðjoÞ ¼ 1
ffiffiffi
n p
ð2pÞn1
Z Pn
i¼1oi¼o
Hnðjo1;jo2;. . .;jonÞ
Yn
i¼1UðjoiÞdso ð2Þ
By applying the inverse Fourier transform, we obtain the equivalent time-domain decompo-sition of the total system response
yðtÞ ¼XN
n¼1
ynðtÞ ð3Þ
intofirst-order (linear), second- and higher-order responses. Eqs (1–3) provide the key to elu-cidate the role of nonlinear transformations at the photoreceptor level.
In our case, given a naturalistic stimulus sequence the total response of the photoreceptory
(t) =y0+y1(t) + h.o.t.can be approximated just by the first and second-order responses; the
relative mean squared error introduced by ignoring the higher order terms is ~1.3% for the bright intensity levelL0and less than 4E-3 for levelsL-1,L-2,L-3.S7g Figshowsy(t)
superim-posed ony1(t) +y2(t) whilstS7h Figshows the magnitude ofY1(jω)+Y2(jω) superimposed on
the total output spectrumY(jω).
SNR Computations
The photoreceptor response decomposition derived earlier allows us to evaluate separately the improvement in the Signal-to-Noise Ratio (SNR) of the linear and nonlinear components of the response, relative to the SNR of the noisy stimulus incorporating edges. One would expect that the photoreceptor processing selectively enhances the phase-related measure of feature significance, which are encoded nonlinearly.
Given the input signal
usþnðtÞ ¼usðtÞ þunðtÞ
whereus(t) is the feature-rich pulse sequence andun(t) is a white noise sequence, the signal-to-noise ratio ofu(t) is defined as
SNRðusþnÞ ¼ PðusÞ
PðunÞ
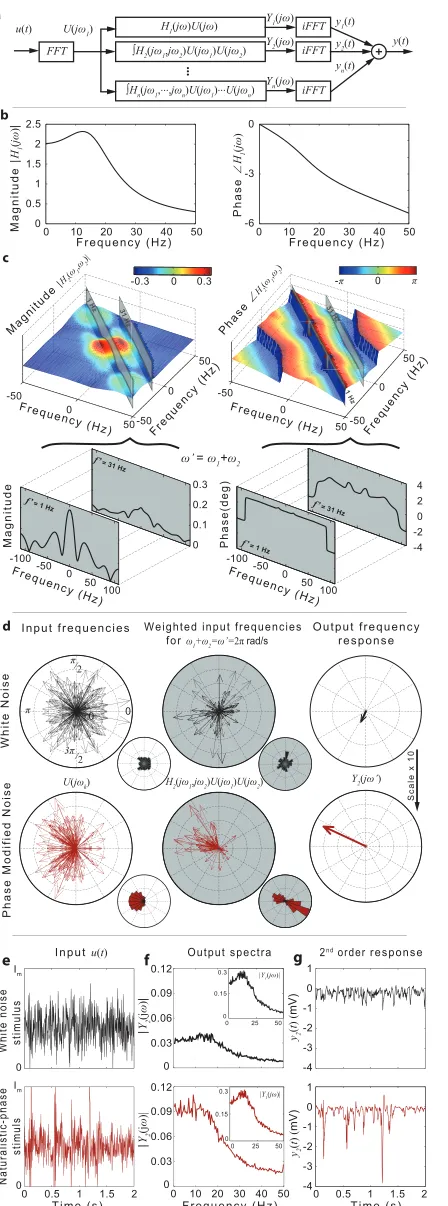
response functions. Slices through the second-order magnitude and phase functions are taken along the integration lines given byf1+f2= 1Hz andf1+f2= 31Hz.d, Polar plots and distributions of the Fourier componentsU(jω) of the white noise (black) and naturalistic phase (red) stimuli before and after weighting by H2(jω1,jω2) for pairs of input frequencies (ω1,ω2) satisfyingω1+ω2=ω’= 2πrad/s. The total output frequency componentY2(jω’) for white noise (black) and naturalistic (red) stimuli obtained by integrating H2(jω1,jω2)U(jω1)U(jω2) along the lineω1+ω2=ω’= 2π.e, White noise (top, black line) and naturalistic-phase (bottom, red line) stimuli.f, Output magnitude spectra |Y1(jω)| and |Y2(jω)| of the first- and second-order responses,y1(t) andy2(t) to white-noise (top, black line) and naturalistic-phase (bottom, red line) stimuli.g, The second-order componenty2(t) of the model responsey(t) for white noise (top, black) and naturalistic-phase (bottom, red line) stimuli.
where
Pðus;nÞ ¼
Z T
0 ju
s;nðtÞj2dt
The noise-free photoreceptor outputys(t) is the response to the noise-free pulse sequence us(t). The output distortion introduced by the noise is defined
ynðtÞ ¼ysþnðtÞ ysðtÞ
whereys+n(t) is the response tous+n(t).
To characterize the signal-to-noise properties of the first and higher-order responses, we decomposeys(t) andyn(t) into first and second-order responses and compute
SNRðysþn 1;2Þ ¼
Pðys 1;2Þ Pðyn
1;2Þ
The photoreceptor’s noise reduction performance was characterized in terms of the SNR improvement factor
Q1;2 ¼M
SNRðysþn 1;2Þ SNRðusþnÞ
which was computed as an average over 50 repetitions. The‘noise-free’inputus(t) consists of a sequence of positive and negative pulses of amplitude +/-4.75, each lasting 50ms, with a delay of 200ms, superimposed on a constant level of background illuminationL0. To account for the
optics of the photoreceptors lens, the pulses were smoothed by convolving the signal with a Gaussian function (5ms standard deviation), accounting for the sensory neurons receptivefield properties.
Results
Photoreceptor Model Predicts Responses to Arbitrary Stimuli over the
Environmental Range of Light Intensities
To demonstrate that the estimated model provides an accurate representation of R1-R6 photo-receptors for the entire environmental range of light intensities, the model was validated exten-sively using intracellular recordings from the photoreceptors of different flies (S1 File). The model predictions match remarkably well the experimental responses to naturalistic (S4 Fig) and white noise stimuli (S6b Fig) as evidenced by the relative mean squared prediction errors summarized inS1andS2Tables respectively. To further illustrate visually the prediction accu-racy, we generated an input time series by scanning line by line a naturalistic image (Fig 1d). This temporal stimulus was used to stimulate photoreceptors and measurein vivotheir responses that were converted back to an image.Fig 1d, shows the original image side-by-side with the images reconstructed from the experimental and model predicted photoreceptor response time series.
The second-order frequency response function explains the difference in
encoding naturalistic and white noise stimuli
analytical GFRFs derived for our model were used to compute and compare the linear and sec-ond-order responsesy1(t) andy2(t) to the original Gaussian white noise (GWN) stimulus
(Fig 2etop) and to the modified GWN stimulus with naturalistic-phase (Fig 2ebottom). In line with previous experimental studies [30], we found that|Y1(jω)|, the magnitude spec-trum of the linear component of the photoreceptor response (Fig 2f–inset panels), dominates the magnitude spectrum of the nonlinear component|Y2(jω)|(Fig 2f—main panels) for GWN as well as naturalistic stimuli. However, whilst|Y1(jω)|essentially remains unchanged, there is
a marked increase of|Y2(jω)|for naturalistic stimulus compared to the GWN case (Fig 2f— main panels). This is also reflected in the time domain. The amplitude of the second order componenty2(t) of the response to the modified GWN stimulus (Fig 2gbottom) is significantly
larger compared to the second order component corresponding to the original GWN stimulus (Fig 2gtop). Specifically, whilst the variance of they2(t) component of the response to the
ran-dom-phase stimulus represents ~2% of the total response, for the naturalistic-phase stimulus with the same magnitude spectrum, the variance of they2(t) component increases to ~50% of
the variance of the total response.
This increase is entirely due to the non-random structure of the phase spectrum. For the white noise stimulus the Fourier componentsUðjωkÞ ¼ jUðjωkÞjejθωk have phase anglesθ
ωk
that are uniformly distributed in the range[0, 2π)(Fig 2dtop). Because the phase of
H2(jω1,jω2)is remarkablyflat for frequencies satisfyingωi+ωj=ω(see for example the phase slice alongf1+f2=f= 1 Hz andf1+f2=f= 31 Hz shown inFig 2c), the phase-angles of the
‘weighted input frequencies’H2(jω1,jω2)U(jω1)U(jω2)satisfyingωi+ωj=ωremain uniformly distributed. Consequently, the magnitude of the second-order frequency spectrum of the responseY2(jω), defined inEq (2)forn= 2, will be small as shown inFig 2f(top). In essence,
the uniform distribution of phases ofH2(jω1,jω2)U(jω1)U(jω2)means that for every complex vectorH2(jω1,jω2)U(jω1)U(jω2)with phaseφthere is a vectorH2(jω01,jω02)U(jω01)U(jω02)
with similar amplitude but opposite phaseφ’=φ±180; these vector pairs tend to cancel out when the integralEq (2)is computed. As a result, the corresponding second order temporal responsey2(t) is small as seen inFig 2g(top). The second-order response is not zero because
the magnitude ofH2(jω1,jω2)is not constant along the constant frequency linesωi+ωj=ω, as shown inFig 2c(magnitude slices alongf1+f2= 1Hz, for example).
For the modified GWN stimulus with‘naturalistic’phase spectrum and white noise magni-tude spectrum, the phases of the frequency componentsU(jωi)and the phases ofH2(jωi,jωj)U
(jωi)U(jωj)are not distributed uniformly and as a result, the magnitude ofY2(jω)does not
can-cel out (Fig 2dbottom panels).
The results show that the photoreceptor is sensitive to the phase structure of the temporal stimuli, specifically to correlations between the phases of different frequency components of the temporal stimulus. The analysis shows that the photoreceptor responds linearly to white noise and nonlinearly to naturalistic, feature rich stimuli because of the particular shape of the phase function associated with the second-order frequency response function.
Fly photoreceptors are tuned to encode robustly temporal local phase
congruency
The previous frequency response analysis predicts that points of high local phase congru-ency, where the difference in phase between different frequency components is zero will elicit very strong second-order responses in fly photoreceptors since in this case the magnitude of
Y2(jω)is just the integral of the magnitude ofH2(jω1,jω2)U(jω1)U(jω2)forωi+ωj=ωi.e. no cancellation occurs.
To test this hypothesis, we designed a synthetic stimulus consisting of a sequence of narrow square pulses (S1 File) superimposed on a Gaussian white noise sequence with meanL0(bright
stimulus). The variance of the stimulus was designed such that the output of the automatic gain control module is essentially constant i.e. gain adaptation plays no role in these experi-ments. The photoreceptor responses to this stimulus, predicted by our model, were found to match closely (S3 Table) thein vivointracellular recordings made from the fly photoreceptors using the same stimulus sequence (S6 Fig).
As before, the model responses were decomposed into linear and nonlinear (second-order) components according to Eqs (1–3) using the GFRFs derived for the NARMAX model with the constant gain corresponding to the‘bright’mean intensity levelL0.
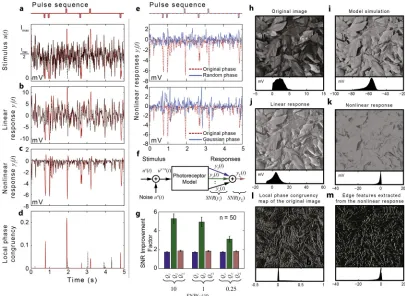
As seen in (Fig 3a and 3b), the pulses are hard to distinguish from the background noise in the synthetic stimulus and the linear component of the model response. In contrast, the nonlin-ear component of the response encodes their location quite precisely by large negative peaks (Fig 3c). Even a simple threshold decoder can be used to extract the encoded‘message’– posi-tion of the pulses—from the nonlinear component of the response. A similar decoder applied to the linear response would generate a significant number of false positives.
Remarkably, the nonlinear response appears very similar to the output (Fig 3d) of an estab-lished algorithm for computing local phase congruency [15], which is widely used to detect edges in computer vision. Given that the phase congruency measure is invariant to changes in intensity and contrast, it provides arguably the most sparse and efficient representation for edge-and line-like features [14].
A major practical implementation issue is that, being a normalized quantity, phase congru-ency is highly sensitive to noise. Although the algorithm used to compute phase congrucongru-ency implements noise reduction techniques [15], it does not detect all the real pulses (Fig 3a) whilst spurious detections still occur (see missing or extra red‘peaks’inFig 3dcompared with pulse locations indicated inFig 3a).
From this point of view, nonlinear transductions at photoreceptor level encode robustly local phase congruence because the nonlinearity is tuned to reject white noise signals. To demonstrate this, we compute the SNR improvement factors (S1 File) for the lineary1(t) and nonlineary2(t)
components of the response to stimuli consisting of a pulse sequence with added white noise hav-ing different variance levels. As seen inFig 3g, fory2(t) the SNR improvement factorQ2is
signifi-cantly higher (almost five fold improvement) thanQ1computed fory1(t) (two fold improvement).
The nonlinear response encodes robustly the phase correlations buried in noise because the phase ofH2(jω1,jω2)is almost constant along the integration pathsω1+ω2=ω, which ensures
that the phase shift introduced by the second-order frequency response function is indepen-dent on the input frequencies.
Artificially changing the phase of the second-order frequency response function, makes the second-order response noisier, reduces the amplitude of the response around the steps and introduces spurious peaks in places where the local phase congruency is low, as seen inFig 3e. This provides strong evidence that the nonlinear transductions in fly photoreceptors are opti-mized to enhance behaviourally important higher-order statistical correlations in the natural scenes whilst being largely insensitive to random-phase stimuli.
local phase congruency. While state-of-the art conventional algorithms based on wavelet filter banks are complex, computationally expensive and sensitive to noise [15], the photoreceptor algorithm implements a single nonlinear filtering operation to encode local phase congruency.
To illustrate the practical applicability of the photoreceptor-inspired edge detection algorithm, we computed edge maps for the image shown inFig 3hby applying a threshold decoder to the standard local phase congruency map of the image (Fig 3h) and to the nonlinear component of the photoreceptor responses to time-series of pixel intensity values along each line of the image. Visually at least, the edge map generated using photoreceptor algorithm (Fig 3m) is‘cleaner’ than the edge map generated using the standard local phase congruency algorithm (Fig 3l).
Fly photoreceptors encode non-local phase correlations between the
spectral components of the input
[image:11.612.169.574.77.373.2]Natural images exhibit not only local but also global phase correlations. It has been argued that both local and global higher order statistics of natural images play an important role in texture
Fig 3. Fly photoreceptors are tuned to detect and enhance phase congruent features. a, Synthetic stimulus (red) consisting of a white noise sequence (dashed black line) superimposed by a sequence of square pulses (50 ms duration) (top).b,c, Linear and nonlinear components of the photoreceptor model responses to the synthetic stimulus (red) and to the pure white noise sequence (dashed black line).d, Local phase congruency measure computed for the synthetic (red) and pure white noise stimuli (dashed black line).e, Changes to the phase of the second-order frequency response function lead to noisier responses (purple) and makes it almost impossible to locate pulses.f, Model used to evaluate SNR improvement factors.g, SNR improvement factors calculated for the linear, second-order and total responses, given different levels of input noise.h, Input image used to generate light stimulus sequence.i, Image reconstructed using the total photoreceptor response.j, Image reconstructed using the linear component of the response.k, Image reconstructed using the nonlinear component of the response.l, Local phase congruency map of the original image.m, Edge features extracted by thresholding the nonlinear response.
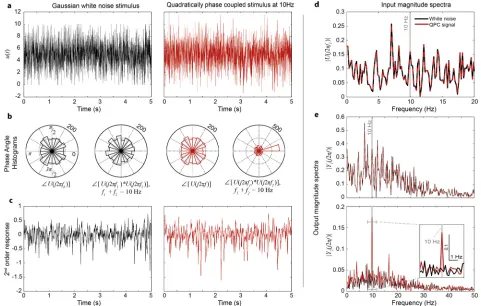
or symmetry discrimination [41,42]. To test the sensitivity of photoreceptors to non-local phase correlations we designed a synthetic stimulus (Fig 4a), which exhibited quadratic phase coupling (QPC) at 10Hz (i.e.phase(f1) +phase(f2) =phase(f3)wheref1+f2=f3=10Hz).
Specifically, the QPC stimulus was constructed by computing the Fourier spectrum of a Gaussian white noise signal, modifying the phases of the spectral components to satisfy the above conditions whilst keeping the magnitude function unchanged and finally applying the inverse Fourier transform (S1 File). As seen inFig 4d, the resulting phase-modified signal has the same Fourier magnitude spectrum as the original white noise signal. However, whilst the phases of the QPC input frequenciesU(jw)are still uniformly distributed between 0 and 2π, they are clearly correlated as seen inFig 4b.
The responses of the photoreceptor model to the white noise and QPC stimuli were decom-posed into linear- and second-order responses (Fig 4c). Subsequently, the Fourier spectrum was computed separately for each component of the photoreceptor response.
[image:12.612.97.578.78.384.2]Because the linear response is not sensitive to the phase structure of the stimulus, the Fou-rier magnitude spectra of the linear responses to the two stimuli sequences are identical (see Fig 4e and 4b). In contrast, as expected, the second-order response to the QPC stimulus shows a significant increase in the magnitude of the 10 Hz output frequency compared with the sec-ond-order response to the white noise stimulus.
Fig 4. Fly photoreceptors detect quadratic phase coupling. a, White noise stimulus (black) and phase-modified white noise stimulus exhibiting quadratic phase coupling (QPC) at 10Hz (red).b, Phase angle histograms of the frequency components of the two stimuli.c, The second-order component of the model response to the white noise (black) and the QPC (red) stimuli.d, Magnitude spectra of the input signals are identical.e, While the magnitude spectra of the linear components of the responses are identical, the magnitude spectrum of the second-order component of the response to the QPC stimulus (red) shows significant magnitude increase at 10Hz, compared to the spectrum of the white noise response (black).
Experimental Validation of the Photoreceptor Model Predictions
The higher order visual processing neurons have to extract the nonlinear codes generated at photoreceptor level from the overall responses. A simple approach to extract the second-order response to a given stimulus is illustrated inS9 Fig. Essentially, the sum of even-order
responses to a given stimulus is the average between the photoreceptor response to the stimulus and the response to the out-of-phase (inverted) version of the stimulus. Since in our case the higher-order responses greater than two are negligible, this method generates the second-order component of the photoreceptor response. Using this approach it was possible to demonstrate experimentally that the nonlinear computations performed by the photoreceptor are indeed those predicted by the model-based analysis.
To extract the second-order responses to a given temporal stimulus directly from the experi-mental recordings we constructed stimulus sequences by alternating the original stimulus sequence with its inverted version (S1 File). The experimental responses to the two versions of the stimuli were averaged and compared with the model predictions. Experiments were carried out using white noise stimuli, stimuli consisting of a pulse sequence superimposed on white noise as well as stimuli exhibiting quadratic phase coupling at 10Hz.
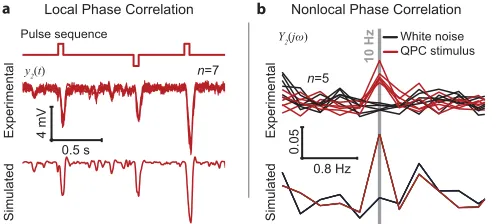
Fig 5ashows that the second-order components of the photoreceptor responses (seven repe-titions) to the stimulus consisting of the pulse sequence superimposed by Gaussian white noise, extracted directly from the experimental recordings and the model predictedy2
component.
As predicted, the nonlinear response is significant around points of maximum local phase congruency; the amplitudes of the negative peaks in the nonlinear response at the location of the pulses represent more than 25% of the corresponding peak amplitudes of the total response. The close match between the model predicted and the experimentally derivedy2
component around the negative excursions triggered by the embedded pulses, is further illus-trated inS10 Fig. The linear- and the second-order components of the response account for ~91% and ~9% of the overall variance of the total response, respectively. The prediction error variance corresponding to they2component extracted directly from experimental data (S10
Fig) represents ~14% of the totaly2variance.
On the other hand, the magnitude spectrum of they2component of the photoreceptor
response to the QPC stimulus (Fig 5b) shows a ~5 fold increase in magnitude at 10Hz com-pared to the magnitude spectrum of they2component of the response to the original GWN
[image:13.612.199.447.533.645.2]stimulus, as predicted by model.
Fig 5. Experimental validation. a, The second-order components of the photoreceptor responses extracted directly fromin vivorecordings (seven repetitions shown) are as predicted by our model. The stimulus used was the pulse sequence superimposed by Gaussian white noise.b, The magnitude spectrum of the second-order component of the response to the quadratically phase coupled (QPC) stimulus, extracted directly from in vivo recordings, shows an increase in magnitude at 10Hz as predicted by our model.
Given that the photoreceptor model was derived using experimental recordings from a dif-ferent fly, these results demonstrate further the validity of our model and, more importantly, that the nonlinear encoding of phase correlations is a generic information processing strategy of fly photoreceptors.
Investigating the role of the retinal network
Photoreceptor responses in wild flies are modulated by feedback from two classes of interneu-rons, i.e. large monopolar cells (LMC) and amacrine cells (AC), and from axonal gap-junc-tions, which pool the responses from six photoreceptors [43–45]. It is therefore natural to ask to what extent the processing capabilities demonstrated earlier are due to temporal processing by the photoreceptor alone. To elucidate this question, we measured photoreceptor responses to the original multi-level naturalistic stimulus in blindhdcJK910mutants [46,47] that lack his-tamine in their photoreceptors. Fly photoreceptors use neurotransmitter hishis-tamine to commu-nicate visual information to interneurons [48]. In the histamine deficient mutants, the lamina interneurons fail to receive and transmit visual information and their feedback synapses can no longer modulate photoreceptor output [47]. Essentially, these mutant flies are blind. By com-paring intracellular recordings from photoreceptors of wild type flies to those ofhdcJK910 mutants, one can test how the lamina network affects adaptation and information processing in photoreceptors.
As seen inS11 Fig, mutant photoreceptor responses have dramatically reduced contrast sensi-tivity for bright (L0) stimuli and their capability to quickly adapt to the mean illumination is
sig-nificantly impaired. However, the light adapted responses of histamine photoreceptors to naturalistic stimuli having a mean luminanceL-1are very similar to wild-type responses. As we
are interested to investigate the nonlinear properties of isolated photoreceptors exhibiting a nor-mal response range, we inferred and validated (S12 Fig) a mutant photoreceptor model using measured responses to naturalistic stimuli sequences with mean luminanceL-1(S1 File). The
sec-ond-order GFRFs (Fig 6a), derived for this model, are very similar to those of wild-type photore-ceptors. In particular, the phase constancy along integration lines is preserved in mutant flies. As a consequence, the mutant photoreceptor responses to the two classes of synthetic stimuli are very similar to the wild type responses (Fig 6b), providing strong evidence that the nonlinear transformations, underlying the detection of high-order phase correlation in the temporal light patterns, are performed by the photoreceptor alone, independently of neighbouring neurons.
Discussion
We have demonstrated that R1-R6 photoreceptors perform nonlinear transformations that encode biologically relevant, higher-order statistical features that are represented in the Fourier phase spectrum of temporal stimuli. In particular, we have shown that photoreceptors encode points of maximum local phase congruency, which occur at the location of an edge or line, as well as long-range phase correlations, which characterize symmetry and texture properties of natural images [41].
This strategy for processing temporal stimuli does not require dynamic adaptation to sti-muli statistics beyond the mean and variance. Specifically, we show that what appears to be an adaptation of the photoreceptor to the statistical structure of the stimuli is in fact explained by the shape of the two-dimensional phase function corresponding to the second-order GFRF of the photoreceptor, which is almost constant along the linesωi+ωj=constant.
From the point of view of information theory, different encoding of naturalistic and white noise signals can be viewed as a solution to the problem of matching the stimulus (source) with the communication channel in a probabilistic sense in order to achieve an optimal trade-off between two competing goals: minimizing distortion in decoding behaviourally relevant sti-muli features and minimizing the information rate, that is, the energetic costs associated with phototransduction [49].
[image:15.612.203.452.77.381.2]The fact that the second-order phase function computed for a separate photoreceptor model, derived forCaliphora, exhibits similar characteristics (seeS8 Fig) to those of Drosoph-ila, suggests that the maximization of sensitivity to phase aligned or coupled frequency com-ponents is a fundamental‘design principle’of fly photoreceptors, which may well apply to other sensory neurons. Previous studies of the primary visual cortex [42,50] have postulated the presence of nonlinear mechanisms that are sensitive to phase correlations. Here we dem-onstrate for the first time that inDrosophilathese mechanisms operate at the photoreceptor
Fig 6. Isolated photoreceptors in thehdcJK910mutant fly demonstrate similar phase processing capabilities to those of wild-type flies. a, The second-order frequency response functions computed for photoreceptors ofhdcJK910mutants are similar to those computed for wild-type photoreceptors. Nonlinear component of thehdcJK910photoreceptor model response clearly indicate location of the 50 ms pulses.c, The magnitude spectrum of the second-order response to the quadratically phase coupled stimulus shows increase in magnitude at 10Hz.
level. The main benefit of implementing nonlinear encoding at photoreceptor level is that it may facilitate the efficient decoding of key stimuli features such as edges, at higher visual pro-cessing levels. Essentially, as we have illustrated earlier, edge maps could easily be extracted from the nonlinear component of the response using a simple threshold decoder. Given that neural circuits are highly optimized, one would expect that in the absence of the nonlinear photoreceptor code the higher visual processing stages would have to implement additional computations, leading to more complex downstream neural circuit architectures. At the same time, encoding temporal edges at photoreceptor level, before the information from six photo-receptors has been pooled by the interneurons, should help improve further the signal-to-noise ratio of the encoded features.
The similarities that exist between responses of primate cones and blowfly photoreceptors [51] suggest that nonlinear transformations performed by cone photoreceptors ultimately achieve the same processing goals, albeit using different molecular mechanisms and signal pro-cessing steps.
Previous experimental and theoretical studies of early visual processing in humans indi-cate the existence of detectors that are highly sensitive to features characterized by high phase congruency [52,53]. We speculate that human photoreceptors implement similar nonlinear processing of the visual stimuli to detect phase congruency, which could help explain why neurons in the primary visual cortex can reliably signal phase congruence and how the phase congruency information is extracted from the visual stimuli. Since moving spatial edges gen-erated by saccadic eye movements or by moving objects generate temporal edges at photore-ceptor level, selectively encoding these temporal features and enhancing their salience, should facilitate downstream processing of the spatio-temporal visual stimuli for edge and motion detection [54].
The simple technique we used to separate the second-order response directly from experi-mental recordings could easily be used to test this hypothesis for mammalian retinal cones.
One could envisage a simple model where eye saccades map localized spatial edges onto temporal edges that are encoded and enhanced by photoreceptors, enabling the downstream neural circuits to use timing in addition to spatial information to detect edges and group them into contours.
As it is not clear how the higher-order spiking neurons could implement efficiently this pro-cessing step, it could be that all downstream visual propro-cessing relies on the phase congruency information generated by photoreceptors to the extent that the absence of this information may incapacitate downstream feature detectors. If this were true, applying such nonlinear transformations to the visual stimuli, prior to delivering these to retinal or ganglion cells, may improve significantly the performance of artificial retinas [55,56].
Supporting Information
S1 Fig. Experimental setup for the acquisition ofin-vivointracellular photoreceptor responses to light stimuli patterns.
(TIF)
S2 Fig. Naturalistic stimuli. a, 2 s representative naturalistic stimulus sequence, used for the modelling procedure.b, Typical 1/f power spectrum of a naturalistic stimulus.c, Naturalistic input sequence and corresponding photoreceptor response. The grey arrows indicate the tran-sient responses during adaptation.d, Adaptation to different duration of stationary stimuli. On the tested timescales (2 s, black; 4 s, purple; 8 s, green) adaptation dynamics are little dependent on the length of the stationary stimulus.
S3 Fig. Neural responses at stationary regimes. a, Experimental transient (grey) and station-ary (black) responses to NTSI stimuli with instant light changes. Slow transients and trends in stationary regions were removed by polynomial fittings (red traces).b, Photoreceptor
responses to repeated stimuli sequences for different mean intensity levels (black) and average response (red) over the 16 s intervals highlighted.
(TIF)
S4 Fig. Comparison of neural responses of different animals.The average photoreceptor response of the six flies for different mean light intensity levels after normalization to a com-mon response offset and deviation.
(TIF)
S5 Fig. Estimation and validation of the gain control model. a, Steady state gain (black) vs. mean light intensity (brown).b, Block diagram of the photoreceptor model incorporating the gain control law (dashed-line box).c, Multilevel light contrast stimulus.d, Gain control model predictions (red) superimposed on the estimated gain response (black).
(TIF)
S6 Fig. Model validation using data recorded from different wild type fly photoreceptors at light levelL0. a, Normalized model predictions to a naturalistic stimulus data sequence
com-pared with the average response (n = 8) of 4 cells.b, as inabut for a 100 Hz band limited white noise stimulus sequence for 3 cells.c, as inabut for a stimulus with positive and negative pulses embedded in noise measured in 8 different photoreceptors. Gain response. The box plots are used to show the variations across experimental recordings prior to normalization.
(TIF)
S7 Fig. Model response decomposition. a, Naturalistic input sequence.b, Input spectrum.c, Linear component of the response.d, First-order output frequency response.e, Second-order component of the output.f, Second-order output frequency response.g, Combined first- and second-order time responses (red) match almost perfectly the overall model response (black).
h, the combined first- and second-order output frequency response (red) matches the overall output frequency spectrum (black).
(TIF)
S8 Fig. Second-order phase functions (slices), shown along integration lines of constant fre-quency, computed for aCalliphoraphotoreceptor model.
(TIF)
S9 Fig. a, Computation of even-order responses.b, Synthetic light stimulus consisting of a sequence of square pulses superimposed on a white noise sequence.c, Inverted version of the stimulus given inb.dande, Photoreceptor model (mean subtracted) responses to the stimuli given inbandcrespectively.f, Even-order response computed by averaging the model predic-tions shown indande, (red) and model predicted nonlinear response (black).g, Local phase congruency measure computed for the synthetic stimulus.
(TIF)
S10 Fig. Nonlinear component of the responsey2(t) predicted by the model (dash-dotted red line) vs.y2(t) component extracted directly from experimental data (solid black line).
(TIF)
hdcJK910mutants lack on-off transients (red arrows, middle panel), demonstrating that synaptic communication between photoreceptors and lamina interneurons is interrupted. The voltage responses (right panel) suggest that synaptic communication increases the range of environ-mental light intensities to which R1‐R6 photoreceptors can adapt. Arrows highlight the key dif-ferences in mutant photoreceptor responses compared to wild-type responses: contrast saturation for bright stimuli and impaired dynamic adaptation. Both wild‐type and the hista-mine rescued photoreceptors show normal processing of naturalistic contrast pattern stimuli.
b, Whole-cell patch-clamp recordings of current responses to 1s prolonged light and flash light stimuli and to 1s Voltage steps in dissociatedhdcJK910photoreceptors.
(TIF)
S12 Fig. Modelling the photoreceptor responses of the histamine mutant flies. a, Boxplots of response amplitudes during stationary light stimulation at light levelL-1for 5 different flies.
b, The mean response based of 8 responses to a single naturalistic stimulus sequence. The mean responses of individual flies are normalized to the mean deviation and amplitude of all flies tested.c, Experimentally measured responses to a repeated stimulus (data set #5) which were used to infer a photoreceptor model.d, Prediction performance of thehdcJK910 photore-ceptor model.e, Correlation tests.
(TIF)
S1 File. Supplementary Methods.
(PDF)
S1 Table. Relative mean square prediction error calculated using the model predicted out-put and normalized photoreceptor responses, measured in six flies (S4 Fig), to the natural-istic stimuli with different mean light intensity levels.
(DOCX)
S2 Table. Relative mean square prediction error calculated using the model predicted out-put and normalized photoreceptor responses, measured in three flies (levelL0responses shown inS6b Fig), to bandlimited (100 Hz) white noise stimuli with different mean inten-sity levels.
(DOCX)
S3 Table. Relative mean square prediction error calculated using the model predicted out-put and normalized photoreceptor responses, measured in eight flies (S6c Fig), to the GWN+pulses stimulus sequence corresponding to a mean light intensity levelL0.
(DOCX)
Acknowledgments
DC, UF, SAB and MJ gratefully acknowledge that this work was supported by the Biotechnol-ogy and Biological Sciences Research Council (BBSRC) grant BB/H013849. We gratefully acknowledge additional support from BBSRC (BB/M025527/1:DC; BB/F012071/1 and BB/ D001900/1:MJ), Engineering and Physical Sciences Research Council (EP/H00453X: SAB and DC) and the European Research Council Advanced Investigator Grant (226037 NSYS: SAB). The authors declare no competing financial interests.
Author Contributions
Wrote the paper: DC UF. Discussed the results and commented on the manuscript: UW SAB RH MJ DC.
References
1. Barlow HBH. Possible principles underlying the transformation of sensory messages. In: Rosenblith W, editor. Sensory Communication. MIT Press; 1961. pp. 217–234.
2. Barlow H. Redundancy reduction revisited. Netw Comput Neural Syst. 2001; 12: 241–253. doi:10. 1080/net.12.3.241.253
3. Victor JD, Shapley RM. Receptive field mechanisms of cat X and Y retinal ganglion cells. J Gen Physiol. 1979; 74: 275–98. Available:http://www.ncbi.nlm.nih.gov/pubmed/490143PMID:490143
4. Rieke F, Bodnar DA, Bialek W. Naturalistic stimuli increase the rate and efficiency of information trans-mission by primary auditory afferents. Proc Biol Sci. 1995; 262: 259–65. doi:10.1098/rspb.1995.0204 PMID:8587884
5. Theunissen FE, Sen K, Doupe AJ. Spectral-temporal receptive fields of nonlinear auditory neurons obtained using natural sounds. J Neurosci. 2000; 20: 2315–31. Available:http://www.ncbi.nlm.nih.gov/ pubmed/10704507PMID:10704507
6. Schneider DM, Woolley SMN. Extra-Classical Tuning Predicts Stimulus-Dependent Receptive Fields in Auditory Neurons. J Neurosci. 2011; 31: 11867–11878. doi:10.1523/JNEUROSCI.5790-10.2011 PMID:21849547
7. Vickers NJ, Christensen TA, Baker TC, Hildebrand JG. Odour-plume dynamics influence the brain’s olfactory code. Nature. 2001; 410: 466–70. doi:10.1038/35068559PMID:11260713
8. van Hateren JH, Snippe HP. Information theoretical evaluation of parametric models of gain control in blowfly photoreceptor cells. Vision Res. 2001; 41: 1851–65. Available:http://www.ncbi.nlm.nih.gov/ pubmed/11369048PMID:11369048
9. Juusola M, de Polavieja GG. The rate of information transfer of naturalistic stimulation by graded poten-tials. J Gen Physiol. 2003; 122: 191–206. doi:10.1085/jgp.200308824PMID:12860926
10. Sharpee TO, Sugihara H, Kurgansky A V., Rebrik SP, Stryker MP, Miller KD. Adaptive filtering enhances information transmission in visual cortex. Nature. 2006; 439: 936–942. doi:10.1038/ nature04519PMID:16495990
11. Carandini M, Demb JB, Mante V, Tolhurst DJ, Dan Y, Olshausen BA, et al. Do we know what the early visual system does? J Neurosci. 2005; 25: 10577–10597. doi:10.1523/JNEUROSCI.3726-05.2005 PMID:16291931
12. Simoncelli EP, Olshausen BA. Natural image statistics and neural representation. 2001;
13. Morrone MC, Owens RA. Feature detection from local energy. Pattern Recognit Lett. 1987; 6: 303– 313.
14. Oppenheim AV, Lim JS. The importance of phase in signals. Proc IEEE. 1981; 69: 529–541. doi:10. 1109/PROC.1981.12022
15. Kovesi P. Image features from phase congruency. Videre J Comput Vis Res. 1999; 1: 1–27.
16. Brinkworth RSA, Mah EL, Gray JP, O’Carroll DC, F. A, A. BS, et al. Photoreceptor processing improves salience facilitating small target detection in cluttered scenes. J Vis. The Association for Research in Vision and Ophthalmology; 2008; 8: 8–8.
17. Thomson MG. Visual coding and the phase structure of natural scenes. Network. 1999; 10: 123–32. Available:http://www.ncbi.nlm.nih.gov/pubmed/10378188PMID:10378188
18. Juusola M, Kouvalainen E, Järvilehto M, Weckström M. Contrast gain, signal-to-noise ratio, and linear-ity in light-adapted blowfly photoreceptors. J Gen Physiol. 1994; 104: 593–621. Available:http://www. ncbi.nlm.nih.gov/pubmed/7807062PMID:7807062
19. Marr D. Vision a computational investigation into the human representation and processing of visual information. MIT Press; 2010.
20. Ruderman DL, Bialek W. Statistics of Natural Scenes: Scaling in the Woods. Phys Rev Lett. 1994; 73: 814–817. doi:10.1038/1811181a0PMID:10057546
21. Olshausen BA, Field DJ. Natural image statistics and efficient coding. Netw Comput Neural Syst. 1996; 7: 333–339. doi:10.1088/0954-898X_7_2_014
22. Tkačik G, Prentice JS, Victor JD, Balasubramanian V. Local statistics in natural scenes predict the saliency of synthetic textures. Proc Natl Acad Sci. 2010; 107: 18149–18154. doi:10.1073/pnas. 0914916107PMID:20923876
24. Wainwright MJ, Schwartz O, Simoncelli EP. Natural image statistics and divisive normalization: Model-ing nonlinearities and adaptation in cortical neurons. Statistical theories of the brain. 2001. pp. 203– 222.
25. Srinivasan M V., Bernard GD. The effect of motion on visual acuity of the compound eye: A theoretical analysis. Vision Res. 1975; 15: 515–525. doi:10.1016/0042-6989(75)90029-2PMID:1129998
26. Srinivasan M V., Bernard GD. The pursuit response of the housefly and its interaction with the optomo-tor response. J Comp Physiol A. 1977; 115: 101–117. doi:10.1007/BF00667788
27. Juusola M, French AS, Egelhaaf M, Hausen K, Reichardt W, Wehrhahn C, et al. Visual acuity for mov-ing objects in first- and second-order neurons of the fly compound eye. J Neurophysiol. 1997; 77: 1487–95.
28. Burton BG, Laughlin SB. Neural images of pursuit targets in the photoreceptor arrays of male and female houseflies Musca domestica. J Exp Biol. 2003; 206: 3963–77. doi:10.1242/jeb.00600PMID: 14555737
29. Van Hateren JH. Processing of Natural Time Series of Intensities by the Visual System of the Blowfly. Vis Res. 1997; 37: 3407–3416. PMID:9425553
30. Juusola M, Hardie RC. Light adaptation in Drosophila photoreceptors: I. Response dynamics and sig-naling efficiency at 25 degrees C. J Gen Physiol. 2001; 117: 3–25.
31. Chen S, Billings SA. Representations of non-linear systems: the NARMAX model. Int J Control. 1989; 49: 1013–1032. doi:10.1080/00207178908559683
32. Billings SA. Nonlinear system identification. Chichester, UK: John Wiley & Sons, Ltd; 2013.
33. Song Z, Postma M, Billings SA, Coca D, Hardie RC, Juusola M. Stochastic, adaptive sampling of infor-mation by microvilli in fly photoreceptors. Curr Biol. 2012; 22: 1371–1380. doi:10.1016/j.cub.2012.05. 047PMID:22704990
34. French AS, Korenberg MJ, Järvilehto M, Kouvalainen E, Juusola M, Weckström M. The dynamic non-linear behavior of fly photoreceptors evoked by a wide range of light intensities. Biophys J. 1993; 65: 832–9. doi:10.1016/S0006-3495(93)81116-0PMID:8218908
35. Billings SA, Tsang KM. Spectral analysis for non-linear systems, Part II: Interpretation of non-linear fre-quency response functions. Mech Syst Signal Process. 1989; 3: 341–359.
36. Billings SA, Peyton Jones JC. Mapping non-linear integro-differential equations into the frequency domain. Int J Control. 1990; 52: 863–879. doi:10.1080/00207179008953572
37. Jones JCP, Billings SA. Recursive algorithm for computing the frequency response of a class of non-lin-ear difference equation models. Int J Control. 1989; 50: 1925–1940. doi:10.1080/00207178908953474
38. Asyali MH, Juusola M. Use of Meixner functions in estimation of Volterra kernels of nonlinear systems with delay. IEEE Trans Biomed Eng. 2005; 52: 229–237. doi:10.1109/TBME.2004.840187PMID: 15709660
39. Lang ZQ, Billings SA, Yue R, Li J. Output frequency response function of nonlinear Volterra systems. Automatica. 2007; 43: 805–816. doi:10.1016/j.automatica.2006.11.013
40. Morrone MC, Burr DC. Feature detection in human vision: a phase-dependent energy model. Proc R Soc London Ser B, Biol Sci. 1988; 235: 221–45. doi:10.1098/rspb.1988.0073
41. Oka S, Victor JD, Conte MM, Yanagida T. VEPs elicited by local correlations and global symmetry: Characteristics and interactions. Vision Res. 2007; 47: 2212–2222. doi:10.1016/j.visres.2007.03.020 PMID:17604074
42. Victor JD, Mechler F, Ohiorhenuan I, Schmid AM, Purpura KP, Abbott L, et al. Laminar and orientation-dependent characteristics of spatial nonlinearities: implications for the computational architecture of visual cortex. J Neurophysiol. 2009; 102: 3414–32. doi:10.1152/jn.00086.2009PMID:19812295
43. Zheng L, Nikolaev A, Wardill TJ, O’Kane CJ, de Polavieja GG, Juusola M. Network adaptation improves temporal representation of naturalistic stimuli in Drosophila eye: I dynamics. PLoS One. 2009; 4: e4307. doi:10.1371/journal.pone.0004307PMID:19180196
44. Shaw SR. Early visual processing in insects. J Exp Biol. 1984; 112: 225–51. Available:http://www.ncbi. nlm.nih.gov/pubmed/6392468PMID:6392468
45. Wardill TJ, List O, Li X, Dongre S, McCulloch M, Ting C-Y, et al. Multiple spectral inputs improve motion discrimination in the Drosophila visual system. Science. 2012; 336: 925–31. doi:10.1126/science. 1215317PMID:22605779
47. Melzig J, Buchner S, Wiebel F, Wolf R, Buchner E, Burg M, et al. Genetic depletion of histamine from the nervous system of Drosophila eliminates specific visual and mechanosensory behavior. J Comp Physiol A. 1996; 179: 763–773. doi:10.1007/BF00207355PMID:8956497
48. Hardie RC. A histamine-activated chloride channel involved in neurotransmission at a photoreceptor synapse. Nature. 1989; 339: 704–706. doi:10.1038/339704a0PMID:2472552
49. Niven JE, Anderson JC, Laughlin SB. Fly photoreceptors demonstrate energy-information trade-offs in neural coding. PLoS Biol. 2007; 5: e116. doi:10.1371/journal.pbio.0050116PMID:17373859
50. Felsen G, Touryan J, Han F, Dan Y. Cortical sensitivity to visual features in natural scenes. PLoS Biol. 2005; 3: e342. doi:10.1371/journal.pbio.0030342PMID:16171408
51. van Hateren JH, Snippe HP. Phototransduction in primate cones and blowfly photoreceptors: different mechanisms, different algorithms, similar response. J Comp Physiol A. 2006; 192: 187–197. doi:10. 1007/s00359-005-0060-y
52. Mechler F, Reich DS, Victor JD. Detection and discrimination of relative spatial phase by V1 neurons. J Neurosci. 2002; 22: 6129–57.
53. Henriksson L, Hyvarinen A, Vanni S. Representation of cross-frequency spatial phase relationships in human visual cortex. J Neurosci. 2009; 29: 14342–14351. doi:10.1523/JNEUROSCI.3136-09.2009 PMID:19906981
54. Rucci M, Iovin R, Poletti M, Santini F. Miniature eye movements enhance fine spatial detail. Nature. 2007; 447: 852–855. doi:10.1038/nature05866
55. Mathieson K, Loudin J, Goetz G, Huie P, Wang L, Kamins TI, et al. Photovoltaic retinal prosthesis with high pixel density. Nat Photonics. 2012; 6: 391–397. doi:10.1038/nphoton.2012.104PMID:23049619