The London School of Economics and Political Science
Big data analytics and organisational change. The case of
learning analytics
Marta Stelmaszak Rosa
Declaration
I certify that the thesis I have presented for examination for the PhD degree of the London School of Economics and Political Science is solely my own work other than where I have clearly indicated that it is the work of others (in which case the extent of any work carried out jointly by me and any other person is clearly identified in it).
The copyright of this thesis rests with the author. Quotation from it is permitted, provided that full acknowledgement is made. This thesis may not be reproduced without my prior written consent.
I warrant that this authorisation does not, to the best of my belief, infringe the rights of any third party.
I declare that my thesis consists of 85,443 words (including footnotes but excluding bibliography and appendices).
Statement of use of third party for editorial help
Abstract
Much of the Information Systems (IS) literature on Big Data Analytics (BDA) assumes a straightforward relationship between human activity and data, and between data and analytical insights that can be used to steer operations (e.g. Chen, Preston and Swink, 2015; Brynjolfsson, Geva and Reichman, 2016; Yahav, Shmueli and Mani, 2016). On the other hand, researchers also try to understand the role of big data within organisations, the contributions of analytics to strategy and decision-making, and the value of big data and its organisational consequences (Constantiou and Kallinikos, 2015; Abbasi, Sarker and Chiang, 2016; Günther et al., 2017). At the same time, more critical scholars have suggested that the implications of BDA can go beyond decision-making, sometimes twisting or even undermining managerial efforts (Newell and Marabelli, 2015; Galliers et al., 2017; Markus, 2017). This research investigates how BDA systems change organisations that implement them and aims to uncover the resulting organisational transformations.
Acknowledgments
I would like to thank the Information Systems and Innovation Group at the Department of Management at the LSE for the support and guidance that were necessary from the very first to the last day of my doctoral training. I am very grateful for the PhD Studentship I received, which was instrumental in completing this work, as well as for other opportunities to develop academically and intellectually.
My thanks go to all faculty who over the years volunteered feedback on my work, among whom I would like to offer special thanks to Cristina Alaimo, Antonio Cordella, Shirin Madon, Maha Shaikh, and Carsten Sørensen for always being available to answer my questions. I would like to thank also my colleagues at the Department, who created a collegial and supportive environment.
Thank you to Aleksi Aaltonen, whose help and support went above and beyond the call of duty and made this work possible.
A heartfelt thank you to my family and friends, whose patience and support I have relied upon over the years. Thank you to my husband Nuno, who provided encouragement when needed and challenged me with questions when necessary.
I am thankful to all the interviewees at the organisation I studied, who very generously volunteered their time and answers.
Table of Contents
Declaration ... 2
Statement of use of third party for editorial help ... 2
Abstract ... 3
Acknowledgments ... 4
List of Abbreviations ... 10
List of Tables ... 10
List of Figures ... 10
Chapter 1: Introduction ... 11
1. Introduction ... 11
2. Introduction to the problem area ... 11
3. Research approach ... 12
4. Research objectives ... 14
5. Thesis outline ... 15
Chapter 2: Background literature ... 17
1. Introduction ... 17
2. Information Systems and Big Data Analytics ... 17
2.1. Characteristics of big data ... 17
2.2. Processes of big data production ... 21
2.2.1. Encoding ... 22
2.2.2. Aggregation ... 22
2.2.3. Correlation ... 23
2.2.4. Contributions from adjacent fields ... 23
2.3. Big data and its analytics ... 24
2.4. Conclusions ... 29
3. Measurement and data ... 30
3.1. Big data analytics as measurement ... 30
3.2. Measuring the social in social sciences ... 31
3.2.1. Representation ... 32
3.2.2. Commensuration and quantification ... 33
3.2.3. Numbers ... 35
3.2.4. Calculation ... 37
3.2.5. Standardisation ... 39
3.2.6. Classification, categorisation and aggregation ... 40
3.2.7. Indices and indicators ... 42
3.2.8. Rankings ... 42
3.2.9. Statistics ... 44
3.2.10. Computation ... 45
3.3. Big data analytics and mechanisms of measurement ... 46
3.4. Conclusions ... 49
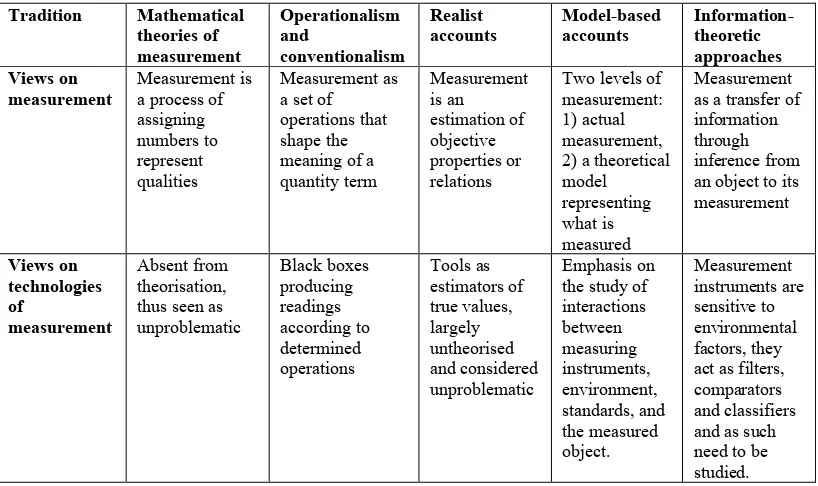
4.1. Theories of measurement ... 50
4.1.1. Mathematical theories of measurement ... 51
4.1.2. Operationalism and conventionalism ... 52
4.1.3. Realist accounts ... 53
4.1.4. Model-based accounts ... 54
4.1.5. Information-theoretic approaches ... 55
4.1.6. Conclusions ... 57
4.2. Overview of the technologies of measurement ... 58
4.2.1. Body parts as technologies of measurement ... 58
4.2.2. Objects as technologies of measurement ... 59
4.2.3. The development of statistics and computing ... 61
4.2.4. Evaluative infrastructures of the internet ... 62
4.2.5. Conclusions ... 63
4.3. Towards new technologies of measurement ... 63
4.4. Conclusions ... 64
5. Conclusions ... 65
Chapter 3: Education, data and Learning Analytics ... 66
1. Introduction ... 66
2. History of educational measurement ... 66
2.1. Measuring education in the Middle Ages ... 67
2.2. The Renaissance turn to ranking systems ... 68
2.3. The 19th century marking systems ... 69
2.4. Educational measurement and the state ... 69
2.5. The rise of standardised testing ... 71
2.6. Educational measurement and ICT ... 71
2.7. The emergence of database infrastructures ... 72
3. Learning Analytics ... 73
3.1. Data collection in LA ... 75
3.2. Data processing in LA ... 75
3.3. Data dissemination in LA ... 76
3.4. Example of LA ... 77
4. Learning Analytics literature ... 79
4.1. Learning Analytics methods ... 79
4.2. Organisational Impacts of Learning Analytics ... 80
4.3. Critical Learning Analytics ... 81
4.4. Conclusions ... 84
5. Conclusions ... 84
Chapter 4: Research Questions ... 85
Chapter 5: Theoretical framework ... 87
1. Introduction ... 87
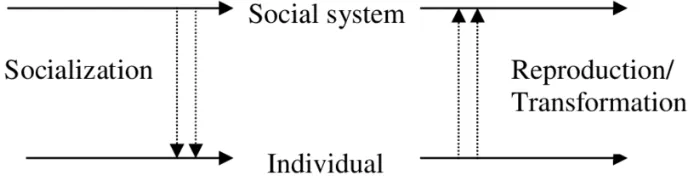
3. Transformational Model of Social Activity ... 88
4. Morphogenesis and morphostasis ... 91
5. Conclusions ... 94
Chapter 6: Analytical framework ... 95
1. Introduction ... 95
2. Translating social activity into big data ... 95
3. Big data analytics and organisational transformation ... 97
3.1. Mechanisms of reactivity ... 99
3.2. Effects of reactivity ... 100
3.3. Extending the theory of reactivity ... 102
3.4. The theory of reactivity in management and information systems ... 104
4. Conclusions ... 105
Chapter 7: Methodology ... 106
1. Introduction ... 106
2. Retroduction ... 106
3. Research design ... 107
4. Pilot study ... 110
5. Main data collection ... 111
6. Coding and analysis ... 113
7. Conclusions ... 115
Chapter 8: Case study narrative ... 117
1. Introduction ... 117
2. Business school educational context: a numbers game ... 117
2.1. Competitive landscape of higher education in the UK ... 117
2.2. Competing as a business school ... 119
3. The University setting ... 121
4. The School ... 122
4.1. Senior Management ... 124
4.2. Technology Strategy Committee ... 124
4.3. The IT team ... 126
5. The VLE ... 128
5.1. Development of the VLE ... 128
5.2. Logical structure of the VLE ... 130
5.3. Teaching functionalities on the VLE ... 131
5.4. Administrative functionalities on the VLE ... 131
5.5. VLE use training ... 132
6.1. History of development ... 132
6.2. Back-end of the LA system ... 134
6.3. Front-end of the LA system ... 135
6.4. Adoption of the LA system at the School ... 138
7. Conclusions: towards an analytical campus ... 140
Chapter 9: Analysis ... 142
1. Introduction ... 142
2. Learning analytics as big data analytics ... 142
2.1. Volume ... 143
2.2. Velocity ... 143
2.3. Variety ... 144
2.4. Granularity ... 145
2.5. Exhaustivity ... 147
2.6. Veracity ... 148
2.7. Use-agnosticity ... 150
2.8. Conclusions ... 153
3. Learning Analytics as a technology of measurement ... 153
3.1. Measurement processes in Learning Analytics ... 154
3.2. Learning Analytics as a digital technology of measurement ... 158
3.2.1. Distributedness ... 159
3.2.2. Editability ... 161
3.2.3. Interactivity ... 162
3.2.4. Openness and reprogrammability ... 163
3.3. Conclusions ... 164
4. Producing Learning Analytics Data ... 165
4.1. Encoding ... 165
4.2. Aggregation ... 169
4.3. Correlation ... 171
4.4. Conclusions ... 172
5. Conclusions ... 172
Chapter 10: Reactivity of Learning Analytics ... 173
1. Introduction ... 173
2. Intentional shaping of teaching and learning practices ... 173
2.1. Administration and professional services staff ... 174
2.2. Teaching staff ... 175
2.3. Technical staff ... 175
2.4. Academic staff ... 176
2.5. Conclusions ... 176
3.1. Redefining work and practices ... 177
3.2. Resource redistribution ... 179
3.3. Change of values ... 181
3.4. Gaming the analytics ... 183
4. Mechanisms of reactivity ... 185
4.1. Commensuration ... 185
4.2. Self-fulfilling prophecy ... 186
4.3. Reverse engineering ... 187
4.4. Narratives ... 188
4.5. Conclusions ... 190
5. Emergent effects of reactivity ... 190
5.1. Discipline through analytics ... 190
5.2. Standardising through data ... 192
5.3. Acceleration with analytics ... 193
6. Conclusions ... 196
Chapter 11: Discussion ... 197
1. Introduction ... 197
2. The consequences of measuring the social with Big Data Analytics ... 197
3. Testing and extending the theory of reactivity ... 201
4. Big data analytics and organisational change ... 204
5. The analytical cage as a new form of organising ... 207
5.1. Elements of the cage ... 208
5.2. Operation of the cage ... 210
5.3. Consequences of working in the analytical cage ... 211
5.4. The evolution of the cage ... 212
6. Conclusions ... 213
Chapter 12: Conclusions ... 215
1. Introduction ... 215
2. Summary of findings ... 215
3. Contributions and implications ... 216
4. Limitations and further research ... 218
References ... 220
Appendix 1 – Pilot study report ... 237
Appendix 2 – Example interview guide ... 239
List of Abbreviations
BDA – Big Data Analytics IS – Information Systems LA – Learning Analytics
TMSA – Transformational Model of Social Activity VLE – Virtual Learning Environment
List of Tables
Table 1 Main streams of Information Systems literature on Big Data Analytics ... 25
Table 2 Big Data Analytics and mechanisms of measurement ... 47
Table 3 Theoretical perspectives on technologies of measurement ... 57
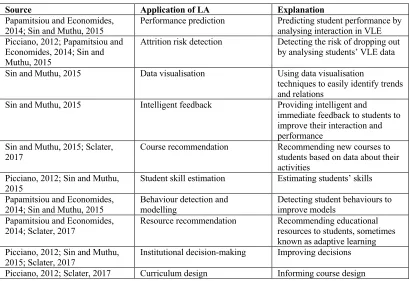
Table 4 Uses of Learning Analytics identified in literature ... 74
Table 5 Key TMSA concepts and their application in this research ... 94
Table 6 Reactive mechanisms and effects (Espeland and Sauder, 2007; Sauder and Espeland, 2009) ... 101
Table 7 Retroductive methodology deployed in this research ... 107
Table 8 Summary of research design ... 110
Table 9 Summary of data sources, types, and quantity ... 112
Table 10 Tracing theoretical codes to emerging themes and data ... 114
Table 11 Benefits and drawbacks of measuring performance with BDA ... 164
List of Figures
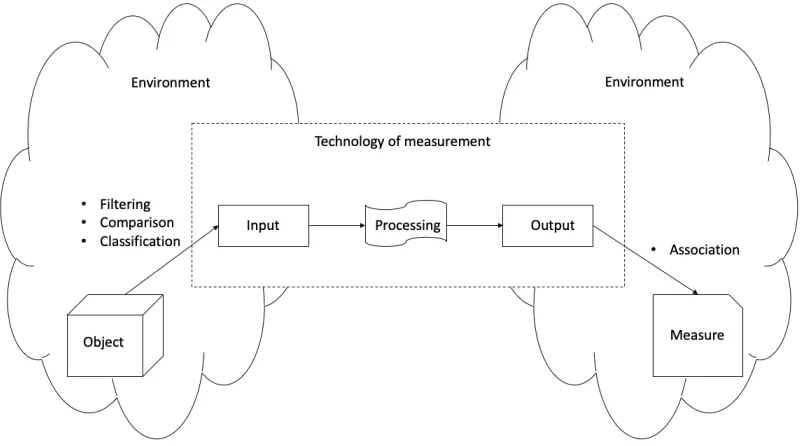
Figure 1 Technology of measurement as an information system ... 58Figure 2 OU Analyse - student overview page. Source: Kuzilek et al. 2015 ... 78
Figure 3 Proposed theorisation of the field with research gap ... 86
Figure 4 Bhaskar's original TMSA model. Source: Archer and Bhaskar, 1998 ... 90
Figure 5 The morphogenetic cycle. Source: Archer and Bhaskar, 1998 ... 92
Figure 6 Transformational Model of Change. Source: Archer and Bhaskar, 1998 ... 93
Figure 7 The codification of social action (Alaimo and Kallinikos, 2016) ... 96
Figure 8 Social life made computable (Alaimo and Kallinikos, 2016) ... 96
Figure 9 Model of analysis adopted in the study ... 105
Figure 10 Distribution of codes in data ... 114
Figure 11 LA system: usage statistics for messages, S_016 ... 136
Figure 12 LA system: aggregated usage statistics for messages, S_017 ... 136
Figure 13 LA system: progress statistics, S_019 ... 137
Figure 14 LA system: breakdown of activity into quartiles, S_018 ... 137
Figure 15 LA system: weekly views, S_020 ... 138
Chapter 1: Introduction
1.
Introduction
In this chapter, I introduce the problem of Big Data Analytics (BDA) by presenting its1 background, the central thesis of this research, and the significant ramifications and contributions of this project towards the study of Information Systems (IS) and organisations. I discuss the approach and objectives guiding this research, and I provide the thesis outline.
2.
Introduction to the problem area
BDA is rapidly entering organisations and is seen as a way to obtain better, more accurate, previously unavailable data to support decision-making and unlock stores of value. The rapid introduction of analytical systems has taken root particularly in areas where previously data was considered scarce, unreliable or inauthentic. Big data of the social – customer preferences, taste, behaviour – developed rapidly on various social media and advertising platforms, turning social activities such as liking something, adding friends or choosing one music genre over another into data points. Similarly, organisations turned to using big data to record and measure not only their customers’ online activities, but also that of their employees, attracted by the promise of better information, faster decision-making and improved organisational outcomes. To reap the promised benefits of BDA, organisations implement various analytical systems to measure diverse aspects of organisational performance, with hope for improvements according to a range of performance indicators.
Together with the deployment of such systems comes the need to not only constantly develop better analytical tools and models, but also implement changes in processes, organisational units, and strategies. IS research has thus far focused on three main areas concerning BDA. First, researchers investigate better analytical tools and statistical models to help organisations and other IS researchers in conducting more efficient and useful analytics (see e.g. Chen, Chiang and Storey, 2012; Brynjolfsson, Geva and Reichman, 2016). The second research agenda concerns the development of the understanding of BDA in strategy and decision-making in order to unpack the links between analytics and strategy, decision-decision-making and value (Constantiou and Kallinikos, 2015; Abbasi, Sarker and Chiang, 2016). Third, and adjacent to
1 In this work, to improve readability and in line with common usage, I treat data, big data, and data analytics as
these two, is a critical stream of IS research into BDA which emphasises the need to uncover the effects of BDA on organisations, the transformative character of analytics, and the societal consequences of datafication (Lycett, 2013; Newell and Marabelli, 2015; Markus, 2017).
Within this rich body of scholarship, there is a paucity of research investigating the interactions between work with analytics, changes in organisational structures, and wider stakeholder and societal consequences (Günther et al., 2017). In other words, researchers have hitherto focused on understanding either the work level, the organisational level or the supra-organisational level of BDA separately, and not on uncovering cross-level interactions that can both shape how BDA is used and be essential to extracting value from BDA. The present study is an investigation into how work and practices surrounding BDA are contingent upon the organisational structures within which they are embedded while simultaneously leading to both intended and unintended changes in the very same organisational structures. This research is an attempt to complement the existing body of literature on BDA by bridging the agency and structural levels of BDA, in order to uncover the mechanisms by means of which work with analytics shapes organisations.
3.
Research approach
The central question of this research is how organisations change, or are transformed, as a result of implementing BDA. To better understand this phenomenon, I studied an organisation that deployed a BDA system to measure the online activities of its customers (i.e. students) and staff. Focusing on the aspect of measuring staff performance, I investigated how work practices changed at this organisation as a result of incorporating BDA in the day-to-day work of various members of staff across several functions. Setting these findings against the organisational background, I unpicked the intended and unintended consequences that led to organisational change.
shaping relationship, and “the reproduction and transformation of social structure is a generally unintended consequence of human action” (Faulkner and Runde, 2013, p. 804).
In order to uncover this reproduction or transformation, the concepts of encoding, aggregation and correlation (Alaimo and Kallinikos, 2017) were deployed to analyse how data is produced, and the theory of reactivity (Espeland and Sauder, 2007), originally developed to study university rankings, was adapted to trace the mechanisms and effects of organisational transformation in the case studied. According to Espeland and Sauder, all measurement and measures may lead to reactivity, i.e. individuals altering their behaviour in reaction to being evaluated, observed or measured. Actors adjust behaviours under measurement, which both affects their actions but also limits the methodological validity of the measurement process itself (Espeland and Sauder, 2007). Therefore, this analytical framing provides a potent lens through which the case can be analysed.
The case study investigated is a UK business school that developed and deployed a sophisticated Learning Analytics (LA) system to monitor teaching and learning practices. LA systems are examples of BDA that focus on the analytics of social data, that is big data concerning users’ online activities that constitute a trace or shadow of their socially-embedded behaviours (Alaimo, 2014). In this case, I focused on the use of the LA system by staff and concerning staff activity, rather than student – that is customer – online activity. The use of a single-case research design (Yin, 1994) is justified, as it enables the collection of rich evidence that allows for intensive, contextual understanding of the phenomenon (Flyvbjerg, 2006).
changing work practices surrounding BDA transform the organisations within which they are embedded.
4.
Research objectives
The study was conceived to provide a number of significant contributions to the field of IS. First, by carefully analysing the production and characteristics of the BDA system data, this research offers a clarification of the distinctive nature of big data as opposed to other forms and types of data. Based on a thorough overview of the literature concerning big data, the thesis teases out the defining characteristics of this phenomenon, and in doing so provides an answer to the two opposing views concerning big data, one making claims concerning the revolutionary nature of big data, and the other stating that big data is a continuation of a longer history of statistics with a few differences in terms of quantity rather than quality. Second, the study allows for the testing and extension of the theory of reactivity into the realm of BDA.
Finally, and most importantly, this research helps provide an answer to the question of how organisations change as a result of implementing BDA. As I analyse and synthesise the data obtained in this study, it is evident that the introduction of BDA systems impacts work practices of various members of staff. Some such impacts are intended and intentional. However, due to the measurement-related nature of BDA, such systems become nexuses of reactive mechanisms (commensuration, self-fulfilling prophecies, reverse engineering, and narratives), and when enmeshed with human agency, they lead to unintended, reactive effects (redefining work and practices, resource redistribution, change of values, gaming, discipline, standardisation, and acceleration). These reactive mechanisms and effects lead to organisational change, as presented throughout the thesis, and lead to the emergence of analytical cages – discussed in depth in Chapter 11.
5.
Thesis outline
The thesis is structured as follows:
This chapter provides an introduction to the study by outlining its motivation and scope as well as summarising the theoretical approach taken and the main contributions.
Chapter 2 synthesises background literature relevant to the study in order to present the various mechanisms through which BDA mediates the social world. First, extant literature on Information Systems and BDA is presented in section 2 to summarise the scholarship on the characteristics of big data and delineate the current research at work-practice, organisational and supra-organisational levels. This section is followed by a review of research into measurement and data in section 3, which provides details of the measurement mechanisms, from representation to computation, that are involved in the production of data in BDA. Research into measurement and its relationship with technology is presented in section 4, where BDA systems are presented as new measurement technologies with digital properties that influence the nature of measurement.
Chapter 3 summarises the extant research on education, data and LA, and presents an overview of LA, and highlights the unanswered questions stemming from this nascent literature.
In Chapter 4, the background literature is summarised to carve out the main research question, that is “how does big data analytics change organisations that implement it?” as well as supplementary questions arising from the various strands of the literature on measurement and measurement technology. Thus, against the literature reviewed, it is argued that organisational changes resulting from the implementation of BDA at the work level need to be unpacked and understood.
Chapter 5 provides an overview of the theoretical framework guiding this research project. Within the critical realist paradigm, the Transformational Model of Social Activity (TMSA) is presented as a theoretical scaffolding fit to support this study. Within the chapter, the TMSA is reviewed and mapped with key concepts in the research project.
of the theory of reactivity in the study of management and information systems is assessed to confirm the validity of this analytical approach to studying organisational change.
Chapter 7 details the methodological approach adopted in this research. It begins by summarising how the retroductive approach (Mingers, Mutch and Willcocks, 2013) drawn from critical realism assists in the process of identifying and validating mechanisms, before moving into an overview of the research design. The pilot study undertaken is summarised, and next a detailed description is provided of the main data collection, coding, and analysis.
Against this background, Chapter 8 presents a thorough description of the case study narrative. The narrative allows for the presentation of the background of the organisation as well as its internal operations. It also discusses the emergence and use of the Virtual Learning Environment (VLE) and the LA system. The picture presented in this chapter is that of a data-based organisation.
Chapter 9 delves into the analytical details of the case. It starts by analysing LA as a BDA system and challenges a range of typical characteristics associated with big data. It then provides an analytical reading of the LA system as a digital technology of measurement. Section 3 of this chapter analyses how LA data is produced through the processes of encoding, aggregation, and correlation.
Chapter 10 focuses on the analysis of data through the lens of the theory of reactivity, first by describing the intentional shaping of teaching and learning practices identified, then by moving into the unintended effects of reactivity, before proceeding to the analysis of the mechanisms of reactivity. The last sub-section summarises the emergent effects of reactivity identified in the case.
In Chapter 11, the findings are summarised and discussed. First, the consequences of measuring the social with BDA are fleshed out. Second, arguments are presented concerning how the theory of reactivity can be tested and extended in the BDA context. Finally, the findings concerning BDA and organisational change are summarised and theorised to provide a comprehensive understanding and an answer to the main research question, leading to the formulation of the concept of the analytical cage as a new form of organising.
Chapter 2: Background literature
“Count what is countable, measure what is measurable, And what is not measurable make measurable” Galileo (in: Aumala, 1999)
1.
Introduction
In this chapter, I present background literature pertinent to the understanding of various mechanisms through which Big Data Analytics (BDA) mediates and shapes the social world it purports to describe. I start by outlining the extant scholarship related to big data and analytics in Information Systems (IS) in order to tease out the main research problem that this project addresses, namely the lack of theorisation of how BDA shapes organisations that implement it. Concurring with the literature reviewed, I argue that BDA should be seen as form of measurement, and in order to contextualise this argument, I present an overview of various theories and technologies of measurement, while arguing for BDA as a technology of measurement with digital properties that influence the essential properties of measurement. I then focus on the mechanisms present in the measurement of the social, and I show how BDA shares these mechanisms, and what new aspects it introduces.
2.
Information Systems and Big Data Analytics
In this section, I outline the current understanding of big data characteristics and the processes of its production. After summarising the extant literature on this topic in other fields, I move on to outline contributions to the understanding of the nature of big data from the field of IS. It is an essential step to understand the nature of big data before discussing its analytics. I then discuss BDA specifically and tease out the perspectives on this phenomenon within the IS literature in order to summarise unanswered questions. Although various researchers point towards this issue, it still remains unknown how BDA shapes, transforms and modifies the organisations within which it becomes embedded.
2.1. Characteristics of big data
depending on the context. Data are thus not recorded facts, but rather that which is “remaining after the tide of being recedes” (Galloway, 2011, p. 87). As argued, it may be that data have “no relation to truth or reality beyond the reality that data helps us to construct” (Kallinikos, 1995; Rosenberg, 2013, p. 37).
Much has been written about the particular characteristics of big data that make it stand out in comparison to other forms of data. Doug Laney started with volume, velocity and variety, the so-called three Vs of big data (2001), as the defining characteristics that set big data apart from previous forms of calculative representations of the world. His framework served as a starting point for researchers to build on and add other characteristics they believe make up the phenomenon. Mayer-Schönberger and Cukier claimed that an important characteristic of big data is its exhaustivity, i.e. its ability to capture the entire system rather than relying on samples (2013). This theory has since been undermined (Kitchin and Lauriault, 2015). Dodge and Kitchin discuss the fine-grained nature of big data in terms of its resolution and how it allows for unique indexing (2005). Relationality (boyd and Crawford, 2012) – that is the possibility to cross-reference different datasets through common fields – and extensionality (the ease of adding or changing fields) with scalability (Marz and Warren, 2012) have also been identified as important features of this phenomenon. In fact, it has been pointed out that individual data points produced by users at any given time are almost meaningless (Wilson, 2015) and valueless (Stalder, 2012) until they are linked to other points of data, until they are aggregated (Thatcher, O’Sullivan and Mahmoudi, 2016). While veracity is also mentioned as one of its features, big data can be messy, noisy and uncertain, and contain errors (Marr, 2014). Big data is a type of data whose meaning can be constantly shifting in relation to the context in which it was generated, so it is important to highlight its variability as well (McNulty, 2014). Furthermore, it often does not include any information about the social context in which it was produced (Griswold and Wright, 2004), sometimes referred to as its “lossiness” (Busch, 2014).
In terms of its format, big data can be real-time, near real-time, batch, structured, semi-structured or unsemi-structured (Murthy, Bharadwaj and Subrahmanyam, 2014). It can be both quantitative or qualitative, indexical, specifying attributes or meta-data (Kitchin, 2014b).
Karlberg and Reis, 2014; Kitchin and Lauriault, 2015). The authors claim that the boundary characteristics of big data are velocity and exhaustivity (Kitchin and McArdle, 2016).
Others point out one of the characteristics of big data as a by-product of everyday life practices (Cohen, 2013; Bhimani and Willcocks, 2014; Couldry and Powell, 2014). A number of researchers claim that one of the salient features of big data is that it relies on data that was not initially intended to be used for certain purposes (Puschmann and Burgess, 2014), thus creating “data shadows” (Graham, 2014, p. 6), layers of information about objects, “data fumes” (Thatcher, 2014, p. 1765), or “data footprints” (Lewis, 2015, p. 1). Such “fumes” may come from directed data (censuses, CCTV), automated data (smart meters, loyalty cards), or volunteered data (Wikipedia, OpenStreetMap), as claimed by Cockayne (2016). However, other researchers see data exhaust, i.e. ambient data passively collected for a different purpose that can be recombined with other data to create new sources of value (George, Haas and Pentland, 2014), as just one source of big data – with public data, private data, community data and self-quantification data named as other sources.
Big data has also been studied in terms of the promises it offers and the myths around it (boyd and Crawford, 2012). Big data promises to extend the reach of automation, reduce the need for theory (Kitchin, 2014a), models, and human expertise, expand the realm of what can be measured, and calculate future events and behaviours (Rieder and Simon, 2016). Big data thus can speak for itself “free of human bias or framing”, and “any patterns and relationships within Big Data are inherently meaningful and truthful” (Kitchin, 2014a, p. 4). Big data is often seen as offering “a higher form of intelligence and knowledge that can generate insights that were previously impossible, with the aura of truth, objectivity, and accuracy” (boyd and Crawford, 2012, p. 663).
Such promises are regularly debunked in more critical literature on big data. Big data is not exhaustive and does not capture a whole domain, but instead is a representation and a sample “shaped by the technology and platform used, the data ontology employed and the regulatory environment, and it is subject to sampling bias” (Kitchin, 2014a, p. 4). It has been argued that big data often involves convenience samples: “people who bought a certain product, families that are a part of a given government program, (…) books that Google has scanned” and similar (Busch, 2014, p. 1728). As Kitchin proposes, data are always a selection from the total sum of all data available (Kitchin, 2014b).
human bias and framing (Kitchin, 2014a). Thus, there have been calls to study “data assemblages”, that is, “the technological, political, social and economic apparatuses and elements that constitute and frame the generation, circulation and deployment of data” (Kitchin and Lauriault, 2014, p. nd).
While this literature is rich, it does not cover all the characteristics of big data in a comprehensive and unquestioned manner. Many of the claims, such as those concerning the velocity or variety of big data, are not specific enough and seem rather subjective. Other characteristics seem to focus on distinguishing the types and varieties of big data (structured, unstructured, and so on), rather than on uncovering its ontological nature. This is where the extant literature on the characteristics of big data from the field of IS can help clarify and contribute to the understanding of its status.
Essentially, big data is created as an effect of “user participation along narrow and standardised activity types” (Alaimo and Kallinikos, 2017, p. 175) that leave data footprints, and therefore it is a by-product, an exhaust (Alaimo and Kallinikos, 2017). It is imbued with the assumption that anything in this exhaust is worth encoding and storing (Alaimo and Kallinikos, 2017). This points to the conclusion that “we have shifted from the problem of what to save to the problem of what to erase” (Floridi, 2012).
It is also important to point out the difference between “sorting on the way in” in previous data contexts, i.e. where “data is gathered through a carefully laid out cognitive architecture” (Constantiou and Kallinikos, 2015), and “sorting on the way out”, where data “is captured and stored without such a plan and on the assumption that it may be variously used a posteriori” (Constantiou and Kallinikos, 2015), as proposed by Weinberger (2007). The outcome, as pointed out by Leonelli, may be “the serendipitous result of social, political, economic and technical factors, which determines which data get to travel in ways that are non-transparent and hard to reconstruct” at the receiving end (Leonelli, 2014).
Importantly, such data “escape the systematic nature of professional classifications” (Constantiou and Kallinikos, 2015). As argued, “data generation is lifted out of the prevailing expert-dominated cultures by which the information needs of practice fields have been defined” (Kallinikos and Constantiou, 2015, p. 71), and instead large populations of users or technically-minded database administrators carry out the process.
(Kallinikos and Tempini, 2011). The decomposition of behavioural patterns into such granular traces involves a loss of meaning; however, this loss is then compensated by increasing opportunities to aggregate data and subject it to analysis (Kallinikos, Hasselbladh and Marton, 2013).
Data is also “use-agnostic” (Kallinikos, 2013), i.e. its intended uses, which inform the process of data production, may differ from their actual uses in the future: data is not tightly coupled with the uses it may be put to (Kallinikos and Tempini, 2011). Big data exists with “an open-ended potential”, rendering it unbound when it comes to potential explorations and analyses (Kallinikos and Tempini, 2011).
Further, big data is real-time: users’ behaviours are constantly logged into databases which then require algorithms to deal with such dynamic datasets (Constantiou and Kallinikos, 2015). This constant renewal and updating puts emphasis on real-time events, challenges the longer-term horizon and “privileges the present at the expense of past and future” (Constantiou and Kallinikos, 2015). Data logged in real time (Murthy, Bharadwaj and Subrahmanyam, 2014) leads to “nowcasting” (Constantiou and Kallinikos, 2015). Big data enable the regime of futurity, an obsession with the future and its prediction (Ekbia et al., 2014).
Thus, to summarise the characteristics discussed above, the current literature attempts to define and differentiate big data on the grounds of its volume, variety, velocity, exhaustivity, granularity, veracity and use-agnosticity (with other characteristics described above captured through these main seven). One of the most pertinent contributions of IS scholars to the understanding of the big data phenomenon is their focus on the practices of data production. Zooming in on how big data comes to be offers an enhanced view on its characteristics.
2.2. Processes of big data production
2.2.1. Encoding
Alaimo and Kallinikos argue that encoding relies on the formalisation of users, posts, comments, etc. as objects, and on connections between such objects along the lines of pre-established actions, such as following, clicking or sharing (Alaimo and Kallinikos, 2016). This process entails “the programmed disaggregation of individual users in countable actions” (Alaimo and Kallinikos, 2016, p. 83), which in turn allows for easy identification, counting and comparison.
Objectification then allows for the detachment from contexts in which social interactions are normally embedded (Kallinikos, 2009). This leads to the conclusion that data do not just record or measure social activities, but encode them under their own assumptions, following the logic embedded in the database or platform (Ruppert, 2012; Alaimo and Kallinikos, 2016). All attempts at encoding involve an analytical approach, which is inherently related to the existence of a model, a reference domain that allows for the assignment of thus constructed codes to that which is being codified (Kallinikos, 2009). This process is essentially “the comprehensive mapping of reality through the technological generation of huge amounts of data” (Kallinikos and Tempini, 2011, p. 6), which is followed by data reduction and interpretation.
2.2.2. Aggregation
Due to the characteristics of data pointed out in the previous section – it is not possible for data not to compromise variety, richness or complexity, thus leading to “abstraction from the messiness of life and contextual detail” (Constantiou and Kallinikos, 2015). “The ghost of abstract or generic descriptions that may carry dubious social relevance” (Constantiou and Kallinikos, 2015) is perceived as a pivotal issue that calls for critical scrutiny. Decontextualisation is, in fact, an essential practice in databases to make data portable, allowing for their integration with other databases. Further, data are subject to recontextualisation and reuse (Leonelli, 2014).
2.2.3. Correlation
The process of correlation rests on the principle that data can be combined and recombined within databases (Galliers et al., 2017), and thus the patterns of relationships or similarities can be uncovered. Small, dividual pieces of data are made intelligible by correlating them with other dividual pieces (Cheney-Lippold, 2011). More recently, Hacking added correlating to the list of “engines of making up people” (Hacking, 2006), and it should be further emphasised that big data relies on de-contextualisation in the way it correlates, that is, data are taken out of original contexts and propagated in other contexts (Galliers et al., 2017).
As a result of objectification, it is possible to connect objects and correlate them, while every such link acts as a reductive filter of the complex social reality and channels activities along set paths (Alaimo and Kallinikos, 2016). Correlated data can be then used to provide measurements and classification of behavioural patterns. Correlation often results in the creation of user profiles, which can then be continually updated and changed (Cheney-Lippold, 2011). What is more, as more data about a specific user are received, new computations can be carried out which in turn may change “who the user is believed to be”. This leads to a constant feedback loop which becomes a form of control (Cheney-Lippold, 2011).
Correlation results in data being further incorporated into other calculations and becoming parts of other data infrastructures due to the recombinant nature of databases. This correlative nature of data can provide “powerful knowledge that was not available before” (Leonelli, 2014) through the identification of statistical relationships between data values and the shift to patterns (sometimes leading to apophenia, i.e. the perception of patterns where none actually exist) (boyd and Crawford, 2012) simply because “everything counts in large amounts” (Aaltonen and Tempini, 2014). In order to enable correlation, a potent technological infrastructure involving statistical tools and programming in the creation of data as well as computational techniques is required (Ekbia et al., 2014).
2.2.4. Contributions from adjacent fields
O’Sullivan and Mahmoudi, 2016, p. 5) and package data into aggregates ready to be purchased and sold. Couldry and Powell state that “many everyday activities now produce data without requiring human meaning-construction” (2014, p. 3) and that individual data points are not meaningful in themselves; however, “taken together, either through aggregation, correlation or calculation, such data provide large amounts of information” (2014, p. 3).
Some researchers highlight the reductive character of data production, pointing to “the need to reduce the dimensionality of complex objects” (Patty and Penn, 2015, p. 1) for the purposes of big data, and that “any process of data reduction necessarily involves choices about measurement” (Patty and Penn, 2015, p. 2). It has been pointed out that “the statistical relationships emerge from the data, but the stable, measurable concepts do not: the concepts are a prerequisite for the existence of the data” (Shaw, 2015, p. 2).
There is an increasing understanding that data is “given by computational storage” (Puschmann and Burgess, 2014, p. 1693), and Bowker notes that in big data “the interpretative work is done inside the computer and read out and acted on by humans” (2013, p. 170). The production of big data involves work, and big data carries out work itself as well. Big data involves “a great deal of social work” that “takes place off-stage, by non-human agents, as a result of processing choices engineered by computers” (Gregg, 2015, p. 44). Big data depends on decisions which are often embedded in previously collected data or tools used to collect it, for example in relation to “the recording, indexing and representation of data and the settings for analysis methods” (Diesner, 2015, p. 1). This brings up the point of standards, and it is claimed that big data “require herculean efforts of standardisation – in data collection, analysis, and interpretation” (Busch, 2014, p. 1736).
All of these contributions point to the fact that the production of big data is imbued with highly subjective and complex decisions and processes which already start at encoding, aggregation and correlation, before data is subjected to more complex analytical work.
2.3. Big data and its analytics
Watson, Goodhue and Wixom, 2002), and previously some scholars discussed the processes of extracting knowledge from data using data mining (Fayyad, Piatetsky-Shapiro and Smyth, 1996). Meanwhile, Simoudis (1996) looked at the theory and limits of data mining. Some go as far back as linking the current trends in BDA literature to Decision Support Systems and Executive Support Systems (Huber, 1990; Leidner and Elam, 1995).
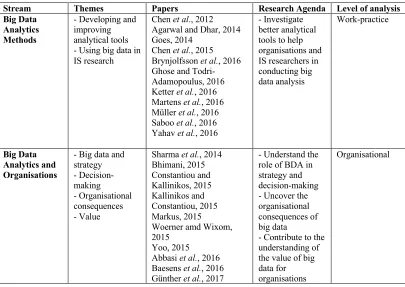
[image:25.595.116.521.478.765.2]In order to systematise and synthesise the extant IS scholarship on BDA, I conducted a thorough search of the top eight IS publications from the Senior Scholars’ Basket of Journals, as defined by the Association for Information Systems (European Journal of Information Systems, Information Systems Journal, Information Systems Research, Journal of the Association for Information Systems, Journal of Information Technology, Journal of Management Information Systems, Journal of Strategic Information Systems, MIS Quarterly) to identify articles which related directly to BDA, either by referring to this phenomenon in their abstract or in their keywords. This search resulted in 30 articles which directly pertain to this phenomenon. I identified three main streams that current research gravitates towards, with a number of themes in each: Big Data Analytics Methods, Big Data Analytics and Organisations, and Critical Big Data Analytics. I have drawn up an overview of the streams, themes, papers and main research agendas in Table 1, together with the level of analysis which I return to later in this section.
Table 1 Main streams of Information Systems literature on Big Data Analytics
Stream Themes Papers Research Agenda Level of analysis Big Data
Analytics Methods
- Developing and improving analytical tools - Using big data in IS research
Chen et al., 2012 Agarwal and Dhar, 2014 Goes, 2014
Chen et al., 2015 Brynjolfsson et al., 2016 Ghose and Todri-Adamopoulus, 2016 Ketter et al., 2016 Martens et al., 2016 Müller et al., 2016 Saboo et al., 2016 Yahav et al., 2016
- Investigate better analytical tools to help organisations and IS researchers in conducting big data analysis Work-practice Big Data Analytics and Organisations
- Big data and strategy - Decision-making - Organisational consequences - Value
Sharma et al., 2014 Bhimani, 2015 Constantiou and Kallinikos, 2015 Kallinikos and Constantiou, 2015 Markus, 2015 Woerner amd Wixom, 2015
Yoo, 2015 Abbasi et al., 2016 Baesens et al., 2016 Günther et al., 2017
- Understand the role of BDA in strategy and decision-making - Uncover the organisational consequences of big data
- Contribute to the understanding of the value of big data for organisations
Lyytinen and Grover, 2017
Critical Big
Data Analytics - Datafication and its societal effects - Privacy and security - Data quality - Transformative nature of big data
Lycett, 2013 Loebbecke and Picot, 2015
Newell and Marabelli, 2015
Clarke, 2016
Menon and Sarkar, 2016 Galliers et al., 2017 Markus, 2017
- Understand the effects of BDA - Analyse how BDA transforms behaviours
Supra-organisational
First, there are a number of publications on BDA which focus solely on developing increasingly more sophisticated analytical methods to deal with big data. This is evident in publications from the MIS Quarterly special issue on Big Data & Analytics in Networked Business. For example, Brynjolfsson et al. (2016) develop a robust process for predicting behaviours using online crowd-based data, and they evaluate the effectiveness of their model. Similarly, Yahav et al. (2016) introduce a tree-based approach to adjust for self-selection in BDA. Some publications also investigate the use of BDA in IS research (Müller et al., 2016). Most of the literature in this stream calls for more interest in developing increasingly precise and efficient methods to deal with BDA and promotes its usefulness in management and for decision-making. However, we can see that this stream of literature generally does not question the assumptions regarding how analytics can support businesses and organisational operations, assuming a fairly unidirectional relationship of causality between the world and data.
Within the same stream, there has been a growing interest within the IS literature in the value of big data and its analytics. For example, a thorough literature review by Günther et al. (2017) provides a useful overview of what types of value can be associated with BDA and identifies six main debates that highlight how organisations extract value from it, breaking them down into work-practice, organizational, and supra-organizational levels. The authors indicate that “future research needs to empirically examine how different actors within organizations work with big data in practice, how organizational models are developed, and how organizations deal with different stakeholder interests to realize value from big data” (2017, p. 200). Baesens et al. argue for the addition of the fifth V “namely value, to complement the 4V framework from a business perspective” (2016, p. 807) in order to put this aspect of BDA at the forefront of research. It is clear that this stream of literature invites research into the consequences of BDA in organisational decision-making to develop a better understanding of the value of BDA in this context.
Third, I have identified a growing body of literature focusing on a more critical outlook on BDA. In this stream, the theme of ‘datafication’ has received considerable attention, pointing to the fact that this term “is increasingly being used to characterise the reliance of enterprises on data (and their data infrastructures)” (Lycett, 2013, p. 382). While big data is attributed the possibility to empower actions which can potentially provide value, “it should be clear that datafication will unavoidably omit many features of the world, distort others and potentially add features that are not apparent in the first instance” (Lycett, 2013, p. 384). There have been calls within this stream for further research into the societal effects of ‘datafication’, since the implications of BDA “for individuals and the wider society are less clear” (Newell and Marabelli, 2015, p. 3). Apart from the issues of privacy and security (Menon and Sarkar, 2016), or data quality (Clarke, 2016), much of the literature in this stream points towards the transformative nature of BDA within organisations, as performance measurement and rankings become the infrastructure transforming organisational behaviour (Markus, 2017). In her article, Markus speaks directly to the concern I am preoccupied with, and also makes a clear link to the theory of reactivity which I employ to lay bare the mechanisms by which BDA indeed inform and transform organisational behaviours. Within this stream of literature, there are many voices calling for a more thorough analysis of the transformative nature of BDA.
summarise key debates, focusing on the inductive and deductive approaches to BDA, and algorithmic and human-based intelligence. Unsurprisingly, similar debates permeate the BDA literature which aims to investigate better analytical tools to help organisations and IS researchers in conducting analytics. Often rooted in computer science, econometrics, and data science, these studies refine statistical models and develop predictive powers of business analytics to support decision-making in organisations.
At the organisational level, the key debates identified by Günther et al. (2017) focus on centralised and decentralised big data capability structures, and big data-driven business model improvement and innovation. The articles identified at this level are largely similar, as they aim to understand the role of BDA in strategy and decision-making, uncover the organisational consequences of big data, or contribute to the understanding of the value of big data for organisations.
Third, the supra-organisational level of Günther et al. (2017) focuses on controlled and open access to big data, as well as minimising and neglecting the social risks of big data value realisation, and corresponds to the Critical Big Data Analytics stream I summarised above.
This view that big data influences what it measures is pronounced even more strongly in wider IS literature. Boyd and Crawford quote Du Gay and Pryke, saying that “accounting tools (…) do not simply aid the measurement of economic activity, they shape the reality they measure” (2002, pp. 12–13), and that “big data stakes out new terrains of objects, methods of knowing, and definitions of social life” (2012, p. 665). Lewis notes that the digital contexts in which behaviours take place are recorded and “carry norms that powerfully shape human behavior” (2015, p. 3). This leads, for example, to gaming, i.e. “strategic and selective collection and use of data in pursuit of individual goals”, or amplified performativity: “data used to amplify impact of measures on what is being measured” (Galliers et al., 2017, p. 188). In the context of big data, it has been noted that “strategic performance measurement and ranking systems take on new significance as infrastructure intended, not just to inform, but also to transform, individual and organizational behavior” (Galliers et al., 2017; Markus, 2017). Big data “does not simply help us describe ‘what is out there’ in social identity and social interactions; it deeply shapes them” (Yoo, 2015, p. 63), and thus it actively shapes the world (Yoo, 2015). Following Constantiou and Kallinikos, Yoo states that this is precisely what makes data “such a powerful wold-shaping strategic tool” (2015, p. 63).
Thus, this research project concerns BDA and organisations, and answers the question of how organisations – and work – change as a result of the implementation of BDA.
2.4. Conclusions
3.
Measurement and data
I begin this section by developing the argument that current BDA practices are a continuation of the phenomenon of technologies of measurement and thus can be seen as tools of measurement. I present an overview of critical literature on measurement, summarising the various mechanisms of measurement, including representation (3.2.1), commensuration and quantification (3.2.2), numbers (3.2.3), calculation (3.2.4), standardisation (3.2.5), classification, categorisation and aggregation (3.2.6), indices and indicators (3.2.7), rankings (3.2.8), statistics (3.2.9) and computation (3.2.10). These mechanisms are discussed in the approximate order of their increasing complexity, and they can be seen as enabling one another in more or less this sequence. The main position represented by this rich literature is that of the non-neutral nature of measurement and its impact on objects, people and societies. I finish this section by teasing out the problems and questions that such a framing of BDA opens up.
3.1. Big data analytics as measurement
My main argument in this section is that BDA should be seen as a continuation of the line of technologies of measurement, as defined in the next chapter. To support this argument, I review the extant literature supporting this perspective. Numerous scholars propose this view, and I summarise their points below.
Big data analytics is embedded in “a long-standing culture of measurement and quantification” (Rieder and Simon, 2016, p. 2) which can be traced back to the development of statistics and earlier. Big data is historical (Barnes and Wilson, 2014), has a long history (Beer, 2016), and should be contextualised within “the history of social statistics” (Beer, 2016, p. 1). While the type of data and its analytics may be different “the lineage is clear” (Beer, 2016, p. 2). Big data represents “the latest iteration of the desire to find efficiency and meaning in quantitative analysis” (Thatcher, 2014, p. 1768). This led to some arguing that “things are not as different as they might seem” (Barnes, 2013, p. 298), and others trace the push for more data all the way back to scientific management (Andrejevic, 2014). Censuses have also been presented as previous forms of collecting and analysing big data (Nafus and Sherman, 2014). As researchers point out, “we’ve been here before” (Barnes and Wilson, 2014, p. 10). Similar views are echoed in the IS literature (Agarwal and Dhar, 2014; Clarke, 2016; Markus, 2017).
above. Similarly to arguments in the various theories of measurement, big data also “promises to expand the realm of what can be measured” (Rieder and Simon, 2016, p. 4).
It is tempting to see BDA as just a continuation of the history of measurement, and indeed there are strong, significant similarities between how previous forms of measurement operate and how the new BDA measures and remakes the world. These similarities are strong enough to warrant a reading of BDA as a technology of measurement and to apply theories drawn from the sociological analysis of measurement to this new context. I am convinced that this is a fruitful perspective which can enable a new understanding of what BDA is and how it works. However, it would be unjust and potentially misleading to see BDA as just more of the same. I return to this point in the conclusions in this section. Before that, I frame the measurement of the social as a highly contingent process, and I unpack the various mechanisms that it relies on.
3.2. Measuring the social in social sciences
Measurement was born out of the need of the physical sciences to provide evidence for theories and experiments, as discussed in the previous section. In the so-called “hard” sciences, measurement is seen as a determination of a quantity of inorganic or organic matter without any impact on the objects measured (Micheli and Mari, 2014). Within this view, objects can be assessed objectively, and environmental influences can be controlled for (Tsoukas, 1989). While some tenets of scientific measurement were reflected in the overview of mathematical theories of measurement and the realist approaches above, they serve only as a background to the main issue for this project, namely measurement in social sciences.
In their study of the epistemological foundations of performance measurement and management (PMM), Micheli and Mari point out that PMM relies on the concept of measurement as drawn from scientific experiments and the assumption of measurability of performance, while it remains a social practice. Micheli and Mari point out that extant research often assumes “that all the key properties of measurement, (e.g. objectivity, accuracy, and precision) are unproblematic and can be taken for granted” (2014, p. 148), while most of PMM concerns “social objects (…) which are often complex and difficult to define and measure in their properties” (2014, p. 152), such as stakeholder satisfaction or brand management. Numerous management studies assume that variables outside of interest can be controlled for, that metrics measure actions completely, that there are no disagreements among agents about the contexts and situations, and that agents have an ability to reflect (Numagami, 1998). The authors argue that unlike in natural sciences, organisational PMM is not a straightforward process of determining the value of a metric, but rather of its assignment (Mari, 2007). Thus, “measurement results must be assigned (and not determined) according to the goals for which the measurement is performed, with the consequence that they are adequate if they meet such goals” (Mari, 2007, p. 76). Within this paradigm, measurement results are of an informational and not empirical nature, a measurement result is not an intrinsic characteristic of a property, and measurability depends on the current state of knowledge of the property and the availability of experimental conditions (Micheli and Mari, 2014).
Thus, I adopt the view of measurement of the social as a “form of insight, rather than the (actual or potential) ‘true knowledge’” (Micheli and Mari, 2014, p. 149). Below, I outline various mechanisms by which this “insight” into the social can be obtained.
3.2.1. Representation
Following the information-theoretic approaches to measurement presented in the previous section, it is fruitful to draw from IS literature on the representative nature of information in order to better expose the nature of the relationship between measurement and the objects measured. As discussed in the previous section, measurement is seen as information, and thus a further analysis in this direction can provide additional insights into this phenomenon.
the things and states which it renders visible and calculable” (1995, p. 119), and by reconstructing the world through information, it does so “from the horizon of human intention” (1995, p. 119). Following Heidegger, Kallinikos states that “representation always proceeds by (re)constructing the world from particular standpoints” (1995, p. 121). By extension, we can conclude that “massive mediation of reality and sociality by expansive grids of data and information tokens” (Kallinikos and Tempini, 2011, p. 2) takes place (compare with: “a number, like a photograph, seems a piece of reality, rather than an interpretation of it”, Sontag, 1977, p. 4).
It is worth noting that information is essentially productive, that is, it contains “novel descriptions” of the objects it describes, extending their existence. In this sense, information “partakes in the construction of reality” (Kallinikos, 2006, p. 103). This, in turn, leads to the “self-propelling” nature of information where “producing information out of information” takes place (Kallinikos, 1995, p. 106), thus deepening the selectively representational mechanism of information. Information is also perishable and disposable, which paradoxically “makes information useful and useless at the same time” (Kallinikos, 1995, p. 108).
Seen from this perspective, measurement as information provides a selective, deductive, abstractive, subjective, reductive representation of objects it measures. This important contribution from IS literature provides a link between seeing measurement as information, but also serves as an important starting point to understand the mechanisms involved in the representation of the world through measurement, it being a type of information.
3.2.2. Commensuration and quantification
Measurement entails not only representation but also translation of qualities into quantities – commensuration. In other words, it involves “the transformation of different qualities into a common metric” (Espeland and Stevens, 1998, p. 314). Commensuration is a mechanism that “encompasses all human efforts to express value quantitatively” (Stevens and Espeland, 2004, p. 375).
comparability. On one hand, commensuration renders distinctive characteristics of objects less visible, but at the same time it brings into view certain parts and aspects of objects (Stevens and Espeland, 2004) and new forms of unity, and new, more precise distinctions are created (Espeland and Lom, 2015). This results in the generative character of commensuration: it allows for comparison, stratification, perception of differences and judgment; it permits “scrutiny of complex or disparate phenomena in ways that enable judgment” (Espeland and Stevens, 2008, p. 415). Following Latour (1993), it has been argued that commensuration, a by-product of measurement, creates relations that did not exist before, and once these relations emerge it is no longer possible to see the world in the same way as before.
The essential part of commensuration is the simplification of information. The processes of organising, integrating and eliminating information are inherent in commensuration (Espeland and Sauder, 2007). Vast amounts of information are rendered irrelevant, and instead, simplified, single measures rely on decontextualised information (Espeland and Stevens, 1998). It is thus easier to access and process information, and “simplification often makes information seem more authoritative” (Espeland and Stevens, 1998, p. 17). Researchers argue that simplification may obscure assumptions and arbitrariness, and limit uncertainty and contingency (March and Simon, 1958), and as a result information may be perceived as more robust (Espeland and Stevens, 1998, p. 17). Thus rendered information, deprived of its original context, is more portable, enables numbers to circulate and opens up possibilities for the recreation of their meaning, by “building them into new contexts”, and reinterpretation (Espeland and Stevens, 1998, p. 18).
As Espeland and Stevens state, “most quantification can be understood as commensuration because quantification creates relations between different entities through a common metric” (Espeland and Stevens, 1998, p. 316). Quantification is sometimes used in literature interchangeably with commensuration (see Espeland and Lom, 2015), but more often it corresponds to a broader trend towards an increased reliance on a numerical representation of objects, people, and the world, and is “fundamentally about creating units that can be counted and described numerically with the aim of putting them in some order” (Rottenburg et al., 2015, p. 7).
Espeland and Stevens point to the fact that quantification simplifies, excludes and integrates information, and by doing so it “expands the comprehensibility and comparability of social phenomena in ways that permit strict and dispersed surveillance” (Espeland and Stevens, 2008, p. 415), thus giving rise to monitoring or governing “at a distance” (Miller and Rose, 1990) and legitimising quantification as an “instrument of state power” (Shore and Wright, 2015b, p. 22). This “technology of distance”, as Porter states, “minimizes the need for intimate knowledge and personal trust” (1995, p. IX) because “mechanical objectivity serves as an alternative to personal trust” (1995, p. XX), introducing impersonality, suggesting objectivity, and abstracting individuality (1995, p. 32). This makes quantification a strategy of intervention rather than just description: “the quantitative technologies used to investigate social and economic life work best if the world they describe can be remade in their image” (1995, p. 43). Porter explains that quantification works by objectifying, creating a superficial transparency, and implementing hierarchies (1995).
Quantification is often embedded in larger social processes (Espeland and Stevens, 2008) and thus disappears from sight (Rottenburg et al., 2015), but it nonetheless requires considerable work. Who does this work matters, as authors suggest quantification may lead to reapportioning of power by engaging technical experts who gain a new-found influence (Merry, 2011).
Thus, measurement can be seen as a specific kind of information that transforms qualities into quantities, therefore enabling new relationships, comparisons or “machinations” through non-trivial amounts of work. By doing so, it enables judgment, ordering, governance and monitoring “at a distance”.
3.2.3. Numbers
enabling measurement to happen. Numbers participate in the process of ordering and in representing that order as value, therefore giving them a dual role: ordering and valuing, which is often conflated in the everyday and scientific uses of numbers (Adkins and Lury, 2012). This leads to the fact that “what counts – in the sense of what is valued – is that which is counted” (Badiou, 2008, p. 2). As the French philosopher of numbers Alain Badiou explains, numbers provide a norm for all (2008). In his approach, Badiou claims that objects and people are plural in nature, but once turned into a number, they are forced into singularity. Thus, “no-one can present themselves as an individual without stating in what way they count, for whom or for what they are really counted” (2008, p. 2). This idea speaks yet again to the fact that to turn something or someone into a number means to simplify or reduce complexity. Numbers as entities are “reductive, selectively compressing and framing life and ideas in patterned ways” (Espeland and Lom, 2015, p. 18).
This is why numbers are never innocent (Sayer, 1984): they do not stand for themselves, but are the result of a prior theorisation; they are essentially theory-laden, they speak for assumptions they embody, as they emerge from social institutions or organisations with their agendas and interests.
Yet numbers hold a privileged position in society and command certain authority, as it is often believed they are accurate or valid in their representations (Anderson and Fienberg, 1999; Desrosières, 2001). They help solve problems (Porter, 1995), and they have long been associated with rationality and objectivity (Daston, 1992). Especially in Porter (1995), the rise of numbers can be traced back to the cult of impersonality, the push towards reducing the human element, and valuing formalised pr