Using response time modelling to understand the sources of dual-task interference in a
dynamic environment.
Hector Palada1, Andrew Neal1, David Strayer2, Timothy Ballard1, & Andrew Heathcote3 1The University of Queensland, Australia
2The University of Utah 3University of Tasmania, Australia
Words: 10,443
Author Note
Hector Palada, Andrew Neal, Timothy Ballard, School of Psychology, The University of Queensland; David Strayer, The University of Utah; Andrew Heathcote, School of Medicine, University of Tasmania.
Hector Palada was supported by an Australian Government Research Training Program Scholarship. This research was funded by the Australian Government through the Australian Research Council (DP160101891). Timothy Ballard was supported by an ARC Discovery Early Career Researcher Award (DE180101340). We would like to thank Daniel White for his programming and technical support of the classification task and Laird McColl for assistance in data collection.
Correspondence concerning this article should be addressed to Hector Palada, School of Psychology, The University of Queensland, St Lucia, QLD 4072, Australia. E-mail: [email protected].
Abstract
This paper examines the causes of dual-task interference in a time pressured dynamic environment. Resource sharing theories are often used as a theoretical framework to understand dual-task interference. These frameworks propose that resources from a limited pool of information-processing capacity is reallocated towards the primary task as task load
increases, and as a result, secondary-task performance declines if the total demand exceeds capacity limit. However, tests of resource models have relied on behavioral results that could be due to a number of different cognitive processes, including changes in response caution, rate of information processing, non-decision processes and response biases. We applied evidence-accumulation models to quantify the cognitive processes underlying performance in a dual-task paradigm in order to examine the causes underlying dual-task interference. We fit performance in time-pressured environment on both a primary classification task and a secondary detection task using evidence-accumulation models. Under greater time pressure, the rate of information processing increased for the primary task while response caution decreased, whereas the rate of information processing for the secondary task declined with greater time pressure. Assuming the rate of evidence accumulation is proportional to
available capacity these results are consistent with resource theory and highlight the value of evidence-accumulation models for understanding the complex set of processes underlying dual-task interference.
Public Significance Statement
Measuring workload is critical for systems design to ensure that individuals are not overloaded and can perform tasks effectively and safely. Understanding how a measure is sensitive to workload is important for mitigating overload. We tested how the Detection Response Task, an international standard workload measure, is sensitive to workload in a
time pressured environment. We found that the DRT is sensitive to the reallocation of
It has long been known that humans have limited information-processing capacity (Kahneman, 1973). Overload occurs when people have insufficient capacity to meet task demands, such as time pressure. Consequences of overload include increases in response times and error rates, which in turn can increase the risk of accidents and injuries
(Parasuraman, Sheridan, & Wickens, 2008). It is for this reason that workload is a risk factor
that needs to be managed, particularly in safety-critical industries (Neal, Hannah, Sanderson, Bolland, Mooij, & Murphy, 2014). The measurement of workload is critical to ensure that performance and task demands remain within manageable bounds. The dual-task paradigm is frequently adopted to study workload, and resource theories are often cited as a theoretical framework to understand dual-task performance (Vidulich & Tsang, 2012). This framework proposes that dual-task interference reflects competition for a limited pool of information-processing capacity (i.e., “resources”), whereby resources are prioritized to the primary task as demands increase, resulting in performance decrements in the secondary task if the total available is exceeded (Kahneman, 1973).
Despite widespread interest in the resource framework, there is surprisingly little evidence to support the idea that dual-task interference reflects competition for resources. Previous studies using the dual-task paradigm are ambiguous, as they rely on response time or accuracy to infer resource competition (Navon, 1984). Yet it is difficult to draw inferences regarding dual-task interference from such behavioral data alone, because they can change due to a range of different cognitive processes. For example, performance decrements on the secondary task might be attributable to a decrease in the rate of information processing for that task, but also be due to changes in response caution, bias, or non-decision processes (Palada, Neal, Tay, & Heathcote, 2018).
using dual-task paradigms have applied evidence-accumulation models to quantify latent cognitive processes and understand dual-task performance (Tillman, Strayer, Eidels, & Heathcote, 2017; Castro, Strayer, Matzke, & Heathcote, in press). However, these studies only modeled the secondary task, and as a result, were unable to directly examine the processes underlying dual-task interference.
The aim of the paper is to use evidence-accumulation models to understand the patterns of dual-task interference that occur under time pressure in a complex and dynamic
environment. We use a primary task involving discrete choices that is suitable for this type of analysis, in the form of a simulated maritime surveillance task performed under varying levels of time pressure. The reason for choosing maritime surveillance is because it is representative of a broad range of tasks in which people experience dual-task interference in a dynamic environment. Examples include air traffic control, train control, unmanned vehicle control, air battle management, and submarine track management. One group of participants performed the surveillance task alone, whereas a second group concurrently performed a simple stimulus-detection task, which also required a discrete response. We fit the Wald evidence-accumulation model (Heathcote, 2004) to both primary task and secondary-task performance and examined how the parameters of the model responded to time pressure manipulations in order to understand how people respond to changes in time pressure. We tested for individual differences to examine whether participants responded in different ways to time pressure.
The Detection Response Task (DRT)
The DRT is a standardized secondary-task measure of workload that has been designed to infer workload (International Organization for Standardization [ISO], 2015). The DRT
responses on the DRT are indicative of greater workload. The DRT has been widely used to measure the effects of increased task load during driving, because it is sensitive to transient fluctuations in workload, and has minimal impact on primary task performance, meaning that it is unlikely to pose a safety risk (Strayer, et al., 2014). For these reasons, the DRT has the potential to be widely used as a measure of workload in both laboratory and field settings
(Bruyas, Dumont, & Bron, 2013).
The increase in DRT response times and misses is thought to be because the DRT competes with the primary task for a finite pool of resources, which means that the rate of information processing for the DRT decreases as resources are diverted away from the DRT to maintain performance on the primary task (Strayer, Watson, & Drews, 2011). However, evidence to support this assumption is inconsistent. Using evidence-accumulation models, including the linear ballistic accumulator (LBA; Brown & Heathcote, 2008) and the single-bound diffusion or Wald model (Heathcote, 2004), Tillman et al. (2017) found that people were slower to respond to the DRT when having to hold a conversation while driving. However, this effect was due to increased response caution, rather than a decrease in the rate of information processing. In contrast, Castro et al. (in press) found that slowed DRT
response times due to more consistent cognitive demands (counting backwards by threes vs. not while in both cases preforming a primary tracking task) was due to a decrease in the both the rate of information processing and an increase in response caution, as well as a small decrease in non-decision time (i.e., the sum of stimulus encoding and response production times).
Unfortunately, because existing studies used a continuous primary task (driving and tracking, respectively), it has not been possible to also critically examine the cognitive
task in order to protect performance, such as adjusting effort, response caution and biases, and task priorities (Neal, Ballard, & Vancouver, 2017; Palada et al., 2018). Such adjustments might also influence DRT performance, and thus the inferences made about workload. For example, in response to greater time pressure, people might lower their response caution to speed the primary task, and therefore still have sufficient resources to protect DRT
performance. In this scenario, modelling of the DRT alone would lead to the erroneous conclusion that the individual was not under higher workload. For this reason, it is desirable to have a cognitive model of both the primary task and the DRT in order to understand how people respond to changes in task demands, such as time pressure, and to identify what it is that the DRT is measuring.
Resource Accounts of Workload and Performance
Resource-based theories of workload provide an account of the relationship between task demands and performance. Resources are a theoretical construct that refers to units or
channels of information processing (Navon & Gopher, 1979). The rate at which information is processed in a given task is determined by the resources allocated to it. Performance can be maintained if the allocated resources can meet task demands (Norman & Bobrow, 1975). However, if task demands exceed capacity, performance will degrade unless adaptive
strategies are used in attempts to protect performance. For this reason, workload and primary-task performance can disassociate (Parasuraman et al., 2008), making it necessary to account for strategic responses when examining the effects of workload (Palada et al., 2018).
Dual-task paradigms are o ften used to infer whether individuals are working within or exceeding their limited information-processing capacity. In these paradigms, the primary task of interest is performed alongside a secondary task, with the former being designated as more
capacity that is not allocated to the primary task. The assumption is that as primary task demands increase, the resources allocated towards it are increased, diminishing the resources available to the secondary task. As a result, primary-task performance is protected, and secondary-task performance suffers. The performance decrease in secondary task is inferred to reflect a higher workload in the primary task.
One of problems with the dual-task paradigm is that it provides only an indirect test of the resource model, as the theoretical processes thought to be involved must be inferred from observable behaviors (Navon, 1984). However, there are a range of different processes that might explain a given set of behavioral results, beyond those specified by resource theory. For example, the person may change their strategy for the primary or secondary task, trading off accuracy for speed; they may encode the stimuli or execute motor responses more rapidly; or they may adjust their response bias (Palada et al., 2018). Adding a secondary task may change the way in which the primary task is processed (Vidulich & Tsang, 2012), and there may be individual differences in the types of strategies that people use. In combination, these factors make it difficult to draw inferences about the sources of dual-task interference from behavioral measures alone.
Modeling Task Performance
Evidence-accumulation models share the basic assumption that evidence is accumulated over time from the environment until a threshold is reached, triggering an overt response (Brown & Heathcote, 2008; Ratcliff, 1988). Such models account for the full distribution of correct and error response times and accuracy by providing a detailed account of the
cognitive processes underlying detection and choice tasks. The validity of
evidence-accumulation models in quantifying the effects of a variety of load-related manipulations on rates of evidence accumulation is well supported. For example, the linear ballistic
accumulator model’s rate estimates coincide with the established cognitive capacity estimates using Systems Factor Technology (Townsend & Nozawa, 1995) with stimuli that require processing multiple attributes (Eidels, Donkin, Brown, & Heathcote, 2010; Donkin, Little, & Houpt, 2014). Using evidence-accumulation models to account for stop-signal paradigms, Logan, Van Zandt, Verbruggen and Wagenmakers (2014) found that the rate estimates decreased with an increase in the number of choice alternatives. Diffusion model rate estimates have been shown to decline with an increase in working memory load (Sewell, Linburn, & Smith, 2016). Finally, Schmiedek, Oberauer, Wilhelm, Süß, and Wittmann (2007) found that the rate parameter in the EZ-diffusion model (Wagenmakers, Van Der Mass, & Gasman, 2007) correlated with individual differences in cognitive abilities which are theorized to reflect cognitive capacity, including reasoning, working memory and psychometric speed.
In this study, we use a classification task as the primary task, requiring participants to decide whether incoming ships are target or non-targets. We manipulate time pressure by varying the number of ships within a given trial and the time available to classify the ships
model, which can be applied to both types of tasks, simple RT tasks, such as the DRT, and two-alternative forced choice tasks, such as our classification task (Heathcote, 2004). Fitting the models to the primary and secondary tasks allows us to examine the changes in the processes underlying DRT performance caused by changes in time pressure factors on the primary classification task. As the DRT was a simple detection and response task, we fit a
single Wald accumulator model. As the classification task required a choice between two alternatives, we fit a model with a racing pair of Wald accumulators, one representing each choice.
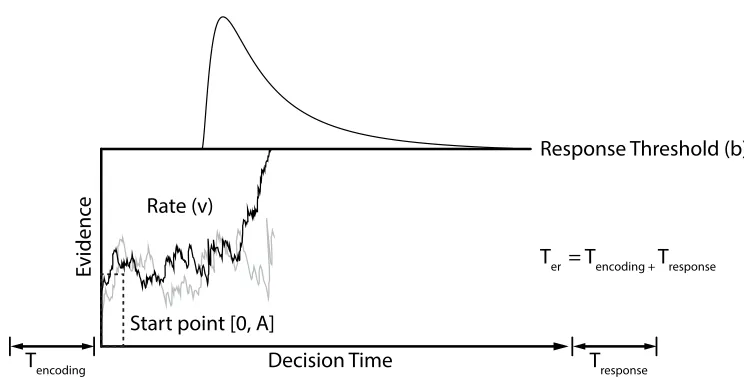
Wald Model Architecture. The Wald model assumes stochastic evidence accumulation (i.e., varying randomly within a trial) and that accumulation is linear on average. In choice tasks, the model assumes that the accumulators race independently towards the decision threshold, with the winning accumulator triggering the corresponding overt response. The choice Wald model is shown in Figure 1. Observed response times are partitioned into decision time and a constant non-decision time. The latter is quantified by a parameter (Ter) accounting for the sum of the times for to stimulus encoding and response production. Decision times are quantified by parameters accounting for the input and operation of the evidence accumulation process. A source of noise is introduced by having the start point for each accumulator follow a uniform distribution bound between zero and the parameter A. The response threshold (b) quantifies the amount of information that is required to make an overt response. The mean rate of evidence accumulation for each trial is quantified by the rate parameter (v). Decision time is determined by the time is takes for the winning evidence accumulator in the case of choice tasks, or the single accumulator in the case of simple RT tasks, to reach its response threshold.
Wald model can be elaborated to introduce between-trial variability in rates, though this added flexibility comes at a cost, as only two accumulation parameters are identifiable (i.e., response threshold, mean rate and rate variability; Ratcliff & Van Dongen, 2011). The
addition of start point variability in the Wald model is relatively new (Logan et al., 2014). For this reason, Castro et al. (in press), fit two variants of the model with and without start-point
variability, and found that start-point variability was necessary to account for premature sampling in the standard DRT, but was not necessary for a choice task. As we model both simple and choice tasks – the DRT and primary classification task, respectively – we also fit these two variants of the Wald model.
For the primary choice task, we use a "match" factor to represent the correspondence between the accumulator and the stimulus presented in the trial. The “matching” accumulator corresponds to the correct response option for the stimulus presented in a given trial, whereas the “mismatching” accumulator corresponds to the incorrect response option. When accuracy is above chance, the rate for the matching accumulator is greater than the rate for the
mismatching one. We allowed rate to vary by a “stimulus” factor (i.e., target stimuli vs. non-target stimuli) and we allowed threshold to vary by an “accumulator” factor (e.g., “non-target” vs. “non-target” accumulator), which allows for potential response biases – a subjective
preference towards a given response alternative mediated by the preferred response options requiring lesser evidence to trigger that response. Under greater time pressure, individuals may fail to begin the evidence accumulation process due to failures in attending to, or properly encoding, the stimulus (e.g., Palada et al., 2018).
stimulus being presented before responding to the current stimulus. At a minimum, the inter-stimulus interval in the DRT task is 3 seconds, whereas the slow tail of the DRT distribution approaches zero well before this time. Hence, it is reasonable to assume that non-responses occurred because of a failure to start accumulation, perhaps because of an attentional failure that causes the DRT stimulus not to be encoded, or a failure to attend to the goal of making
DRT responses that causes a failure of the encoded stimulus to produce an input to the accumulation process (see Matzke, Love & Heathcote, 2017a; Matzke, Hughes, Badcock, Michie & Heathcote, 2017b). The presentation of subsequent stimuli in our classification task is contingent on responding to the currently visible stimuli. Therefore, we also included the response omission parameter in modeling the classification task.
Time Pressure Effects on Cognitive Processes
The success of evidence-accumulation models lies in their ability to discriminate the effects of latent cognitive processes that are conflated in observed behaviors. The concept of “selective influence”, whereby an experimental effect is captured by a single model
parameter, has been important for testing the utility of such models. For example, Palada et al. (2016) tested the LBA (Brown & Heathcote, 2008) and diffusion (Ratcliff & McKoon, 2008) models in a complex choice task that produced relatively long response times, and found time pressure selectively influenced threshold, whereas difficulty selectively influenced rates.
Task demands have also been shown to have complex effects on several cognitive processes underlying task performance. Dambacher and Hübner (2015) found that threshold, rates, and non-decision times decreased with shorter decision deadlines. Tillman et al. (2017) found that the DRT’s decline in performance under load was explained by an increase in
response bias as workload increased, in order to provide a greater safety margin between aircraft.
Cognitive processes are also responsive to task demands that arise as a result of time pressure. For example, Palada et al. (2018) examined how individuals responded to time pressure using a maritime surveillance task. Time pressure was manipulated by varying task
the number of stimuli requiring classification and time available to classify those stimuli (deadline). They found a clear prioritization of speed over accuracy as time pressure increased, though this change in strategy was not sufficient to prevent an increase in non-responses under time pressure (i.e., a failure to respond to some stimuli before the deadline). The compromise in accuracy resulted in near chance performance for target stimuli. Model-based analyses using the LBA revealed that participants used a number of different strategies in an attempt to maintain performance under time pressure. First, participants reduced their response caution as the number of stimuli increased. Second, in response to tighter deadlines, participants reduced the time taken to encode stimuli. Finally, there was an increase in the overall rate of information processing, suggesting that more resources were allocated to the task in an attempt to compensate for the increase in time pressure. We employ the same paradigm to test the predictions of the resource model in the current study.
In summary, resource accounts of performance make two predictions about the effects of time pressure in a dual-task paradigm. First, time pressure will increase the allocation of resources to the primary task, producing an increase in rate for the primary task. Second, because people have limited capacity, increases in the allocation of resources to the primary task will be accompanied by decreases in the allocation of resources to the DRT. This is expected to produce a decrease in rate for the DRT. In contrast to the resource model, the
could decrease their response caution on the primary task and increase their response caution on the DRT, as well as speed their non-decision processes or change their response bias on the primary task. Such evidence against changes in rate would cast strong doubt on resource-based theories (e.g., Navon & Miller, 1987).
Method
Participants
Sixty-six undergraduate students from the University of Queensland participated in the study in return for course credit. The study was approved by the University of Queensland Human Research Ethics Committee. Initially, thirty participants were recruited to complete the UAV classification task (“single-task group”; mean age = 21.83; SD = 6.40; 18 female). Thereafter, 36 newly recruited participants completed both the UAV classification task and the DRT (“dual-task group”; mean age = 20.34; SD = 3.21; 13 female). The sample size for each group was informed by previous studies using similar paradigms (Palada et al., 2016; Palada et al., 2018).
Upon inspection of the data, three participants in the dual-task group had invalid or incomplete data and were therefore removed from analyses, leaving 33 participants. One participant failed to respond to any DRT stimuli. Due to technical issues, the remaining two participants had missing DRT data for an extended period of the experiment, such that an entire time pressure condition did not have DRT data.
Experimental Tasks & Designs
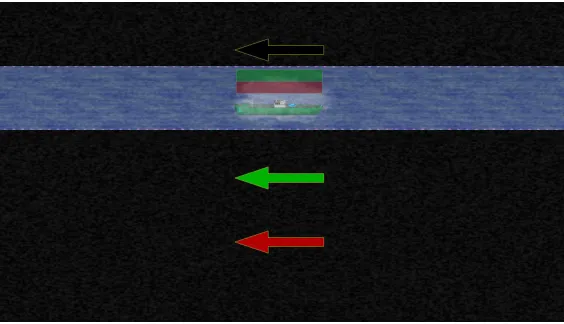
Classification task. The classification task required participants to categorize incoming ships as targets or non-targets (see Figure 2). In a trial, ships entered the screen from the right, and moved synchronously across the screen, exiting the left of the screen. At the
motor movements. To make the task challenging, ships were obscured by overlaying fog graphic, and the entire simulation was obscured by dynamic noise.
Serial classification was enforced using a masking procedure, such that at any given point in time only one ship was visible. The trial began with the bottom lane being unmasked. Once a participant classified the ship, its lane was masked, and the lane above it was
unmasked; this process continued until the ships exited the screen.
Participants classified ships by clicking on the corresponding colored response box positioned above the ship. The green and red response options reflected a target and non-target classification, respectively. When a response was made, the lane was masked and an arrow indicating the position of the ship was filled with the corresponding classification color. Unfilled arrows with a yellow border indicated the position of masked, unclassified ships.
Target and non-target ships were defined by their features. Ships could be equipped with up to five features, and each feature was located at a fixed position on the ship. Features included an anchor, crane, life boat, mast, and smokestack. A ship was a target if it was equipped with three or more features; otherwise, if the ship was equipped with two features or less, it was a non-target. Reclassifications were not permitted, and there was a 1s interval between trials.
The task included three within-person manipulations: Stimulus type (target vs. non-target), deadline (6s, 9s, and 12s) and the number of ships requiring classification per trial (2, 3, and 4 ships). Deadline refers to the time available to classify the number of ships presented within a given trial. Deadline was manipulated by varying the speed at which ships travelled across the screen (6s: 420 pixels/s, 9s: 280 pixels/s, and 12s: 210 pixels/s; screen resolution
presentation of blocks was randomized for each participant, and each block included 30 trials. A trial refers to the simultaneously presented of number of ships within the given deadline.
DRT. The tactile DRT required participants to respond to vibrotactile stimulation. The vibrotactile DRT was selected, to ensure that the primary and secondary tasks were presented via different modalities (visual vs. tactile). Doing so allows better examination of
primary-task workload effects of DRT, as opposed to any visual-perceptual and motor conflict (ISO, 2015). The DRT stimuli were randomly and uniformly presented every three to five seconds, thus producing temporal uncertainty. When the participants detected vibrotactile stimulation they were required to respond using a micro-second precision clicker attached to their non-dominant index finger. The vibrotactile motor was tapped on the participant’s preferred shoulder.
Measures
After every 10th trial, participants responded to three self-report items. Two items are from the NASA-TLX: temporal demands (“How hurried or rushed is the pace of the task?”) and mental workload (“How mentally demanding is the task?”). The third item assessed effort (“How hard are you trying”?). The items were anchored from 0 (“very low”) to 10 (“very high”).
Procedure
Participants viewed an audio-visual presentation explaining the task(s). For the
classification task, participants were instructed to “classify incoming ships as targets or non-targets”. Participants in the dual-task condition were instructed that the “UAV simulation is your main task” and to do “[their] best to pay attention to both tasks”. After viewing instructions, participants in the dual-task group then had the DRT fitted. To familiarize
training for the classification task included the nine time pressure conditions. The ordering of conditions was such that time pressure increased over the course of training, allowing
participants to ease into the task. Training began with the 12s deadline, with 2, 3, and then 4 ships; this sequence was then completed with the 9s and 6s deadlines. Feedback was provided throughout training; a green tick or red cross indicated a correct or incorrect response,
respectively. Once the participant stated that they understood their task, and any outstanding clarifications were made, they began the experimental trials. No feedback was provided for the classification task during the experimental phase. The entire session lasted an hour.
Results
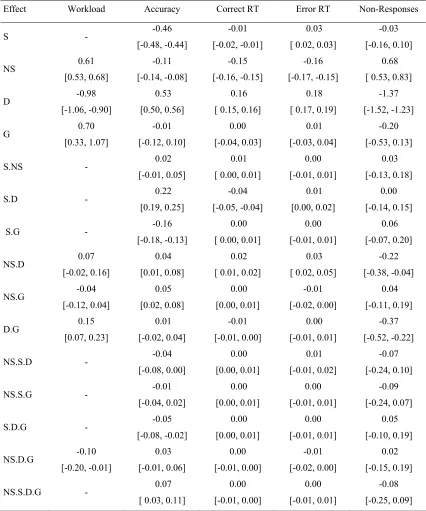
First, we examined the linear effects of group type (single-task vs. dual-task), time pressure (number of stimuli and deadline) and their interaction on perceived workload and classification performance (mean correct and error response times, accuracy, and non-response rates). For the dual-task group, the effects of time pressure on DRT performance was also examined (response times and hit-rate). Analyses were run using R (R Development Core Team, 2016) via the brms package, which compiles STAN code for Bayesian
generalized linear mixed-models(GLMM; Bürkner, 2017). Reliable linear effects were inferred where 95% credible intervals for regression coefficients did not include zero, and as such, we present the mean posterior estimates of regression coefficients (b) with two-tailed 95% credible intervals (CIs). Priors were consistent across models. Fixed effects and random intercepts had a Cauchy prior (location = 0, scale = 1.5), with the latter being zero-truncated. All other priors remained as their defaults specified in brms. Predictors were median
centered. The results are summarized in Table 2. Perceived Workload
trial.1 A GLMM assuming a Gaussian distribution was used, with group type (single-task vs. dual-task), number of ships and deadline entered as a fixed-effect. Perceived workload was greater for the dual-task group compared to the single-task group, and increased with tighter deadlines, and a greater number of ships. There was evidence for a three-way interaction between the experimental factors. The only discernible differences were that perceived
workload was higher for the dual-task group than the single-task group for the 3-ship, 9s deadline condition, and the 2-ship, 12s deadline condition.
Classification Task Performance
Responses were censored to remove response times longer than 6s. The fastest observed RT was 390ms, which is not implausibly fast, and so no censoring of fast responses was required. The data censored for each participant ranged from 0.00% to 2.10% for the dual-task group (M = 0.37%) and 0.00% to 1.11% for the single-task group (M = 0.28%). Dependent variables included correct and error response times, accuracy and non-response rates. For all analyses, stimulus type, number of ships, deadline and group type were entered as predictors with fixed effects. Given that raw RT distributions were positively skewed, a GLMM assuming a Lognormal distribution was used. As accuracy and non-responses are binary outcomes, GLMMs assuming a Bernoulli distribution via a logit link function were used.
There was a reliable four-way interaction between time pressure factors (number of ships and deadline), stimulus type and group type on accuracy. Accuracy declined with tighter deadlines, and this effect was stronger for targets than for non-targets for both single and
dual-task groups. For the single-task group, the interaction between deadline and stimulus type became slightly weaker as the number of stimuli increased; this effect for the single-task group replicates the results in Palada et al. (2018). In contrast, for the dual-task group, the interaction between deadline and stimulus type became slightly stronger as the number of stimuli increased.
For correct response times, there was a reliable interaction between deadline and stimulus type. Correct response times speeded with tighter deadlines, and this effect was stronger for non-targets than targets. When considered together with accuracy for non-target trials, it appears that participants took advantage of the extra time available in the 12s condition than the 9s condition yet improved very little in accuracy. In contrast, for target trials, participants took little advantage of the extra time available, only slightly increasing their response times in the 12s condition compared to the 9s condition, though this resulted in a much greater improvement in accuracy. These trends replicate those observed in Palada et al. (2018). A novel interaction was also observed involving deadline and number of ships; the speeding of RT with deadline slightly weakened with a greater number of ships.
Error response times mainly had similar trends to correct response times. However, the interaction between deadline and number of ships showed the opposite trend, such that the effect of deadlines became stronger with an increase in the number of ships. For both RT measures, group type did not have a reliable effect. For non-response rates, there was a reliable interaction between time pressure factors, such that non-response rates increased with tighter deadlines, and this effect became stronger as the number of ships increased. There was also a reliable interaction between deadline and group type. The interaction was driven by the differences in the 12s deadline, where the single-task group has a greater non-response rate.
the classification task, with minor differences in accuracy being driven by the slightly poorer target accuracy in the dual-task group. As performance was similar across the two groups, this indicates that the presence of the DRT had little effect on classification task performance. However, the addition of the DRT did result in greater perceived workload.
With regard to the effects of time pressure, the results indicate that participants’
performance generally suffered under time pressure. Participants prioritized speed and compromised their accuracy in response to greater time pressure, with the effects of deadline being stronger than number of ships. The speed-accuracy tradeoff resulted in greater
decrements for target accuracy than non-target accuracy. The prioritization of speed over accuracy was not sufficient to fully offset the greater time pressure, as non-responses increased considerably under greater time pressure.
DRT Performance
DRT trials were included if they were presented during times at which the participant could have been processing the classification task. In other words, DRT trials were considered for analysis if the onset of the DRT stimulus occurred after the start of a
classification trial and before all ships had been classified. If the final ship in the trial was not classified, then DRT trials were included if they were presented before the trial ended.
Prior to analyzing DRT performance, we examined participants’ responses strategies, as repetitive clicking without prompt would spuriously improve hit rates and potentially speed response times. As per the ISO standard (2015), we calculated participants’ clicking ratio by dividing the total number of clicks by the total number of stimuli. Click ratios we much smaller than 2:1, the threshold specified in the DRT manual, even in the worst case (M = 1.02, SD = 0.17; max = 1.42).
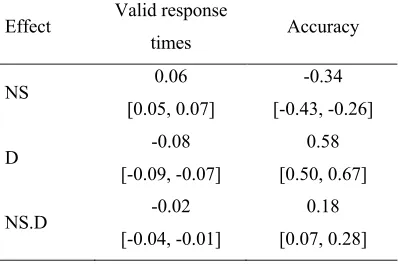
(“unrequested” responses). The range of premature responses censored was 0.00% to 1.60% (M = 0.52 %, SD = 0.51%), whereas the range for unrequested responses was 0.00% to 10.89% (M = 2.73 %, SD = 3.18%).2 Dependent variables included valid response times and hit rates (responses with response times between 100ms and 2.5s). Valid response times were analyzed with a GLMM assuming a Lognormal distribution, whereas hit rates were analyzed
GLMM assuming a Bernoulli distribution via logit link function. For both analyses, predictors included time pressure factors as fixed effects. The results are summarized in Table 3.
Deadline had a reliable negative effect on valid response times, whereas the number of ships had a reliable positive effect. That is, valid response times slowed with tighter deadlines and an increase in the number of ships. There was a reliable interaction between the time pressure factors on valid response times, driven by the virtually identical response times under the 6s deadline with 2 and 3 ships were present, whereas the other conditions showed clear additive effects. Hit rate declined with tighter deadlines and an increase in the number of ships. However, there was a reliable interaction between time pressure factors, which revealed that the negative effect of deadline on hit rates was considerably stronger for the 4-ship condition compared to the 2-4-ship and 3-4-ship conditions. Overall, the effects reveal that performance degraded with increased time pressure imposed on the primary task and suggests that the two tasks were competing for cognitive resources, with the classification task being given priority over the DRT.
Decision Processes
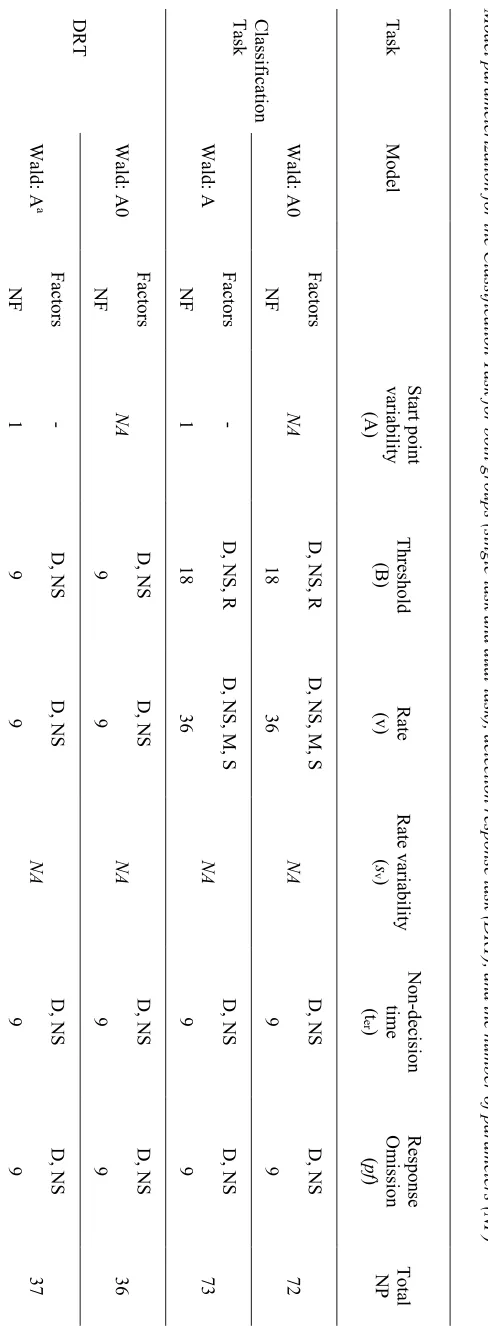
We used Wald model with and without start point variability to examine the cognitive processes underlying task performance and to test for dual-task resource competition.3 Where applicable, we used similar model parametrization for the classification task and the DRT. For both tasks, we allowed number of ships and deadline to influence threshold, rate and
response omissions. In the classification task we allowed threshold to vary with accumulator type (target vs. non-target) to allow for potential response biases. We also allowed rate to vary by the stimulus and match factors to account for changes in accuracy between stimuli. The match factor refers to whether the accumulator “matches” or “mismatches” the stimulus presented in the trial; the matching accumulator accounts for correct responses while the mismatching accumulator accounts for incorrect responses. The number of parameters for each model and task are shown in Table 1
Models were fit using Bayesian estimation via the Differential Evolution sampling algorithm (Turner, Sederberg, Brown & Steyvers, 2013) implemented in the Dynamic Models of Choice software (Heathcote et al., in press). A link to the software and scripts required to reproduce our modeling procedure are contained in supplementary materials, together with the parameter priors. Hierarchical models have a property known as shrinkage, whereby the individual estimates are pulled towards the group level estimates (Gelman et al., 2013). As we also ran analyses examining individual differences in response to time pressure, we fit the Wald models to each individual to obtain independent estimates and circumvent
non-independence issues for this analysis caused by shrinkage (Boehm, Marsman, Matzke, & Wagenmakers, 2018).
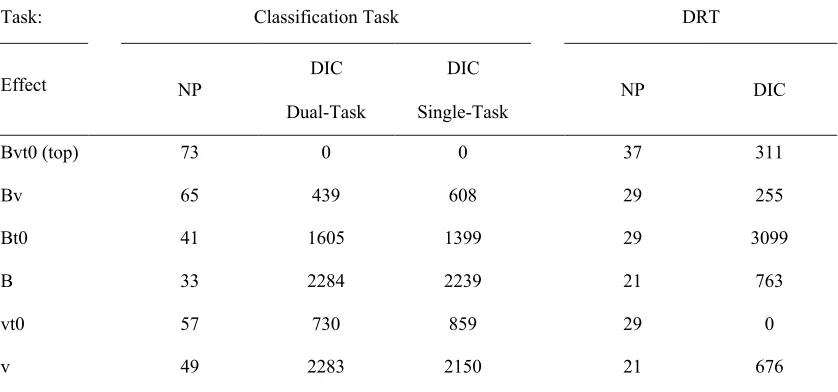
We performed model selection procedures using the Deviance Information Criterion (DIC; Spiegelhalter, Best, Carlin, & Van Der Linde, 2002). A smaller DIC value reflects greater model performance in terms of the tradeoff between model simplicity and goodness
of fit. The criterion is log-scaled, with a difference of 10 or more indicating strong evidence in favor of the model with the smaller DIC. We assessed model fits for the classification task separately for the single-task and dual-task groups. The Wald model variant with start-point variability was favored over the model variant without start-point variability for the single-task group (DIC = 88,953 vs. 89,007, respectively) and for the dual-single-task group (95,873 vs. 95,877, respectively), though the evidence for the start-point variability model was weaker in the latter group. This is contrary to Castro et al., who found that no-start variability was favored in their choice task; it is likely that our complex presentation of multiple-stimuli led to premature sampling of evidence, or sequential effects, both of which have been attributed as causing start-point variability (Heathcote, Suraev, Curley, Love & Michie, 2015; Laming, 1968). However, in line with Castro et al. both models performed better than the LBA (single-task: 89,303; dual-task: 96,327), and for the DRT task completed by the dual-task group, the Wald model with start-point variability was favored over the model variable without start-point variability (56,217 vs. 56,581), though the LBA performed better than the latter model (56,387).
We subsequently ran additional model selection tests on the best-supported Wald model with start-point variability (the “top” model) by fitting five model variants with simpler parametrizations for both tasks. The top model allowed time pressure factors to influence
alternatives allowed time pressure factors to influence only threshold (denoted B) and only mean rate (v); we omitted the equivalent model for non-decision time, as it would be unable to account for the observed changes in accuracy. The next three model alternatives allowed time pressure factors to influence a pair of parameters between threshold, mean rate and non-decision time (Bv, Bt0, vt0). The differences in DIC values for the model variants are shown in Table 4. For the classification task, the top model performed better than the simpler models for both the single-task and dual-task groups. In contrast, for the DRT, the vt0 model
performed better than the top model and other variants. The selected vto model for the DRT therefore does not allow threshold to vary as a function of time pressure. The fact that a DRT model including v was selected provides preliminary support for the resource model of dual-task interference. Given the model selection results, we targeted the Bvt0 and vt0 models for the classification task and DRT, respectively, for further analyses. The selected models are shown to describe the data well in the supplementary materials.
Between-Group and Individual Differences. Analyses of the accuracy and RT data indicated that the single-task and dual-task groups had similar performance. Although task performance is comparable between-groups, the cognitive processes underlying performance could differ. For this reason, we examined between-group differences in latent processes underlying the classification task. It is also possible that there may be individual differences in the way that participants respond to time pressure in a dual-task paradigm. For this reason, we further examined within-group differences in latent processes, assessing whether there were subgroups of individuals in the dual-task group that used different strategies in response to time pressure.
To examine these possibilities, we analyzed parameter estimates using a mixture of
the effects of time pressure factors on latent processes could be differentiated by latent groups (or classes) that are inferred by trends in the mean posterior estimates for model parameters. The mixAK package default priors were used, which are specified as being weakly informative. We fit alternative models specifying one to three latent classes (K). To select the most parsimonious model in terms of number of parameters and goodness of fit, we
used the penalized expected value (PED), as the DIC is unreliable for mixed models (Celeux, Forbes, Robert, & Titterington, 2006). Similar to DIC, a smaller PED indicates greater model performance. Our analyses focused on the most important model parameters (i.e., threshold, rate and non-decision processes). As we were interested in examining the general trajectories of these parameters as a function of time pressure, we collapsed across other factors (i.e., response type, match and stimulus factors.
We first tested whether subgroups would emerge comparing the classification task processes for the single-task and dual-task groups. If there are between-group differences, we could expect to find at least two latent classes that would approximate the single- and dual-task groups. The mean of posterior estimates for threshold, mean rate, and non-decision time parameters were used as dependent variables, with group type and time pressure factors entered as median-centered predictors. The PEDs indicated that the model specifying a single latent group was favored (PEDs for K = 1 to 3: 931, 1006, 2239, respectively; see
supplementary material for trajectories of individual participants’ model parameters and the latent groups).
We next tested whether individuals in the dual-task group could be clustered into latent groups reflecting differing responses to time pressure while performing the two tasks (e.g., responding to time pressure via response caution vs. rate of information processing). The
parameters in total – three parameters each for both tasks). A single latent group was favored (PEDs for K = 1 to 3: 339, 414, 2155).
Dual-task processes. The mixture model examining between-group differences on cognitive processes provided evidence that the presence of the DRT did not influence the processing of the primary classification task. Additionally, the mixture model examining
individual strategies in response to time pressure provided evidence that individuals used qualitatively similar strategies in response to time pressure. Therefore, we focus on the dual-task group to understand how the DRT is a sensitive measure of workload and provide quantitative results about the processes underlying task performances for the dual-task group.
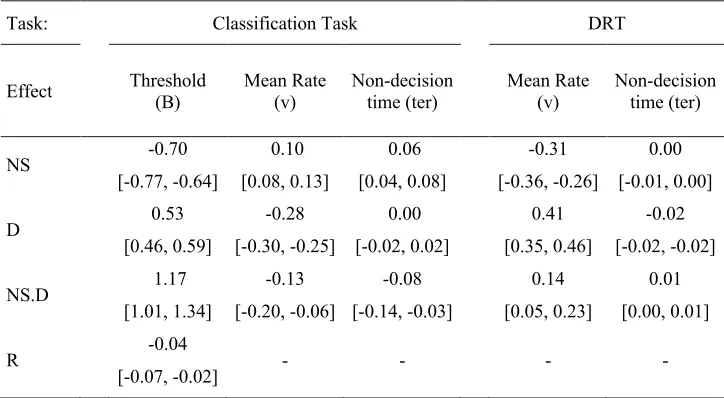
We examined the linear effect of the two time pressure factors on cognitive processes. For each iteration of the posterior estimate, we calculated the linear contrasts over parameters for the three levels of one time pressure condition within each level of the other time pressure condition. For each iteration, we then took the average over participants to derive a
distribution of linear contrasts. We applied the same procedure to test differences between the two levels of the accumulator factor (i.e., response bias). We also examine the interaction between the linear effects of the two time pressure factors. Reliable effects were inferred where 95% credible intervals for the linear contrasts did not include zero, and as such, we present the posterior mean of the linear coefficient with two-tailed 95% credible intervals. A table of the linear effects are provided in Table 5.
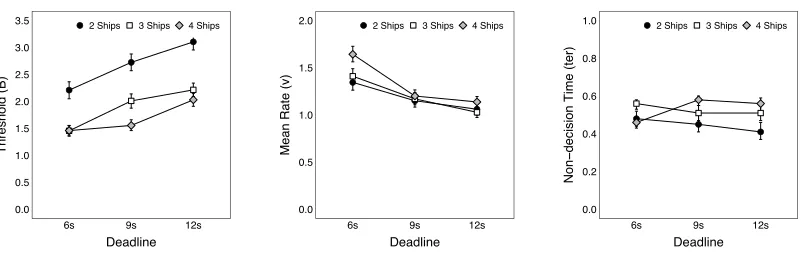
Classification Task Processes. Figure 3 illustrates the effects of deadline and number of ships on threshold, mean rate, and non-decision time. There was a decline in threshold with tighter deadlines and an increase in the number of ships. The interaction in threshold values between the time pressure factors was reliable, though this appears to be driven by the similar
between these two factors was reliable, as the effect of deadline was stronger in the 4-ship condition compared to the 2-ship and 3-ship conditions. In combination, the decline in threshold and increase mean rate in response to greater time pressure explain how
participants speeded their response times, as the accumulators have less distance to travel to reach the threshold and trigger a decision, and they do so at a greater rate. Although these
strategies ameliorated the number of missed responses, they were not fully effective, as non-response rates continued to increase with time pressure. Additionally, the decline in threshold partially accounted for the decline in accuracy with greater time pressure, as there is a greater chance of the mismatching (i.e., incorrect) accumulator reaching the threshold before the matching (i.e., correct) accumulator.
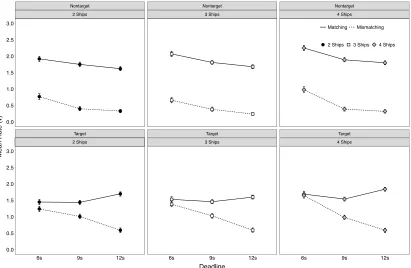
Figure 4 illustrates the effects of time pressure and stimulus effects on the rate estimates. The difference between matching and mismatching accumulators provides an index of discriminability. The difference between the accumulators decreased with tighter deadlines, whereas the difference remained constant with deadline for non-targets. The negative effect of tighter deadlines on target discriminability mediated the strong decline in target accuracy. In contrast, the constant discriminability for non-targets suggests that the decline in accuracy for non-targets was mediated by the decline in response caution.
There was reliable evidence of overall slowing in non-decision time as the number of ships increased, except for the 6s deadline, as indicated by a reliable interaction. Finally, there was also a reliable response bias main effect, such that the “target” response threshold was lower than the “non-target” response threshold (2.05 vs 2.16, respectively). The bias to respond “target” appears to have been adopted in an attempt to ameliorate the generally poor target accuracy, though this strategy was not particularly effective.
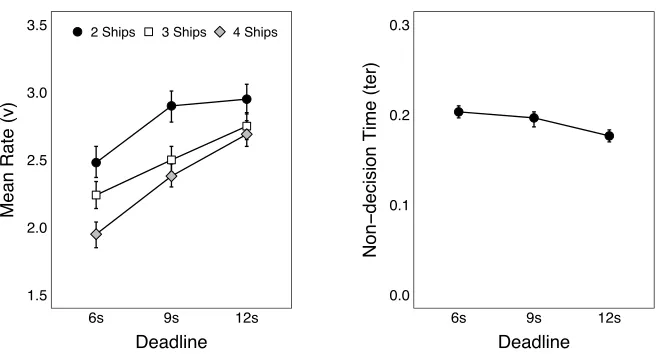
them on mean rate. The rate of evidence accumulation declined with tighter deadlines, and this effect increased with a greater number of ships. There was also a small but reliable main effect of deadline on non-decision time, such that the time required for non-decision
processes slowed with tighter deadlines. In conjunction, these two effects explain the slowing of the DRT response times and the greater frequency of missed responses, as the accumulator
takes more time to reach the threshold, and the non-decision time is added to the time required to accumulate evidence.
Discussion
Our aim was to understand the mechanisms responsible for the patterns of dual-task interference that emerge when people are placed under time pressure in a complex, dynamic environment. We did this by applying evidence-accumulation models and examining how model parameters describing participants decisions in a maritime surveillance task varied in response to time pressure. We describe the how the cognitive processes underlying the dual tasks paradigm reflect the tradeoff in resources between tasks and how the effects are diagnostic of the those hypothesized by resources models. Finally, we describe the implications of our findings.
Resource Theory
Resource models are often used to explain dual-task performance, describing a tradeoff in resources between tasks, whereby resources are prioritized towards the primary task in response to greater task demands resulting in performance decrements in the secondary task (Kahneman, 1973). Resource models have been used to explain decrements secondary tasks, including the DRT (Strayer et al., 2011). However, there are many different ways in which people can adapt to changes in task demands, including changes in response caution,
difficult to draw inferences regarding workload from behavioral data alone. For these reasons, we argued that it is desirable to have a cognitive model of both the primary task and the DRT.
The current findings provide direct evidence in support of the resource account of DRT performance (Strayer et al., 2011; ISO, 2015). Specifically, the modeling revealed that the
rate of evidence accumulation for the DRT declined as time pressure increased on the primary task, and that this was accompanied by an increase in the rate of evidence accumulation for the primary task. This suggests that the primary task and the DRT were competing for a finite pool of resources, and that participants compensated for an increase in time pressure by reallocating resources from the DRT to the primary task.
These findings reconcile the inconsistent results of previous studies that have attempted to test the resource account by modeling DRT performance without modelling the primary task. Whereas Castro et al. (in press) found that increases in primary task load were
accompanied by a decrease in the rate of evidence accumulation for the DRT, Tillman, et al. (2017) did not. It is likely that the differences in findings across studies reflect differences in the types of primary tasks that have been used. The primary tasks used in the current study and by Castro et al. (in press) are demanding. The highest levels of time pressure used in the current study were close to the “red line” observed by Palada et al. (2018). Palada et al. found that increases in time pressure beyond the levels in the current study caused performance to decline rapidly. This suggests that participants in the current study were unlikely to have spare capacity, and therefore had to reallocate resources from the DRT to the primary task as time pressure increased. Tillman, et al. (2017), by contrast, used a driving task, which was less demanding. It is unlikely that experienced drivers would be close to the “red line” under
One of the criticisms that is often levelled at resource theory is that it is unfalsifiable. Navon (1984) pointed to the falsifiability of resource models as being asymmetric: Observing a tradeoff in resources is diagnostic of limited resources being reallocated between tasks, and failures to find evidence in support of the theory are ambiguous, because they can often be explained anyway (e.g., the tasks may not be sufficiently demanding to exhaust the available
pool of capacity). Our observation of a tradeoff in resources between tasks, as reflected by the tradeoff in rates, is diagnostic of the hypotheses posited by resource models. However, had we failed to observe this tradeoff, the conclusions would be less clear and insufficient to falsify the idea of resources. For example, we could have found tradeoffs in response times and accuracy that were not due to change in rate, which would be troublesome for resource models positing some sort of reciprocity. Navon (1984) originally demonstrated the ambiguity in testing resources models by using speed and accuracy. Using
evidence-accumulation models allowed us to quantify latent cognitive processes which are conflated in observed behaviors and rule out confounds such as speed-accuracy tradeoffs. Our results emphasize how using behavioral data alone to infer resource tradeoffs could result in erroneous or oversimplified conclusions. Recently, other researches have showed that
traditional assumptions of prospective memory, which were inferred from behavioral data, do not hold when submitted to formal modeling (Strickland et al., 2018). Similarly, in this paper we show the long-held assumption of resource reallocation does not completely account for dual-task performance.
Although the changes in the rate of information processing observed in the current study are consistent with the predictions of resource theory, our modeling further revealed
additional processes underlying dual-task performance that are not consistent with a purely
This is presumably because the additional resources that were diverted from the DRT to the primary task were not sufficient to maintain performance at an acceptable standard. Unlike previous studies, response caution for the DRT did not vary with load. Castro et al. (in press) and Tillman et al. (2017) both found that participants increased their response caution for the DRT as primary task load increased. Again, the differences in findings are most likely due to
differences in the types of primary tasks that have been used. The surveillance task used in the current study imposes a firm deadline for responding. In this type of environment, it makes sense for a participant to adjust their response threshold for the primary task, rather than the DRT, in order to ensure that they have responded to all of the items before the deadline.
The current findings are consistent with a growing body of literature which suggests that people manage demands on competing tasks by strategically adjusting their response
thresholds for the different tasks. For example, Strickland, Loft, Remington and Heathcote’s (in press) prospective memory decision control theory includes a proactive control
framework, which suggests that individuals increase their response threshold for the primary task when a prospective memory task is present. The reason for raising the primary task threshold is to provide sufficient time for the prospective memory response to be made. This is because in a prospective memory paradigm, the prospective memory response has priority over the primary task response. In our paradigm, the primary task has priority over the DRT, and participants need to lower the primary task threshold in order to respond in time. In both cases, the results are consistent with the notion that participants are strategically adjusting their response thresholds to manage the demands of the competing tasks.
For both tasks, we also found a slowing of non-decision time with a greater number of
task. We suspect that this may be due to response inference between tasks, since there was a greater likelihood of response production overlap across tasks as the total number of requires responses increased.
Unlike Loft et al., (2009), we found no evidence that participants adjusted their response bias in order to manage increased load. In air traffic control, safety is more important than
accuracy, and air traffic controllers are trained to increase their safety margin as load
increases in order to ensure that they do not miss conflicts. In our maritime surveillance task, by contrast, the payoff matrix was symmetric, so there was little benefit in adjusting response bias as load increased. However, we did find that participants adopted a “target” response bias. We suspect that this strategy was adopted in attempts to improve target performance more generally, as target performance was considerably worse than non-target performance.
An inherent constraint of the physical environment in our primary task is that speed and deadline are confounded. The speed at which the objects move could have effects that are independent to the time available to make the decision (i.e., deadline). For example, it is possible that participants’ ability to discriminate between target and non-target stimuli decreases as the speed increases, because it is harder to detect the features. We ran a small control study to test whether our observed effects on rates were perceptual (i.e., were due to stimuli moving faster across the screen), motivational (i.e., were due to the increase in resources under greater time pressure) or both. Four participants performed a task largely identical to our classification task, where a single ship travelled across the screen under a 6s, 9s or 12s deadline. We found that response times speeded considerably with tighter deadlines and had a non-linear association with accuracy. We modelled performance using the Bvt0 Wald model. Consistent with the original study, rate increased as deadlines became tighter,
accumulators under varying deadlines. These results show that manipulating time pressure via the speed at which objects move influences both perception (i.e., discriminability) and the rate of information processing. The results highlight the ability of evidence-accumulation models to dissociate changes in information processing and changes in discriminability which are conflated in observed data.
Individual differences are an important factor to consider when inferring workload, as the general inferences made may not hold across all individuals. Individuals can differ in the strategies used in attempts to protect performance under varying task load, with such
individual differences being attributable to motivational factors, skills and experiences, as well as cognitive capacity (Eidels et al., 2010). However, we found that irrespective of such factors, individuals responded the same way to increased time pressure in dual-task contexts – by reallocating resources from the secondary to the primary task and adjusting response caution. We also provide evidence that the inferences made about workload via the DRT are robust against individual differences.
Practical Implications
Our results have practical implications for the assessment of workload via the DRT. Analyses on behavioral measures revealed that the DRT did not affect classification task performance. At best, compared to the single-task group, the addition of the DRT reduced classification response times by 10ms and decreased accuracy by 1%. Although this finding is consistent with driving studies (e.g., Strayer et al., 2014), Castro et al. (in press) found that the addition of the DRT decreased performance on an oscillating ball tracking task using a steering wheel as an interface, although in the standard ISO form of the DRT this decrease was only small. This small effect may be because participants are more likely to prioritize the
task is prioritized. Nonetheless, our work illustrates the benefits in using the DRT as a workload measure beyond driving contexts, and towards high workload environments more generally. Indeed, our task is representative of a broad range of tasks in which people experience dual-task inference in a dynamic environment, including air traffic control, train control, unmanned vehicle control, air battle management, and submarine track management.
We show how the DRT has the potential to be useful in controlled lab environments, as well as in the field – particularly in time pressured environments, which are a common feature in other safety non-driving contexts. However, we also acknowledge that there may be some contexts in which resource reallocation effects may not be observed, such as tasks where resources are sufficient to maintain performance on both tasks or where the individual uses alternate strategies to maintain task performance. In such cases evidence-accumulation models provide a framework to understand how the DRT is sensitive to primary task demands, and suggest that this modeling procedure should be used to validate novel applications.
Although it is critical for a secondary-task measure of workload to have no appreciable effect on primary task performance, there is the concern that the secondary task may fundamentally change the processing of the primary task (Young, Brookhuis, Wickens & Hancock, 2015). We examined the qualitative trends of time pressure effects on model parameters for the single and dual-task groups and tested for latent classes which would approximate group type. Our analyses suggested a single latent class and provides evidence that the DRT did not influence the underlying cognitive processing in the classification task, further supporting its use as a workload measure in time pressured environments. Our work provides assurance that introducing the DRT as a workload measurement tool does not affect
The modeling of both the DRT and the classification task illustrate how system designers could, in principle, use evidence-accumulation models to gain insight to the cognitive
processes underlying operator performance in multi-task environments. These models could be used to understand how operators respond to task demands, which carry significant implications for systems design, processes and procedures. For example, the models could be
used to identify points at which resources are overloaded, which has implications for the assignment of task load, whereas observing changes in response caution may carry implications for training procedures.
Overall, our results highlight the advantages of modeling primary-task performance to understand how DRT is sensitive to workload in a non-driving context. Modeling the primary task and the DRT, as well as our analysis of individual differences, allowed us to discount a range of potential caveats in finding support for the resource account of dual-task
performance.
References
Boehm, U., Marsman, M., Matzke, D., & Wagenmakers, E.-J. (2018). On the importance of avoiding shortcuts in applying cognitive models to hierarchical data. Behavior Research Methods, 50(4), 1614-1631. doi: 10.3758/s13428-018-1054-3
Brown, S. D., & Heathcote, A. (2008). The simplest complete model of choice response time:
Linear ballistic accumulation. Cognitive psychology, 57(3), 153-178. doi: 10.1016/j.cogpsych.2007.12.002
Bruyas, M. P., Dumont, L., & Bron, F. (2013). Sensitivity of Detection Response Task (DRT) to the driving demand and task difficulty. In Proceedings of the Seventh International Driving Symposium on Human Factors in Driver Assessment, Training, and Vehicle Design (pp. 64-70).
Bürkner, P.C. (2017). brms: An R Package for Bayesian Multilevel Models Using Stan. Journal of Statistical Software, 80(1), 1-28. doi:10.18637/jss.v080.i01
Castro, S., Strayer, D., Matzke, D., & Heathcote, A. (in press). How cognitive workload measurement works. Journal of Experimental Psychology: Human Perception and Performance.
Celeux G., Forbes F., Robert C.P., & Titterington D.M. (2006). Deviance Information Criteria for Missing Data Models. Bayesian Analysis, 1(4), 651-706. doi: 10.1214/06-BA122
Dambacher, M., & Hübner, R. (2015). Time pressure affects the efficiency of perceptual processing in decisions under conflict. An International Journal of Perception, Attention, Memory, and Action, 79(1), 83-94. doi:10.1007/s00426-014-0542-z
Donkin, C., Little, D. R., & Houpt, J. W. (2014). Assessing the speed--accuracy trade-off
Eidels, A., Donkin, C., Brown, S. D., & Heathcote, A. (2010). Converging measures of workload capacity. Psychon Bull Rev, 17(6), 763-771. doi:10.3758/PBR.17.6.763
Gelman, A., Carlon, J., Stern, H, Dunson, D., Vehtari, A., & Rubin, D. (2013). Bayesian data analysis (3rd ed.). London: Chapman and Hall.
Heathcote, A. (2004). Fitting Wald and ex-Wald distributions to response time data: An
example using functions for the S-PLUS package. Behavior Research Methods, 36(4), 678–694. doi: 10.3758/BF03206550
Heathcote, A., & Love, J. (2012). Linear deterministic accumulator models of simple choice. Frontiers in Psychology, 3(1), 292. doi: 10.3389/fpsyg.2012.00292
Heathcote, A., Suraev, A., Curley, S., Love, J. & Michie, P. (2015). Decision processes and the slowing of simple choices in schizophrenia. Journal of Abnormal
Psychology, 124(4), 967-974, doi; /10.1037/abn0000117961
Heathcote, A., Lin, Y-S, Reynolds, A., Strickland, L., Gretton, M. & Matzke, D. (in press). Dynamic models of choice. Behavior Research Methods.
International Organization for Standardization. (2015). Road vehicles – transport information and control systems – detection-response task (DRT) for assessing attentional effects of cognitive load in driving, ISO WD 17488.
Kahneman, D. (1973). Attention and effort. Englewood Cliffs, N.J.: Prentice-Hall. Komárek, A., & Komárková, L. (2014). Capabilities of R Package mixAK for Clustering
Based on Multivariate Continuous and Discrete Longitudinal Data. Journal of Statistical Software, 59(12), 1--38. Retrieved from: http://www.jstatsoft.org/v59/i12/
Loft, S., Bolland, S., Humphreys, M. S., & Neal, A. (2009). A theory and model of conflict detection in air traffic control: incorporating environmental constraints. J Exp Psychol Appl, 15(2), 106-124. doi:10.1037/a0016118
Logan, G. D., Van Zandt, T., Verbruggen, F., & Wagenmakers, E.-J. (2014). On the ability to inhibit thought and action: General and special theories of an act of control.
Psychological Review, 121(1), 66. doi:10.1037/a0035230
Matzke, D., Love, J. & Heathcote, A. (2017a). A Bayesian approach for estimating the probability of trigger failures in the stop-signal paradigm. Behavior Research Methods, 49, 267–281. doi: 10.3758/s13428-015-0695-8
Matzke, D., Hughes, M., Badcock, J.C., Michie, P. & Heathcote, A. (2017b). Failures of cognitive control or attention? The case of stop-signal deficits in Schizophrenia.
Attention, Perception & Psychophysics, 79, 1078-1086. doi: 10.3758/s13414-017-1287-8 Navon, D. (1984). Resources—a theoretical soup stone? Psychological Review, 91(2),
216-234. doi: 10.1037/0033-295X.91.2.216
Navon, D., & Gopher, D. (1979). On the economy of the human-processing system. Psychological Review, 86(3), 214-255. doi:10.1037/0033-295X.86.3.214
Navon, D. & Miller, J. (1987). Role of outcome conflict in dual-task interference. Journal of Experimental Psychology: Human Perception and Performance, 13(3), 435–448. doi: 10.1037/0096-1523.13.3.435
Neal, A., Hannah, S., Sanderson, P., Bolland, S., Mooij, M., & Murphy, S. (2013).
Neal, A., Ballard, T., & Vancouver, J. B. (2017). Dynamic self-regulation and multiple-goal pursuit. Annual Review of Organisational Psychology and Organisational Behavior, 4(1), 401-423. doi: 10.1146/annurev-orgpsych-032516-113156
Palada, H., Neal, A., Vuckovic, A., Martin, R., Samuels, K., & Heathcote, A. (2016). Evidence accumulation in a complex task: Making choices about concurrent
multiattribute stimuli under time pressure. Journal of Experimental Psychology: Applied, 22(1), 1-23. doi:10.1037/xap0000074
Palada, H., Neal, A., Tay, R., & Heathcote (2018). Understanding the causes of adapting, and
failing to adapt, to time pressure in a complex multi-stimulus environment. Journal of Experimental Psychology: Applied, 24(3), 380-399. doi: 10.1037/xap0000176
Parasuraman, R., Sheridan, T. B., & Wickens, C. D. (2008). Situation Awareness, Mental Workload, and Trust in Automation: Viable, Empirically Supported Cognitive
Engineering Constructs. Journal of Cognitive Engineering and Decision Making, 2(2), 140-160. doi:10.1518/155534308x284417
R Core Team (2016). R: A language and environment for statistical computing. R Foundation for Statistical Computing, Vienna, Austria. Retrieved from https://www.R-project.org/. Rae, B., Heathcote, A., Donkin, C., Averell, L., & Brown, S. (2014). The hare and the
tortoise: emphasizing speed can change the evidence used to make decisions. J Exp Psychol Learn Mem Cogn, 40(5), 1226-1243. doi:10.1037/a0036801
Ratcliff, R. (1988). Continuous Versus Discrete Information Processing: Modeling Accumulation of Partial Information. Psychological Review, 95(2), 238–255. doi: 10.1037/0033-295X.95.2.238
Ratcliff, R., & McKoon, G. (2008). The diffusion decision model: Theory and data for two-choice decision tasks. Neural Computation, 20(4), 873–922. doi: 10.1162/neco.2008.12-06-420
Academy of Sciences of the United States of America, 108(27), 11285–11290. doi: 10.1073/pnas.1100483108
Schmiedek, F., Oberauer, K., Wilhelm, O., Süß, H.-M., & Wittmann, W. W. (2007).
Individual differences in components of reaction time distributions and their relations to working memory and intelligence. Journal of Experimental Psychology: General, 136(3), 414–429.
Sewell, D. K., Lilburn, S. D., & Smith, P. L. (2016). Object Selection Costs in Visual
Working Memory: A Diffusion Model Analysis of the Focus of Attention. J Exp Psychol Learn Mem Cogn, 42(11), 1673-1693. doi: 10.1037/a0040213
Spiegelhalter, D. J., Best, N. G., Carlin, B. P., & Van Der Linde, A. (2002). Bayesian measures of model complexity and fit. Journal of the Royal Statistical Society: Series B (Statistical Methodology), 64(4), 583–639. doi: 10.1111/1467-9868.00353
Strayer, D. L., Watson, J. M., & Drews, F. A. (2011). Cognitive distraction while
multitasking in the automobile. Psychology of Learning and Motivation-Advances in Research and Theory, 54(1), 29. doi: 10.1016/B978-0-12-385527-5.00002-4
Strayer, D. L., Turrill, J., Coleman, J., Ortiz, E., & Cooper, J. M. (2014). Measuring cognitive distraction in the automobile: Ii. assessing in-vehicle voice-based interactive
technologies. AAA Foundation for Traffic Safety. Retrieved from:
https://www.aaafoundation.org/sites/default/files/MeasuringCognitiveDistractions.pdf Strickland, L., Loft, S., Remington, R. W., & Heathcote, A. (in press). Racing to remember: a
theory of decision control in event-based prospective memory. Psychological Review. Tillman, G., Strayer, D., Eidels, A., & Heathcote, A. (2017). Modeling cognitive load