by
Richard J. Croy
B.Tech.
A dissertation submitted in partial satisfaction of the requirements for the degree of
Masters of Technology
in
Food Engineering
MASSEY UNIVERSITY at PALMERSTON ORTH
Development of an In-line CIP Sensor. by
Richard J. Croy
Masters of Technology in Food Engineering Massey University (Palmerston North)
The need to spend a few hours cleaning milk powder plants at least once every 24 hours is the cause of a significant amount of downtime for a plant. This downtime is worth millions of dollars of lost production time to the New Zealand dairy industry each year.
Optimisation of the cleaning-in-place (CIP) systems used to clean milk powder factories has been limited by the lack of a method for measuring the amount of fouling throughout a plant without dismantling equipment for visual inspection. A sensor that could measure the amount of fouling remaining on a plant surface during CIP would allow cleaning rates and cleaning times to be determined for each cleaning cycle. Areas of intense fouling within the plant could also be mapped out using such a sensor.
Research was conducted to develop a method for using a heat flux sensor to mea-sure the amount of fouling remaining on a stainless steel surface during CIP. A pilot plant was built to replicate the pre-heating and fouling processes in a milk powder plant. The pilot plant had a cleaning-in-place system that cleaned the plant in a manner as similar as possible to that used in the dairy industry.
Results from pilot plant trials showed that the heat flux sensor reflected changes in the fouling mass during cleaning. The heat transfer coefficient was low in the presence of fouling on the measured surface. As fouling was removed during CIP the overall heat transfer coefficient would increase. The probe allowed the estimation of the cleaning rate and cleaning time of the measured surface. The extent of fouling removed during cleaning could also be determined. Cleaning was found to be a relatively rapid process. Fouling layers of about 1 mm thickness took about 5 minutes of washing with 1.03 w /w caustic to become almost visually clean. Visual observations of a fouling layer during cleaning showed that cleaning was a process of attrition of the fouling surface. No lumps of fouling were seen breaking off the fouling layer during cleaning.
tern-perature were found to be essential to the performance of the CIP monitoring system. When commercial Resistance Temperature Detectors (RTDs) mounted in a stainless steel sheath were used to measure the CIP fluid temperature the slow response time of the RTDs caused anomalies in the heat transfer coefficient trace. Heat loss from the RTD tip to its surroundings was also found to cause offset in temperature measurements. These anomalies were not seen when naked thermocouples were used to measure the CIP fluid temperature. The effect of changes in the thermophysical properties of the CIP solutions on the heat transfer coefficient during cleaning was also investigated. Changes in temperature were found to have the largest effect on the heat transfer coefficient. A method for compensating the heat transfer coefficient trace for changes in CIP fluid temperature was developed. The compensation was justified by predictions calculated from fundamental heat transfer theory. The concentration of soil or nitric acid did not significantly affect the heat transfer coefficient. The addition of caustic soda to the process fluid caused a very small decrease in the heat transfer coefficient.
Contents
Abstract
List of Figures List of Tables
Acknowledgements
1 Introduction
2 Literature Review
2.1 Introduction . . . . 2.1.l The value and cost of cleaning 2.1.2 Definition of the problem 2.2 Introduction to fouling .
2.2.l Composition 2.2.2 Distribution . 2.2.3 l\Iechanisms . 2.3 How clean is clean? . 2.4 Cleaning-in-Place (CIP)
2.4.l Introduction . .
2.4.2 Current practice and procedure 2.4.3 Current CIP knowledge . . . . . 2.5 Monitoring CIP processes . . . . 2.5.l Requirements of a CIP monitor . 2.5.2 Current methods of monitoring CIP 2.5.3 Industrial methods
2.6 Heat flux sensors . . . . . . . . . . 2.6.l Thermocouples . . . . 2.6.2 Thick film heat flux sensors
2.6.3 Previous studies using heat flux probes 2. 7 Conclusions. . . . . . . . . . . . . . . .. 3 Theory
4 Materials and Methods 4.1 Introduction.
4.2 Materials. . . . 4.2.1 Milk . . . . 4.2.2 CIP solutions .. 4.2.3 Steam . . . . 4.2.4 Water. . . .
4.2.5 Concentrated soiled caustic (Retentate). 4.2.6 Heat transfer paste. . . . . . . . . . 4.2. 7 Adhesive tape. . . . . . 4.3 Design and construction of the pilot plant. . 4.3.1 Objectives. . . . . . 4.3.2 Overview of the Pilot Plant. . . . . 4.3.3 Design or selection of major items. 4.4 Process control and instrumentation.
4.4.l Process control computers. 4.4.2 Flowmeters. . . . . . . 4.4.3 Temperature sensors .. 4.4.4 Heat flux sensors. . . . 4.5 Experimental techniques.
4.5.l Instrumentation used. 4.5.2 Methods of plant operation. 4.5.3
4.5.4 4.5.5
Cleaning-in-place procedure.
Effect of process fluid thermophysical properties. Details of experimental procedures . . . 5 Results and Discussion
5.1 Mathematical Analysis . . . . . . . . . . . . . . 5 .1.1 Heat transfer coefficient normalisation. .
48 48 48 48 48 49 49 49 49 49 49 50 50 55 70 70 75 75 82 87 87 89 92 95
96
99 99 995.1.2 Temperature compensation of traces . . 100
5.2 Effect of changing properties of the process fluid on the heat transfer coeffi-cient trace. . . . . . . . . . . . . . . . . . . . . . . . 103 5.2. l Effect of process fluid temperature . . . . . . . 103 5.2.2 Effect of soil concentration in the caustic solution. 106
5.2.3 Effect of nitric acid concentration. 106
6 Industry Trial 6.1 The trial site. 6.2
6.3 6.4
Sensor setup and data collection . . . . . . . . . . . . 6.2.1 Attachment of the heat flux sensor to the DSI. 6.2.2 Data logger. . .
6.2.3 Data collected. 6.2.4 Plant sensors. 6.2.5 Data storage. . Data manipulation. . . Results and Discussion.
6.4.1 Interference and noise in the collected data. 6.4.2 Sensitivity of the HF sensor to fouling .. 6.4.3 Summary discussion. . . . . . . . . 7 Conclusions & Recommendations.
7.1 Conclusions . . . . 7.1.1 Performance of the heat flux sensor during CIP .. . 7.1.2 Factors affecting the NHTC trace during cleaning. 7.1.3 Performance of the process fluid temperature sensor. 7.1.4 Limitations of the sensor . . . .
135 135 136 136 136 136 137 138 140 141 141 147 151 152 152 152 153 153 154 7.2 Recommendations for further work. . . . . . . . . . . . . 154 7.2.1 Using the HF sensor to map fouling within a plant. . 154 7.2.2 Development of a data gathering and control system using the HF
sensor. . . . . . . . . . . . . . . . . . . . . . 154 7.2.3 Development of fast-response temperature sensors. . . . . . . . . . . 155 Bibliography
A Abbreviations and Nomenclature A.l Abbreviations .
A.2 Nomenclature.
B Example Calculations.
B .1 Calculation of heat transfer coefficient for fouling modules .. . .
B.2 Effect of flowrate on HTC .. C Computer Programming.
C.l CRlOX Datalogger program. . . . . C.2 Programs for arranging data from the industrial trial. . . . . . . C.2.1 Program to patch raw data to make it a regular pattern .. C.2.2 Removing data recorded between 8 second intervals. C.2.3 Organising data into straight columns. . . . . . . . . D Chemical analysis.
D.l Mojonnier method for fat. AACC Method 30-10. D.1.1 Apparatus.
D.1.2 Reagents. . . . . .
D.1.3 Preparation of flour, bread or baked cereal products. D.1.4 Majonnier fat extraction procedure (all samples). D.1.5 Results - fat content .. . .. .
D.2 Protein Analysis - Kjeldahl Method. D.2.1 Apparatus.
D.2.2 Reagent . .. . . D.2.3 Digestion . . . .. . D.2.4 Distillation and titration. D.2.5 Results - protein content. D.2.6 Caustic analysis - retentate. E Contents of the CD-ROM
174 174 175 175 175 175 176 176 177 177
List of Figures
2.1 Evolution of soiling along the pasteurizer (C and D sections) and the UHT sterilizer (E, F and H sections) with presentation of bulk milk temperature, of the dry weight (DW) deposit and of main component composition of dry deposit recovered per plate. (After Tissier et al., 1984). . . . . . . . . . 7 2.2 Observed removal pattern for whey and whole milk protein deposits cleaned
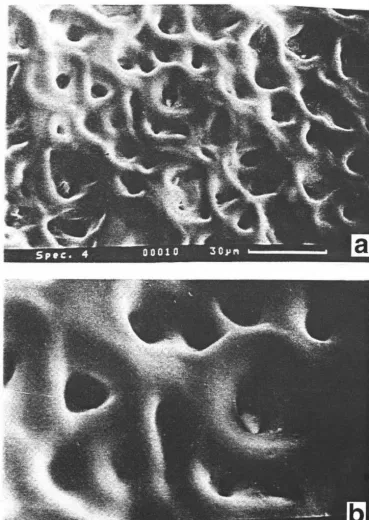
from stainless steel surfaces. (after Bird, 1997c). . . . . . . . . . . . . . . . 16 2.3 (a) and (b). SEM's of whey protein concentrate deposit contacted with 0.1
wt% sodium hydroxide at 50°C for 2 minutes. (after Bird 1997c) . . . . . . 18 2.4 (a) and (b). SEM's of whey protein concentrate deposit contacted with 0.5
wt% sodium hydroxide at 50°C for 2 minutes. (after Bird 1997c) . . . . . . 19 2.5 Schematic representation of the milk deposit removal during alkaline cleaning.
(After Jeurnink and Brinkman, 1994). . . . . . . . . . . . . . . . . . . . . . 21 2.6 Performance comparison of sodium hydroxide and LI chemicals cleaning
WPC deposit at 50°C and 0.175 m/s. (After Bird, 1997c). . . . . . . . . 23 2. 7 Effect of flowrate on cleaning time. (after Timperley and Smeulders, 1988). 24 2.8 Influence of the acid/ alkaline sequence on the removal in multiphase cleaning.
(After Grasshoff, 1997). . . . . . . . . . . . . . . . . . . . . . . . . . . . 26 2.9 Cross-section of the AERE Harwell heated radial flow cell showing the heating
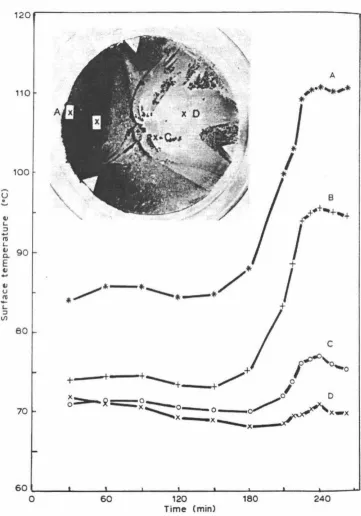
oil recirculation system. (After Fryer and Pritchard, 1989). . . . . . . . . . 28 2.10 Surface temperature variation during the operation of the RFC. The inset
shows the fouled plate and positions A, B, C and D (48.5, 28.5, 13.5 and 38.5 mm from the centre, respectively). (After Fryer and Pritchard, 1989) . . . . 29 2.11 Schematic diagram of the tapered tube. (After Fryer and Pritchard, 1989). 30 2.12 An ultrasonic transmission system for detecting a fouling deposit. (After
Withers, 1996). . . . . . . . . . . . . . . . . . . . . . . . . . 31 2.13 Change in time of flight of the ultrasonic signal against fouling film thickness
for a artificial fouling film (layers of adhesive film) in a water filled pipe. (after Withers, 1996). . . . . . . . . . . . . . . . . . . . . . . . . 32 2.14 Frequency response of the vibration sensor plotted against a function of signal
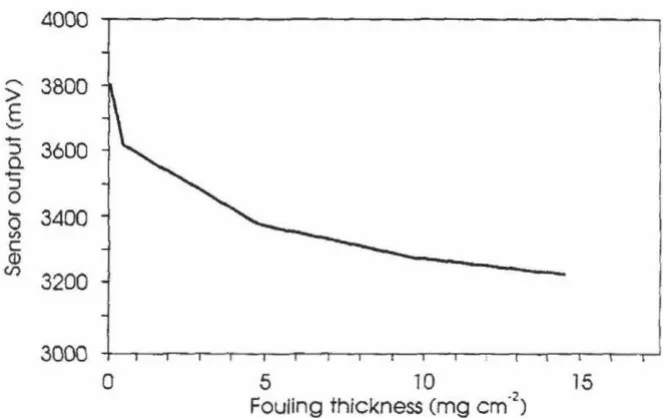
amplitude for cleaned and fouled states. (after Withers, 1996). . . . . . . . 33 2.15 Output from the optical sensor (in millivolts) against fouling film thickness
2.18 Cross section through the heated block and cut-out pipe arrangement. (after Jones et al., 1996). . . . . . . . . . . . . . . . . . . . . . . . . . . . 40 2.19 Schematic diagram of thermal resistance measurement cell. (after Davies et
al. 1997) . . . . . . . . . . . . . . . . . . . . . . 42 2.20 Plot of corrected fouling resistance against wet deposit coverage. (After
Davies et al., 1997). . . . . . . . . . . . . . . . . . . . . . . . . . . . 42 2.21 Variation of deposition along heat exchanger. Re = 5000; oil temperature
=
97°C, solid circles-run 1; open circles-run 2. (After Davies et al., 1997). . . 43 3.1 Diagram of the experimental system showing the sensor setup on a fouled wall. 46 3.2 Schematic diagram of the heat transfer system showing the individual heat
transfer resistances. . . . . . . . . . . . . 4 7
4.1 Process flow diagram for milk processing on the Pilot Plant. . 51 4.2 Photo of the Pilot Plant. . . . . . . . . . . . . . . . 53 4.3 Process and Instrumentation Diagram of the Pilot Plant. 54 4.4 Process flow diagram for clean-in-place system of the Pilot Plant. 56 4.5 Process and Instrumentation diagram of the pilot plant with the flow path
of CIP solutions marked in bold. . . . . . . . . . . . . . . . . . . . . . . . . 58 4.6 A 3D model of the fouling module developed for the study of fouling and
CIP cleaning. . . . . . . . . . . . . . . . . . . . . . . . . . . . 60 4.7 The array of the six fouling modules. Each module has six valves that allow
it to be isolated from the main flow at any time without disturbing the other modules. (Drawing by H. Bennett.) . . . . . . . . . . . . . . . . . . 61 4.8 Photograph of the fouling rig containing the six fouling modules. . . . . . . 62 4.9 Photo of the Plate Heat Exchanger (PHE) and surrounding equipment. [AJ Plate
Heat Exchanger. [BJ DSI that provided hot water to the PHE.
[CJ
Milk pump. [DJ Milk vat. . . . . . . . . . . . . . . . . . . . . . . . . . . . . . 63 4.10 Photo of the inside of the milk vat. [AJ Agitator paddle. [BJ Temperaturesensor column (filled with heat transfer oil and an RTD).
[CJ
Tank outlet to plant. . . . . . . . . . . . . . . . . . . . . . . . . . . . . . 65 4.11 Photo of the refrigeration unit for the milk vat. [A] Refrigeration unit withshroud. [BJ Exterior pipe to milk vat. Used to fill the milk vat from a truck parked outside. . . . . . . . . . . . . . . . . . . . . . 66 4.12 Photo of the holding tubes before the evaporator. [AJ Holding tube 1, 50
seconds. [BJ Holding tube two, 25 seconds. . . . . . . . . . . . . . . 69 4.13 Photo of the pilot plant with the hot water circuit marked in white. [lJ Hot
water heater. [2J Hot water pump. [3J Fouling rig. [4J Fouling tubes. . . . . 71 4.14 Photo of the Allen Bradley Programmable Logic Controller (PLC). . . . 72 4.15 Screen shot of one of the control screens on the micro-computer used to
monitor plant data and control the plant. . . . . . . . . . . . . . . . . . 74 4.16 Screen shot of one of the historical trend graphs on the micro-computer. . . 74 4.17 Photo of a RTD temperature sensor mounted in a fouling module. The RTD
is measuring the process fluid chamber. [AJ Swagelok fitting welded to the fouling module holds the RTD. [BJ The shaft of the RTD and the sensor wire. 76 4.18 Photo of the three types of temperature sensors used. [AJ RTD. [BJ
4.19 Photo of a HF sensor applied to a block of Perspex using the standard appli-cation technique. [A] HF sensor (outline can just be seen). [BJ Heat transfer paste between the HF sensor and the Perspex. . . . . . . . . . . . . . . . . 85 4.20 Photo of a heat flux (HF) sensor of the type used in all experimentation.
The sensor contains a thermopile [a] that measures the HF at the tip and an thermocouple [b] in the centre of the probe to measure the probe temperature. 89 4.21 P&ID diagram of the pilot plant showing the path taken by milk during milk
processing. 91
5.1 Plot of HTC against temperature for water moving across a clean plate. The data is from five separate runs. . . . . . . . . . . . . . . . . . . . . . . . . . 101 5.2 Comparison of two CIP monitor traces (Module 1, Run 30) with and without
the temperature correction factor (TCF). (A) Traces without temperature correction. (B) Traces with TCF. . . . . . . . . . . . . . . . . . . . . . 104 5.3 Plot of HTC (U) against temperature for four water runs. Predicted values
of U are also shown for each water run. Water run 3 has been removed as the data overlaps run 2 making the plot too cluttered. . . . . . . . . . . . . 107 5.4 Plot of HTC against temperature for 4 solutions containing increasing
con-centrations of soiled caustic (retentate). . . . . . . . . . . . . . . . . . . 108 5.5 Plot of HTC against temperature for 3 solutions containing increasing
con-centrations of nitric acid. . . . . . . . . . . . . . . . . . . . . . . . . . . 109 5.6 Plot of HTC against temperature for 4 solutions of increasing concentrations
of caustic. . . . . . . . . . . . . . . . . . . . . . . . . . . . . . . . . . 111 5.7 Plot of HTC against flowrate for four fluid types used in CIP. A theoretical
prediction for water is also plotted. . . . . . . . . . . . . . . . . . . . . . . . 113 5.8 Normalised and temperature corrected HTC traces of three plates during a
complete CIP cycle. Cleaning of two fouled plates (Fl & F2) and a clean plate (C). . . . . . . . . . . . . . . . . . . . . . . . . . . . . . . . 116 5.9 Plot of NHTC before and after cleaning. The NHTC was measured during
the rinses before and after cleaning. . . . . . . . . . . . . . . . . . . . . 118 5.10 A plot of estimated fouling resistance against time for Run 35. The flowrate
is also plotted. The numbers from [1] to [11] refer to the stills reproduced from Figure 5.11 to 5.21 . . . . . . . . . . . . . . . . . . . . . . . 121 5.11 1st rinse. Time 0:22s. White areas indicate positions where there is no fouling
and the stainless steel plate shines through. Light grey indicates fouling. The black frame indicates the location of the HF sensor on the opposite side of the plate. . . . . . . . . . . . . . . . . . . . . . . . . . . . . 121 5.12 1st rinse. Time l:l 7s. Note that the white areas have not changed. . . . . . 122 5.13 Caustic wash. Time 1:5ls. Note that the white areas have decreased in area.
Right at the probes thermopile location they have disappeared altogether. This is due to swelling of the fouling layer. . . . . . . . . . . . . . . . . . 122 5.14 Caustic wash. Time 2:11s. Note that white areas have expanded indicating
that cleaning has begun. The white areas during the caustic wash are at the same position as was observed during water rinse 1. Cleaning expands the white areas. . . . . . . . . . . . . . . . . . . . . . . . . . . . . . . . . . . . . 122 5.15 Caustic wash. Time 2:30s. White areas have expanded significantly from
5.16 Caustic wash. Time 3:0ls. 123
5.17 Caustic wash. Time 4:0ls. 123
5.18 Caustic wash. Time 5:00s. 124
5.19 Caustic wash. Time 7:26s. Near the end of the caustic wash. 124 5.20 Water rinse 2. Time 8:1ls. Note that the grey specs are no longer shrinking.
The water rinse does not clean any further. . . 124 5.21 Water rinse 21. Time 9:17s. . . . . . . . . . . . . . . . . 125 5.22 A plot of cleaning rate against time for Run 35. . . . . . . . . . . 127 5.23 HTC trace of a initially fouled plate during a caustic wash cycle. 129 5.24 Photograph of the plate (Run 35) after the post-caustic rinse. Some fouling
can be seen still remaining of the plate after cleaning. . . . . . . . . . . 130 5.25 Comparison of two temperature sensor types. Both sensors are measuring
the same flow. The RTD suffers from both a long response time and an offset error caused by heat loss. . . . . . . . . . . . . . . . . . . . . . . 131 5.26 Photograph of the two sensor types used. Sensor A is a RTD shielded in
a stainless steel sheath. Sensor B is a T-type thermocouple with plastic insulation. . . . . . . . . . . . . . . . . . . . . . . . . . . . . . . . 132 5.27 Comparison of HTC traces on a clean plate as measured by two different
temperature probes: a thermocouple and an RTD. . . . . . . . . . . . . . . 134
6.1 A plot of process fluid temperature against time. The data shows three periods of severe interference in the data. . . . . . . . . . . . . . . . . . 142 6.2 A plot of heat flux against time. The plot shows that the noise levels in the
HF data increase during cleaning-in-place. . . . . . . . . . . . . . . . . . . . 143 6.3 Plot of the time (in days) recorded by the data logger. Step changes in the
recorded time suggest that the data loggers clock suffered interference or malfunctioned during the trial. . . . . . . . . . . . . . . . . . . . . . . 143 6.4 A plot of HF sensor temperature, process fluid temperature and flowrate
during cleaning-in-place. . . . . . . . . . . . . . . . . . . . . . . . . . . . . . 145 6.5 Detail of the plot of HF sensor temperature, process fluid temperature and
flowrate during cleaning-in-place. . . . . . . . . . . . . . . . . . . . 145 6.6 A plot of the conductivity of the process fluid along with the process fluid
temperature and the HF sensor temperature during a CIP cycle. . . . . 146 6. 7 Plot of the temperature of the process fluid and the HF sensor during milk
processing. . . . . . . . . . . . . . . . . . . . . . . . . . . . . . . 149 6.8 Plot of the overall heat transfer coefficient(U) of the pipe at the exit of the
Direct Steam Injection unit during milk processing. Two (2) degrees K has been added to the temperature of the process fluid temperature for each calculation of U. . . . . . . . . . . . . . . . . . . . . . . . . 149 6.9 Plot of process fluid temperature and HF sensor temperature during a CIP
List of Tables
2.1 Food deposit constituent characteristics (after Bird, 1997a) . . . . 11
4.1 Modules within the Allen Bradley Programmable Logic Controller. 72 4.2 Variables controlled using the micro-computer. . . . . 73 4.3 Initial temperature sensor locations. . . . . . . . . . . 79 4.4 Changes made to the locations of temperature sensors. 80 4.5 Calibration data for fouling module RTD sensors. . . . 80 4.6 Calibration data for heat flux sensor thermocouples. . 81 4.7 Calibration data for thermocouples used to measure the process fluid
tem-perature in fouling modules 1, 2 & 3. . . . . . . . . . . . . . . . . . . . . . . 81 4.8 Calibration results for TC3, TC4 and TC5 with thermocouples for measuring
process fluid temperature in fouling modules 1, 2 & 3. . . . 82 5.1 Table of calculated hp values for temperatures from 20 to 90°C. 105 5.2 The composition of the soiled solutions used in the Soil Effect experiments . 106
6.1 Plant sensor signal outputs, resistors and linear equations. . . . . . . 138
B.l Calculations of U for flow velocities of 0.4, 0.5, 0.6, 0.7 and 0.8 m/s.
D.l Retentate fat content results. . . . . . D.2 Retentate protein composition results. . . . . . D.3 Titration results for caustic concentration in the retentate ..
164
Acknowledgements
I would like to acknowledge and thank the following people for their help with this project:
• Trinh, Khanh Tuoc, for his challenging and supportive supervision and the opportu-nity he provided with this project.
• Orica Chernnet Ltd, for their sponsorship and support for the project.
• Foundation for Research. Science and Technology for this opportunity provided through the GRIP project.
• Terry Smith. for his support for the project and help with obtaining supplies and equipment for the experimental work. Thanks also for his help with editing my thesis.
• Byron McKillop, for his extensive assistance and advice in building the pilot plant.
• Hayden Bennett, Andrew Hinton and Carol Ma for their help in the group project to build the pilot plant. Thanks to Carol also for her help in the chemistry lab.
• Binh Trinh, for his assistance in the pilot plant.
• Don I\IcClean. for his help with welding for the pilot plant.
• Steve Glasgow. for his help with the handling of the CIP chemicals.
• Garry Radford, for helping with lots of little queries in the lab and with getting milk for the pilot plant.
• Geedha Sivalingham-Reid, for her help in the chemistry lab.
• Hong Chen, Scott Houston and Bruce Manson at Kiwi Dairies Ltd. for their support in trialing the sensor at Pahiatua.
• Neville Burgess and Les Welch for their assistance in installing the sensor at Pahiatua.
• Gerard Harrigan, for his assistance with datalogging equipment for the factory trial and with the signal conditioner.
• Thanks also to Mike and Troy at Pahiatua for their help in the plant.
Chapter
1
Introduction
The dairy industry is a major contributer to the New Zealand economy. More than a billion litres of milk are processed annually (NZDB 2000). The total revenue from exports of milk products for the New Zealand dairy industry in 1997 /98 was $NZ 4.6 billion. Milk powder exports account for $1.6 billion of this revenue. 525,000 tonnes of milk powder were produced in 1997 /98 (NZDB 2000). Because the throughput of milk powder plants is large and the processing operations essentially continuous downtime for these plants is worth millions of dollars each year (Fung 1997).
The cleaning of milk powder plants is necessary. Failure to clean dairy processing equipment will lead to a failure of the process and possibly unsafe product (Bird 1997a). The need for cleaning causes 2-3 hours of downtime for a milk powder plant about every 18 hours. This loss of production time is a huge cost to the dairy industry.
Current CIP systems used in milk powder plants use very little or no real-time feed back control. Cleaning cycles are recipe based with a preset duration for each cleaning step. Cleaning times for each plant are determined empirically. Some plant equipment can be opened for inspection to determine if there is any fouling remaining after CIP but this process is too time consuming to be done for every cleaning cycle. Therefore it is not possible to tell if all surfaces within the plant are clean from run to run.
plant as a whole rather than whether localised surfaces ·within the plant arc clean.
The availability of a sensor that could provide local measurements of fouling would allow the cleaning process to be measured on a local scale, thus providing better opportuni-ties for process optimisation and feed-back control. Measurement of the amount of fouling remaining on a process surface during cleaning would allow local cleaning rates and cleaning times to be determined for each cleaning cycle. A local measurement of fouling would also allow the amount of fouling removed during cleaning to be determined. This would allow positions of excessive fouling within a plant to be mapped out.
This project aimed to develop a method for using a heat flux sensor to provide a local measurement of fouling on a process surface during cleaning-in-place. Heat flux sensors have been used to monitor fouling development within milk powder plants in the past (Truong et al. 1998). Several added complexities have prevented the methods used to measure fouling being directly applied to cleaning-in-place. The most significant of these is the changing thermophysical properties of cleaning-in-place solutions during a cleaning cycle. To develop a method for using a heat flux sensor to monitor cleaning two main areas of research were required:
• To develop an understanding of how to interpret changes in the measured trace in terms of the removal of fouling from the measured surface during cleaning-in-place.
• To develop methods for compensating for unwanted changes in the measured trace caused by changes in the thermophysical properties of CIP solutions during cleaning.
Chapter
2
Literature Review
2.1
Introduction
2.1.1 The value and cost of cleaning
Cleaning in the food industry has traditionally been as much of an art as a science. 'Rules of thumb', such as the widely quoted minimum cleaning velocity of 1.5 m/s, are still in use industrially. The empirical approach to cleaning in industry is due to the fact that cleaning systems were designed before scientific studies of the fundamental mechanisms of cleaning were made. This has resulted in effective but wasteful cleaning systems. The cost of cleaning is high and the expenses come from a number of sources (Bird, 1997a):
• chemical, the cost of the cleaning chemicals themselves.
• loss of production, as a result of down time. In some segments of the dairy industry, up to 42% of the available production time may be taken up with cleaning and sterilising.
• energy, needed to heat cleaning solutions and run pumps.
• product loss, food contaminated by cleaning chemicals is unmarketable.
• effluent treatment, the handling of cleaning chemicals prior to discharge and the en-vironmental consequences of the discharge.
a day (Fryer and Belmar-Beiny, 1991). Such an expense must be justified, and it can be: failure to clean dairy processing equipment will lead to a failure of the process and possibly unsafe product. Even before the product safety is compromised, fouling will progressively reduce the performance of heat transfer equipment, causing increased processing costs. It is necessary to clean for two reasons (Bird, 1997a):
• to control microorganisms, which can cause contamination • to remove fouled deposit from heat exchange surfaces.
Fouled deposit results in:
• increased pressure drop causing flow problems (in the dairy industry, pressure drop generally limits the operation of process plant)
• reduced heat transfer efficiency.
The cost of fouling to process industries is very high. It has been estimated to cost the New Zealand dairy industry around $140 million per year (Steinhagen et al., 1990).
2.1.2 Definition of the problem
A soiled system is made up of three phases:
• a solid phase, the equipment of the food processing plant. • an adherent soil phase, which may be liquid or solid. • a liquid phase, the cleaning solution.
The system involves three interfaces between (1) wall and soil, (2) soil and cleaning solution, and eventually (3) between the cleaning solution and the wall. Cleaning is the results of a series of processes:
• the diffusion of cleaning solution to the surface,
• wetting of the surface, i.e. contact between the cleaning solution and the deposit • penetration of the cleaning solution into the deposit
Difficulties with any one of these steps, such as poor mass transfer in low shear areas of a heat exchanger, low diffusivity of cleaning chemicals through compacted deposits, or slow reaction, can be rate controlling steps, and can result in slow cleaning (Bird, 1997). The rate of cleaning is therefore dependent on several factors, the most common variables of which are:
• the nature of the fouling: its structure, composition and thickness, which is dependent on the process
• the concentration and composition of detergents in the cleaning solution, especially the concentration of sodium hydroxide
• the temperature of the cleaning solution • the velocity of the flow of the cleaning solution
The last three of these items are the parameters which can be varied in a CIP cycle. These variables mean that required cleaning times can vary greatly depending on parameter values.
2.2
Introduction
to fouling
2.2.1 Composition
Two types of milk deposit have been described (Burton, 1968). Type A deposit is formed at temperatures above about 75°C and below 110°C and is a soft, voluminous, curd-like material, white or cream in colour, which may overlay a harder base. At higher temperatures, especially above 110°C, a second type of deposit is formed (type B). This is brittle, gritty and grey in colour except where is has been overheated at the surface. This deposit has a higher ash content than type A (about 70%) and a lower protein content (15-20%) (Burton 1968).
Type A deposit is largely made up of protein (50-60%), but also contains mineral matter (30-35%) (Burton (1968), Tissier and Lalande (1986), Gallot-Lavallee et al. (1984)) reported a composition of approximately 60% protein, 30% fat, 10% minerals for fouling in the holding section of a pasteuriser. The variation in composition during this study was about 10% for protein, 15% for fat. and 203 for minerals. Burton (1968) reports a fat content of 4-8% although this has been found to vary greatly depending on such variables as the source and processing history of the milk. Other workers have reported fat contents of more than 45% in dry deposits (Fung, 1998).
Tissier and Lalande (1986) found that this deposit, when forming on a heated surface had two layers. Initially a rugged and dense deposit forms within the first minute of contact. The thickness of this layer increases with the duration of the heat treatment. Simultaneously the roughness of this deposit increases. This deposit is mainly composed of minerals.
PASTC:URIZER
=
e
c 0
-Tempera rure •Deposit dry¥eight
E
U.H.T
F
F H
Figure 2.1: Evolution of soiling along the pasteurizer (C and D sections) and the UHT sterilizer (E, F and H sections) with presentation of bulk milk temperature, of the dry weight (DW) deposit and of main component composition of dry deposit recovered per plate. (After Tissier et al.. 1984).
Proteins seem to be responsible for the cohesion of the deposit. ~Iineral content increases with the depth of the deposit and mineral content is greatest near the stainless steel surface (Fryer and Delmar-Beiny, 1991).
2.2.2
Distribution
Tissier et al. (1984) showed that fouling is not homogeneously distributed along a plate heat exchanger. Figure 2.1 shows the distribution of fouling across the various sections of the pasteuriser and steriliser.
For the pasteurizer, deposit dry weight increased first with bulk milk temperature along the heat section ( C), then was higher at the beginning of the holding section (D), and finally steadily decreased.
Truong (1997) described the fouling that developed along the pipe of a fouling rig. Fouling was found to cover all the periphery of the pipe. The surface of deposit was a matrix of large porous particles, but became smaller in the area of the middle section. The thickness of the deposit varied along the length of pipe: 6 mm at inlet, 2 mm in centre and 5 mm at outlet. The total length of the pipe was 250 mm.
Davies et al. (1997) showed that the rate of mass of fouling deposit per area forma-tion was dependent on the temperature of the bulk fluid as well as the surface temperature. When the bulk temperature is lower than 75°C the reaction rate is controlled by surface reactions, and can be seen to be relatively slow. Where bulk temperature is above 75°C the fouling rate is controlled by bulk reaction rates and is more rapid. (NB. more details of this study are given in section 2.6.3). Paterson and Fryer (1988) described a model that would explain a decrease in fouling rate for surface controlled reactions. As the bulk fluid would have a lower foulant concentration than the laminar surface layer of fluid, foulant would flow from the laminar region into the bulk fluid. This would reduce the amount of foulant available in the laminar sub-layer to make contact with the heated surface.
These studies show that the rate of deposit formation is dependent on geometry and bulk fluid and surface temperatures. The variation in fouling thickness throughout the plant means that the location of a fouling monitor will have to be carefully chosen so that it is placed at the point of slowest cleaning. To complicate matters further, the location of slowest cleaning may not be the place of maximum fouling thickness.
2.2.3 Mechanisms
Fryer and Bird (1994) state that there are four stages to fouling:
• denaturation and aggregation of proteins in the hot fluid
• mass transfer to the deposit surface
• surface incorporation of protein into the deposit; a further reaction
• possible transfer of proteins back to the bulk.
will change slightly; protein will only become denatured close to the wall and will have a relatively short distance to traverse to deposit on the surface. Davies et al. (1997) called this system surface reaction controlled. When the temperature of the bulk· fluid is above 75°C the system is said to be bulk reaction controlled.
Under conditions of surface reaction control the deposit is relatively smooth and
consists of small aggregates of denatured protein. Deposits formed under bulk reaction con-trol conditions feature significantly larger aggregates in a less densely packed arrangement (Davies et al., 1997). The rate of fouling is greater under conditions of bulk reaction control. Above 70-71°C the fouling rate increases as the protein denatures, and a com-plex series of reactions takes place. The protein first partially unfolds, exposing reactive
sulphydryl groups, and then polymerises (aggregates), either with other ,8-Lactoglobulin
molecules or with other proteins such as a-lactalbumin (Fryer and Belmar-Beiny, 1991).
Fouling may have a lengthy induction period with no fall in heat exchanger performance followed by a rapid decline in performance (Fryer and Bird, 1994, Grandison, 1988a and Truong, 1997).
Davies et al. (1997) found that the total amount of protein present as deposit is a small fraction of the total mass of protein moving through the pipe. This result confirms
that protein denaturation is not the rate limiting step in the fouling process. They suggest the mass transport and attachment mechanisms are also significant.
2.3
How clean is clean?
The determination of plant cleanliness
Grasshoff (1997) states there are three aims to a proper cleaning procedure:
• a physically clean surface, that is, the absence of an optically detectable or physically measurable deposit.
• a chemically clean surface, that is, the absence of analytically detectable foreign chem-ical materials.
• a biologically clean surface that is free of viable microorganisms.
make the surface physically or chemically clean. An example of this is a heat treatment to kill microorganisms, which will actually exacerbate fouling. Processes aimed at removing physical soil may not successfully dislodge microorganisms which can become very firmly attached to a surface especially in the case of biofilm formation.
There are alternative definitions of cleaning. In some process industries, equipment may be considered sufficiently clean when its subsequent fouling behaviour is the same as a new surface (Bird, 1997a). In food industries the cleaning procedure must not leave any deposit which can damage the product, or promote the next fouling cycle.
Although a variety of possible definitions of cleanliness arc available no one defini -tion has been argued by researchers as more useful than others. From a safety and quality point of view it is clear that the very highest standards should be set. As Grasshoff (1997) summarises: a surface should be in a condition which excludes any possibility that the qual -ity of a product to be processed will undergo undesirable changes, either immediately or at a later stage. This would require that the equipment is free from all microorganisms, &.'>one microorganism is enough to contaminate the product and bacteria multiply exponentially if given suitable conditions. But the degree of chemical cleanliness required is unclear.
From the view point of product quality the purpose of cleaning is to remove ma -terial from the equipment that could become re-entrained in the product. The mineral sub-layer is optically difficult to detect but it is firmly attached to the surface of heat ex -changers and may not recontaminate the product if left accidently in the heating surface. Leaving a mineral sublayer remaining after cleaning may provide a primary layer for the growth of the next fouling deposit, and with this head start, growth during the next run will be faster with a much shorter lag phase. Economically this is a case of giving with one hand and taking with the other, as the shorter cleaning times will lead to more frequent cleaning.
If there is a spongy protein layer remaining after cleaning it will have to be removed as it may absorb CIP solution which could become re-entrained in the product during the next run. As well as this, milk fouling, having being treated with caustic solution, is swollen and very susceptible to the shear forces of a fluid moving past it and could easily make its way back into the product.
any of these could become a limiting process (Fryer and Bird, 1994). For example:
• mass transfer in low-shear areas, such as contacts between exchanger plates, could be slow, limiting both contact and removal.
• non-wetting deposit surface will resist cleaning.
• cleaning materials will diffuse only slowly through hard non-porous deposit, such as that formed by over-cooking.
• some forms of deposit, again perhaps formed by over-cooking. may be resistant to chemical attack.
It should be possible, however, to find a section of the process equipment that will be the last to become clean for a given cleaning process. Various components of foods are also more difficult to remove than others (Bird, 1997a). Table 2.1 presents examples of deposit components and their characteristics. The most difficult component of fouling to remove is the protein, according to I3ird.
Table 2.1: Food deposit constituent characteristics (after Bird, 1997a) Component Solubility Ease of removal Changes induced
on surface by heating
Sugar water soluble easy caramelisation
Fat water insoluble difficult polymerisation Protein water insoluble very difficult denaturation
alkali soluble Salts water soluble acid soluble
2.4 Cleaning-in-Place (CIP)
2.4.1 Introduction
easy to difficult interaction
The cleaning of process plant has been automated, but not optimised (Bird, 1997a). Most CIP systems are operated on a semi-empirical basis; cleaning schedules are fixed irrespective of the amount of fouling present, or the type of soil to be removed.
Sodium hydroxide forms the basis of many, but not all, cleaning compounds used in the food industry. Sodium hydroxide breaks down proteins, saponifies fats, has good disinfectancy properties, and is a relatively low cost product. Grasshoff (1997) identifies several characteristic CIP cleaning systems:
• single use cleaning, in which chemicals are only passed once through the system and then discarded to the drain or a waste treatment system.
• re-use systems in which the cleaning chemicals are stored and used several times.
• centralised cleaning, in which the whole process, independent of the object to be cleaned is controlled by a central cleaning station with a central supply of cleaning solutions via stationary pipelines.
• decentralised cleaning, in which smaller cleaning units are installed close to the objects to be cleaned. each with its own operational program.
2.4.2 Current practice and procedure
Fryer and Bird (1994) identify two types of CIP cleaning processes:
• two-stage cleaning: using both acid and alkali, commonly sodium hydroxide, followed, after rinsing, with nitric or phosphoric acid. The sodium hydroxide removes the protein whilst acid dissolves the mineral scale.
• single stage cleaning with formulated detergents, which contain compounds to enhance cleaning, such as surface active and chelating agents. These enable both protein and mineral to be removed.
A typical two-stage procedure involves five steps:
• first there is a water rinse to remove liquid milk from the equipment.
• then a heated alkali, usually sodium hydroxide, is circulated to remove the protein and fat from the deposit.
• a hot acid is then circulated, usually nitric or phosphoric acid, to removed remaining mineral deposits.
• a final water rinse is made to remove acid before processing restarts.
It should be noted, however, that there arc different views on whether the acid step should be undertaken before the alkali one. Perlat et al. (1986) found that using an acid-alkali process gave both a more effective clean in terms of amount of soil removed and
a faster clean in a indirect UHT process using a plate heat exchanger.
Grasshoff (1997) gives a list of chemicals likely to be found in alkaline and acid cleaners. Alkaline cleaners may contain:
• strong alkalis, e.g. sodium hydroxide and or potassium hydroxide, for the degradation of organic soils including denatured proteins.
• weak alkalis, for example sodium silicate, to keep the removed soil dispersed.
• sequestering agents, e.g. polyphosphates, salts of nitrilotriacctic acid (EDTA), gl
u-conates. phosphonatcs and polyacrylates for binding water hardness, for example salts
of Ca and 1Ig, and to prevent the formation of scale and insoluble precipitates.
• surface active agents, generally of the non-ionic type, to lower the interfacial tension. emulsifying fatty components, and to control the foam properties. desirable for foam
cleaners, undesirable for circulation cleaning.
• stabilisers such as phosphonates for solutions to be stored at elevated temperatures.
• oxidizers, such as hydrogen peroxide and sodium hypochlorite, to intensify the cleaning
effect.
• corrosion inhibitors, for example sodium silicate and sodium gluconate.
• solubilizer to stabilise cleaning solution concentrates.
Components of acid cleaners are:
• strong acids, for example nitric acid and phosphoric acid (non-ferrous, free of chlorides
and arsenic (danger of corrosion!)), to extract mineral components from a complex soil matrix.
• dispersing agents to prevent precipitation during the neutralisation process at the end of the acid cleaning phase.
• anionic surfactants.
Enzymatic cleaners are not commonly used because of their high price, about three times higher than conventional cleaners. They require considerably more time for disintegrating encrusted soil structures than conventional strong alkalis or acids.
Grasshoff (1997) recommends a cleaning temperature in the range of 65-70°C for the cleaning of pasteurising equipment. Experience has shown that at 70°C the gasket elastomers arc still resistant to the chemical which are generally used for cleaning purposes. Single stage processes are made possible by the addition of chelating agents, such as EDTA, to NaOH solutions. In this way the chelating agents remove mineral deposits while the alkali removes fat and protein. Timperley et al. (1994) found that cleaning a plate heat exchanger with 2% w /w concentration of sodium hydroxide for 20 mins resulted in the plates being completely covered with white deposit. When the process was repeated with a single stage detergent the pressure drop across the heat exchanger fell to the clean level within minutes.
Although the chemicals needed for single-stage cleaning are more expensive, they offer the opportunity of reduced total cleaning costs by more economical use of chemicals, wash water. labour and down time.
The over-ride method for H.T.S.T pasteurisers
2.4.3 Current CIP knowledge
Process Visualisation (Bird, 1997c)
A visual description of cleaning is given in Bird (1997c): The sequence of events during cleaning is shown in Figure 2.2. Times quoted are representative of those occurring for cleaning WPC deposit with a 0.5 wt% sodium hydroxide solution at 50°C and Re
=
1750 (velocity = 0.075 m/s).At time = 0, sodium hydroxide contacts the deposit, and a very small amount of weakly bound deposit is flushed from the matrix. The concentration or type of detergent
used does not effect this initial flushing and it occurs even when pure water is used. Only 23 of the original mass of deposit is removed this way. During the next 2 minutes the deposit swells and becomes translucent. Material leaves the surface in aggregates rather than uniformly. Some small aggregates are removed during the swelling stage; their size ranges from about 0.2 mm at 40°C to greater than 0.1 mm at 70°C; the higher the tem-perature, the smaller the aggregates. For time greater than 2 minutes, the surface of the deposit continues to break up. In these later stages of cleaning, large sections of deposit can become partially detached from the surface, and aggregates can be shed from the ends of the 'fingers' that result. Maximum aggregate sizes removed during this period range from 0.5 mm at 70°C to 1.0 mm at 40°C. After 10 minutes, deposit removal is complete. A thin layer of mineral is left attached to the surface of the stainless plate.
The removal of large lumps explains why minerals are also removed during the NaOH cleaning (Jeurnink and Brinkman, 1994). Because some minerals are bound to the protein they become trapped in a relatively large piece of deposit that is dislodged by the flow.
Cleaning mechanisms
I
10-15 seconds~
2.
Deposit
swells and becomescransluceac
ca 2 minutes
3. Breakup of sutf ace
by
detachment of aggregates.I
after 10 minutes+
4.
Only mineral layer remains.Sodium hydroxide flow
•
nm- , the shear force of a CIP flow has been estimated to be mostly between 1-10 nm-(Grasshoff 1997).
When an alkaline cleaning solution comes into contact with the deposit surface a swelling is observed and the deposit becomes translucent (Fryer and Bird, 1994). This swelling process has been photographed using Scanning Electron Microscopy (SEM). Figures 2.3 (a) and (b) show a whey protein concentrate (WPC) deposit. Figures 2.4 (a) and (l>) show the deposit after being contacted with 0.1 wt% sodium hydroxide. It can be seen that after contact the distinction between platelets has disappeared. Holes have been formed and the surface is smoother. Figure 2.3(b) also shows that the structure has also become wrinkled. The void fraction of the surface is quite low and was estimated by Bird (1997c) to be about 0.25. Swelling of the deposit layer may be a result of breakage of a number of deposit-deposit attachments or of an increased repulsion in the deposit layer due to the high pH of the alkaline cleaning solution (Jeurnink and Brinkman 1994). Experiments in which there was no flow of cleaning fluid across the deposit illustrate this initial stage of cleaning well. I3ir<l (1997b) did such experiments and found that the deposit initially swelled, and very slowly began to break up. However, in the absence of flow. material was extremely slow to diffuse away from the surface. A deposit of whey protein concentrate (WPC) swelled to 2.5 times its initial size. A whole milk deposit swelled to 1.45 times its initial size.
The use of a higher concentration than 0.5% produced changes that are deleterious to the cleanability of the deposit (Figure 2.4 (a), (l>)). The honeycomb structure begins to collapse and become shrunken. The surface voidage falls from the optimum of 0. 7 to a value of 0.6, in the case of the use of 1.0% caustic, or 0.5. in the case of 2.0% sodium hydroxide being used.
In order for all of the deposit to become swollen it is necessary that the cleaning solution diffuses through to contact all of the fouling. Jeurnink and Brinkman (1994) found that the diffusion of the alkaline cleaning solution into the deposit layer is slow; reasonable values for the thickness of the fouling layer and for the effective diffusion coefficient are 10 mm and 10-8 m2 /s, respectively. This means that it would take at least 1 hour before the cleaning solution reached the stainless steel wall by diffusion. The removal process, however, takes only a few minutes.
Figure 2.4: (a) and (b). SEM's of whey protein concentrate deposit contacted with 0.5 wt%
shown in Figure 2.5.
Water serves as (Grasshoff 1997):
• a solvent for the chemicals required for the degradation of the soil
• a transport medium for the soil removed while keeping it suspended
• a transducer of thermal and chemical energy
The mechanical energy of the cleaning fluid required for (Grasshoff 1997):
• Removal of chemically modified soil particles from the solid surface, for example as swollen, electrostatically charged colloids, partially emulsified fat and peptidized pro-tein structures.
• Splitting of larger soil aggregates into smaller units.
• Preventing sedimentation and the re-adherence of already detached soil particles.
Controlling Mechanisms The steps of cleaning are governed by mass transfer by con-vection and/or diffusion, and reaction and any of these processes could be a limiting one (Fryer and Bird, 1994). Fryer and Belmar-Beiny (1991) suggested four properties or pro-cesses that could limit the cleaning rate:
• Mass transfer in low-shear areas, such as points of contact between exchanger plates, will be slow. This will limit both contact and removal.
• Non-wetting surfaces will resist cleaning.
• Cleaning material will diffuse slowly through hard, non-porous deposits, such as those formed by over-cooking.
• Some forms of deposit (e.g. those produced by over-cooking) may be resistant to chemical attack.
stainless steel
rinse - water
milk deposit layer: a spongy protein matrix with which minerals (•) are associated and in which fat globules
(o) are embedded
alkaline cleaning solution
swelling of the deposit layer and crack formation
alkaline cleaning solution
loosening of first part of deposit
alkaline cleaning solution
remaining deposit is removed due to mechanical forces exerted by the cleaning solution. Some calcium phosphate may remain
Figure 2.5: Schematic representation of the milk deposit removal during alkaline cleaning.
70°C. It should be noted that fouling in pasteurisers with cleaning solutions above 80°C does not produce a gelled surface and this indicates that the temperature history of the deposit is an important parameter in the development of a gelled surface. Jeurnink and Brinkman (1994) suggested that if the deposit had already been sufficiently loosed form the wall before gelation of the surface took place there would be no fall in cleaning rate.
Grasshoff (1997) thought that thermodynamic processes at the solid liquid inter-face, not fluid dynamics, were the controlling process of cleaning.
Optimisation
The effect of temperature Most workers agree that the effect of temperature on clean-ing rate can be described using the Arrhenius equation. Jennings (1959) found that a 10°C increase in temperature gave a 1.6 increase in cleaning rate. A similar value of 1.8 was found by Gallot-Lavallee et al. (1984a) . An increase in temperature results in an increase in cleaning rate without an optimum temperature being reached (Schlussler (1970), Jen-nings (1959), Gallot-Lavallee et al. (1984a), Bird, (1997c)). Gallot-Lavallee et al. (1984a) reported an increase in cleaning rate up a temperature of 90°C, at which point their exper-iments ended.
Increasing the cleaning solution temperature results in ( 1) a reduction in the clean-ing time, and (2) a higher maximum removal rate at earlier times (Bird, 1997c). An increase in temperature aids deposit removal irrespective of deposit type, cleaning solution compo-sition, concentration, or flowrate.
The effect of detergent concentration It is generally agreed that there is an optimum sodium hydroxide concentration for a cleaning detergent. Fryer and Bird (1994) reported
an optimum concentration of 0.53. Timperley and Smeulders (1988) reported an opti-mum concentration of 2.53. However they were using a ready-made cleaning agent, so the alkalinity referred to as pure NaOH should be within the range of approximately 1.03.
Bird (1997c) found that when the optimum concentration was used (0.53 wt NaOH) the cleaning time was approximately 10 minutes. However when 2.03 sodium hydroxide was used the cleaning time increased to 50 minutes, the same as that for 0.13 sodium hydroxide. When using 2.03 sodium hydroxide the deposit changed rapidly to form a very thick translucent layer which was removed only very slowly, and had a burned brown appearance.
60
,.-..,
r/J 50 -l!I
=
·-
E
'-"
40 -Q)
E
·-
..._. 0.0 30-=
.:.:·-
=
t::J ~Q) 20 - t::J
• LI chemicals
E Sodium hydroxide
0
D•t::Jt::JE IO -
• •• e•
0 1 2 3
[image:38.565.135.464.101.320.2]Oeaning chemical concentration
(wt%
NaOH)
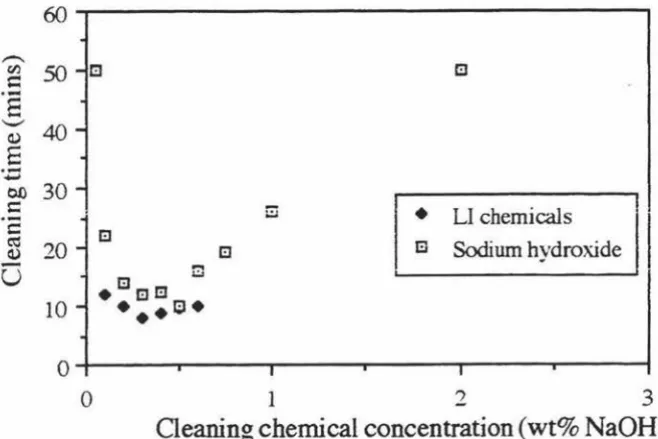
Figure 2.6: Performance comparison of sodium hydroxide and LI chemicals cleaning WPC deposit at 50°C and 0.175 m/s. (After Bird, 1997c).
structure on contact with caustic solutions. When contacted with a 0.1 wt% caustic solution
the deposit becomes swollen and has a melted appearance. When the deposit is treated
with cleaning solution of the optimum concentration of 0.53, even greater changes are seen
(shown in Figures 2.4). The deposit forms a larger and less dense honeycomb structure
(Bird, 1997c). This was estimated by Fryer (1994) to have a voidage of about 0.7.
The effect of additives to the detergent Bird (1997c) also showed that the additives
used in industrial detergents, such as sequesterants, significantly improve the performance
of a cleaning solution A comparison of the effectiveness of sodium hydroxide vs. Lever
Industrial (LI) detergents is shown in Figure 2.6. It can be seen that the industrial detergent
performs better than sodium hydroxide when used alone.
The effect of additives has been studied by Grasshoff (a review is given in Grasshoff,
1997). The addition of cleaning agents such as EDTA or nitrilotriacetic acid (NTA) leads to
both a significant increase in the cleaning rate and a considerable reduction of soil residues
remaining on the test elements at the end of the cleaning process. The addition of a
complexing agent allowed the alkalinity of the solution to be reduced without adversely
affecting the cleaning rate. Oxidizers were combined with complexing agents which lead to
an increasing the cleaning rate by a factor of 10, as compared to the removal by 0.253 NaOH
1.0
g' 0.75
c · IV -41 ::i - c.
""
...2~
41 c
e
~·-
_,...
0 ...111 E
....
0.5
0.25
0
0
0.5
1.0
Passage mean velocity of flow
•
•
•
•
•
[image:39.564.114.479.96.403.2]1.5 m/s
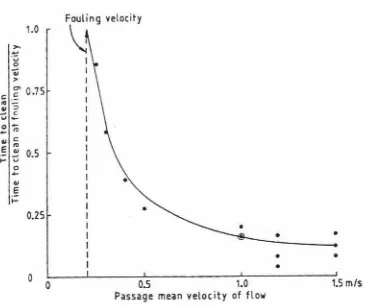
Figure 2.7: Effect of fiowrate on cleaning time. (after Timperley and Smeulders, 1988).
a synergistic effect, where the improved performance of a more complex cleaning solution is more than just the sum of the effect of individual components. This suggests that the practice of 'sharpening up' a CIP solution by dosing it with sodium hydroxide may lead to unsatisfactory cleaning results.
The effect of fluid shear / fiowrate An increase in cleaning solution velocity has been shown to give an increase the cleaning rate of WPC and whole milk deposits, irrespective of other process conditions (Bird, 1997c, Timperley and Smeulders, 1988). Figure 2.7 shows the effect of fiowrate on cleaning time. Bird also showed that there was no minimum flow rate below which, no cleaning occurred.
and 23 nitric acid. The degree of cleaning was monitored by measuring the pressure drop
across the plate heat exchangers.
Cleaning the preheater When alkali solution was used before acid, all protein and half
the minerals were removed during the alkaline cleaning and half the minerals during the
acid cleaning. When the sequence was reversed, with acid cleaning first, all the minerals
were removed during cleaning and all protein during alkaline cleaning. Cleaning with acid
before alkali gave a shorter cleaning time regardless of conditions.
Cleaning the UHT heat exchanger Whatever the cleaning procedure used all the
minerals were removed during acid cleaning, not during alkali cleaning. Cleaning with acid
before alkali gave satisfactory results: 103 of protein was removed by the acid and the
remaining 903 was removed by the alkali. However when an alkaline wash was made before
the acid wash unsatisfactory results were obtained. Eighty percent (803) of the protein
was removed by the alkali but only 53 by the following acid cleaning. When the plate heat
exchanger was dismantled organic viscous materials were found near the contact points
between the plates.
Grasshoff (1997) also obtained similar results showing that using acid before alkali
gave a faster and more effective clean. Figure 2.8 shows these results.
Other factors affecting cleaning rate The cleaning process is complex and there is
evidence that there are other factors that affect cleaning rate other than the most
obvi-ous ones of temperature, flow rate and detergent concentration. Jeurnink and Brinkman
(1994) found that the total amount of deposit removed varied from day to day and this is a
phenomenon observed by others (Timperley and Smeulders, 1987, Grandison, 1988b,
Ste-merdink & Brinkman, 1990) and is not yet explained. Fryer and Bird (1994) thought that
a multistage cleaning model would be necessary because of the complexity of the process.
2.5
Monitoring CIP processes
2.5.1
Requirements of a CIP monitor
The requirements of a CIP monitor are closely related to those required for a
fouling monitor. Fryer and Pritchard (1989) give four requirements for an on-line fouling
phase switching
100 ... -r.~--4:>-~~~~~~~~~...,-~~~---,
75
-
~ 0• standard alkaline
-0 cleaning
Cl)
+
alkaline > acid
0
ii 50 O
acid > alkaline
e
:I
'C
-;; Cl)
..
25
O'--~~~~-'-~~~~~~~~~~~~~~~
0 10 20 30 40
time (min)
Figure 2.8: Influence of the acid/alkaline sequence on the removal in multiphase cleaning. (After Grasshoff, 1997).
• Size. The monitor should be of modest size so that it can be easily installed, services and replaced. Size is of particular importance to a sensor to be installed in a heat exchanger (especially a plate heat exchanger).
• Cost. It is likely to be some time before the value of using an on-line monitor to measure fouling becomes widely accepted, and therefore the capital cost should be as low as possible. Comparison with corrosion monitors suggests a target figure not much in excess of $NZ 6,000.
• Reliability. The monitor should be robustly constructed, require the minimum of maintenance, and provide reproducible data that is easy to interpret. The probe
should also be durable under the various environmental conditions experienced in a milk powder plant. This includes high temperatures, steam and water.
• Relevance. It is important that, within these restrictions, heat transfer and fluid
flow conditions in the monitor can be related to those in the plant. It would also be
useful if samples of the deposits formed in the monitor could be easily removed for
examination.
• The probe must be in-line and give fouling measurements of the most significant food contact areas of the plant, for example heated surfaces such as evaporators and heat exchangers.
• The signal from the probe should be digital so that it can be recorded on a data logger and be interpreted by a CIP control computer.
2.5.2 Current methods of monitoring CIP
Experimental methods
Heated radial flow cells The heated radial flow cell (RFC) was developed for the study of the adhesion of microorganisms under a range of flow conditions. Duddridge
et al. (1982) used the device to study the influence of surface shear stress on the adhesion and removal of bacteria in a flowing liquid. Fryer and Pritchard (1989) used the device to study the fouling from reconstituted skim milk. Figure 2.9 shows a cross-section of the RFC. Milk entering the device flows radially between a pair of parallel disks, both of which can be heated by oil. Because the flow is radial, the velocity decreases as it moved outward, giving a continuous range of decreasing shear stresses.
Thermocouples can be attached to the plate to give on-line measurement of the
development of fouling. Several thermocouples spaced radially across the plate give an o n-line fouling monitor for a range of shear stresses. Figure 2.10 shows an example of the data and results of a fouling experiment. The photograph also hows the problems inherent with using the RFC to study the heavy fouling produced by milk. The gap between the plates has to be very narrow if the desired range of surface shear stresses is to reproduced, usually less than 2mm (Fryer and Pritchard, 1989). The build up of fouling on the plates will often exceed 2 mm, causing a blockage. In fact, a small build up of fouling will greatly reduce the cross-sectional area of the flow, causing an increase in velocity which accelerated the fouling process. Because the plates can be removed from the device, it is possible to examine the deposit with relative ease after an experiment. Fryer and Pritchard (1989) therefore concluded that the RFC is only suitable for looking at the earliest stages of deposition.
I
I I
0. ti outI 1
l
Oil inI T/C Thermocouples T/C
I
I
I
I
I I
I
l
Oil inI
I
t
i
I
Milk in
Oil out
l
[image:43.566.100.490.260.542.2]" I
u
.
..."
L.
::J
...
rvL. 110
100
~ 90
E
"
...
"
v
rv
....
'-::l
I/)
80
70
\
~
*
_,,,,~-·..._
/
.~ ~.--•
+
8
/.+
...
I
+
x o/ D
o:=--.2=~::::..:::o-o_/
-~x-x
x--x----x__./'~
60~~~..._~~.._~__..__~__.~~_..~~--'-~~--~~..._~__.-o
60 120 180 240Time (min)
Figure 2.10: Surface temperature variation during the operation of the RFC. The inset
shows the fouled plate and positions A, B, C and D ( 48.5, 28.5, 13.5 and 38.5 mm from the
[image:44.564.117.479.132.649.2]