Compensating for geographic variation in
detection probability with water depth
improves abundance estimates of coastal
marine megafauna
Rie Hagihara1*, Rhondda E. Jones1, Susan Sobtzick2, Christophe Cleguer1,3,4,5, Claire Garrigue4,5, Helene Marsh1
1 College of Science and Engineering, James Cook University, Townsville, Queensland, Australia, 2 Centre
for Tropical Water and Aquatic Ecosystem Research (TropWATER), James Cook University, Townsville, Queensland, Australia, 3 Murdoch University Cetacean Research Unit, School of Veterinary and Life Sciences, Murdoch University, South Street, Murdoch, Western Australia, Australia, 4 Ope´ration Ce´tace´s, Noume´a, New Cale´donie, 5 Unite´ Mixte de Recherche (UMR) ENTROPIE (Institut de Recherche pour le De´veloppement, Universite´ de La Re´union, Centre National de la Recherche Scientifique), Laboratoire d’excellence LabEx, CORAIL, Noume´a, New Cale´donie
Abstract
The probability of an aquatic animal being available for detection is typically<1. Account-ing for covariates that reduce the probability of detection is important for obtainAccount-ing robust estimates of the population abundance and determining its status and trends. The dugong (Dugong dugon) is a bottom-feeding marine mammal and a seagrass community special-ist. We hypothesized that the probability of a dugong being available for detection is dependent on water depth and that dugongs spend more time underwater in deep-water seagrass habitats than in shallow-water seagrass habitats. We tested this hypothesis by quantifying the depth use of 28 wild dugongs fitted with GPS satellite transmitters and time-depth recorders (TDRs) at three sites with distinct seagrass depth distributions: 1) open waters supporting extensive seagrass meadows to 40 m deep (Torres Strait, 6 dugongs, 2015); 2) a protected bay (average water depth 6.8 m) with extensive shallow seagrass beds (Moreton Bay, 13 dugongs, 2011 and 2012); and 3) a mixture of lagoon, coral and seagrass habitats to 60 m deep (New Caledonia, 9 dugongs, 2013). The fitted instruments were used to measure the times the dugongs spent in the experimentally determined detection zones under various environmental conditions. The estimated prob-ability of detection was applied to aerial survey data previously collected at each location. In general, dugongs were least available for detection in Torres Strait, and the population estimates increased 6–7 fold using depth-specific availability correction factors compared with earlier estimates that assumed homogeneous detection probability across water depth and location. Detection probabilities were higher in Moreton Bay and New Caledo-nia than Torres Strait because the water transparency in these two locations was much greater than in Torres Strait and the effect of correcting for depth-specific detection
a1111111111 a1111111111 a1111111111 a1111111111 a1111111111 OPEN ACCESS
Citation: Hagihara R, Jones RE, Sobtzick S, Cleguer C, Garrigue C, Marsh H (2018)
Compensating for geographic variation in detection probability with water depth improves abundance estimates of coastal marine megafauna. PLoS ONE 13(1): e0191476.https://doi.org/10.1371/journal. pone.0191476
Editor: Graeme Hays, Deakin University, AUSTRALIA
Received: October 23, 2017
Accepted: January 7, 2018
Published: January 25, 2018
Copyright:©2018 Hagihara et al. This is an open access article distributed under the terms of the
Creative Commons Attribution License, which permits unrestricted use, distribution, and reproduction in any medium, provided the original author and source are credited.
Data Availability Statement: The data to reproduce research findings are submitted as a part of supporting document. Dugong Aerial Survey data are available from the databasehttps:// dugongs.tropicaldatahub.org/.
probability much less. The methodology has application to visual survey of coastal mega-fauna including surveys using Unmanned Aerial Vehicles.
Introduction
A proportion of a target population is underwater during in-water surveys of aquatic wildlife and unavailable to visual observers. The probability of detecting an animal p(0, z) is often<1 (where z is the associated covariates, z = z1, z2,. . ., zq[1]). The imperfect detection of the target species results in biased estimates of population size. In response to this problem, visual sur-veys are rigorously standardised to counter imperfect detection [1] and often use correction factors in an attempt to obtain absolute abundance estimates [1,2]. Detection probability typi-cally varies with survey conditions, circumstances, space and time [3,4]. Studies of various species of marine megafauna (e.g., marine turtles [2,5–7]; sharks [8]; marine mammals [9– 12]) emphasise the importance of accounting for such heterogeneous detection probability to improve the accuracy of abundance estimates. When implemented in association with strate-gies to maximize precision, these approaches should improve the capacity of a series of surveys to determine population trends [13,14], as required for the assessment of conservation status by the International Union for Conservation of Nature (IUCN) [15].
Three sources of bias in detection probability are recognised in past studies: absence [16], availability and perception [17]. Absence bias is caused by spatial or temporal shifts in the dis-tribution of the target population with regard to a fixed survey area [16,18,19]. Availability bias occurs when animals are unavailable to be seen by observers because of unfavourable environmental conditions (e.g., sea state, turbidity, glare, water temperature, habitat type, tide and time of day) and animal traits (sex, group size, body size and colour, diving behaviour). Perception bias occurs when observers miss animals that are available for detection. Availabil-ity and perception biases can overlap, and past studies estimated these biases jointly or sepa-rately. In comparison with perception bias, availability bias can be substantial and spatially variable [1]. Thus the focus of this study is the availability bias.
Aerial surveys have been used extensively to estimate abundance and assess trends in popu-lations of sirenians (manatees and dugongs [3,12,17,20–22]). Sirenians are intermittently available to aerial observers and their availability is heterogeneous rather than static or discrete [4]. Craig and Reynolds (2004) assessed the population trends of the Florida manatee (Triche-chus manatus latirostris) using a Bayesian approach to model combined availability and per-ception detection probabilities as functions of water depth and survey region. Edwards et al. (2007) obtained three separate (presence, availability and perception) site-specific probabilities for Florida manatees in warm-water winter refuges using radio-telemetry, marked individuals and time-depth recorders (TDRs). Fonnesbeck et al. (2009) extended this study and modelled availability detection probability as a function of air temperature and wind speed. The habitat-specific abundance was estimated by Langtimm et al. (2011) separately for offshore forage sites, inland fresh drinking waters and warm-water winter refuges.
For studies of dugongs, Pollock, Marsh [22] improved the technique developed by Marsh and Sinclair [17] and modelled availability detection probability external to the aerial survey using information on turbidity and sea state and the dive profiles of wild dugongs averaged over depth gradients. Population size was then estimated using the Horvitz-Thompson estima-tor [22]. Hagihara, Jones [23] extended Pollock’s study [19] and accounted for changes in div-ing and surfacdiv-ing patterns with water depth over a limited range of bathymetric conditions.
availability bias) - funding for field works in Moreton Bay 2011 and 2012; 3) The National Environmental Science Program Tropical Water Quality Hub - funding for field works in Torres Strait; 4) The Torres Strait Regional Authority -funding for field works in Torres Strait and logistical support from the ranger staff; 5) ZoNeCo - funding for field works in New Caledonia and data analysis; 6) The Agence des Aires Marine Protegees - funding for field works in New Caledonia and data analysis; 7) the New Caledonian Dugong Technical Committee under the 2012-2015 Dugong Action Plan - funding for field works in New Caledonia and data analysis; and 8) anonymous donor - funding for field works in Moreton Bay 2011 and 2012.
The dugong is both an obligate air breather and a bottom feeder that primarily feeds on sea-grass [24]. The diving patterns depend on the depth distribution of seasea-grass community, which in turn vary with bathymetry and environmental conditions [24]. The transit time between the surface and the sea floor increases with increasing depth of the seagrass commu-nity. We hypothesised that the probability of a dugong being available for detection varies across locations with different depth distributions of seagrass, which in turn are associated with different seagrass communities and dugong feeding modes [25,26].
To test this hypothesis, we examined the dive profiles of dugongs at three sites with different bio-physical features, depth distributions and seagrass communities (Fig 1): 1) oceanic waters dominated by deeper-water seagrass communities to 40 m (Torres Strait, Australia [27]); 2) a shallow protected bay (mean depth 6.8 m), characterised by large inter- and sub-tidal seagrass meadows (Moreton Bay, Australia [28]); and 3) coral and seagrass dominated lagoons with depths ranging from inter-tidal to 60 m (New Caledonia). We then used archival aerial survey data to compare aerial survey estimates of dugong abundance obtained using depth-corrected availability correction probabilities with the corresponding estimates obtained using the avail-ability detection probabilities of Pollock et al. [18], who assumed that availavail-ability bias did not vary with water depth.
Materials and methods
Study sites
Torres Strait (9.50˚S, 142.30˚E) is formed by the inundated land bridge between the tip of Cape York Peninsula, Australia, and Papua New Guinea (Fig 1). The depth distribution of sea-grass in Torres Strait extends to 40 m [29]; ~10,000 km2of seagrass occurs in water>5 m deep [30]. Dugongs principally feed by cropping the leaves of dense seagrass meadows dominated byThallasia,CymodoceaandSyringodiumspp. [27]. These species represent a high proportion of the stomach contents recovered from dugongs in Torres Strait [26], which mainly feed in deeper-water seagrass meadows [27]. Moreton Bay (27.39˚S, 153.32˚E) is a large sub-tropical embayment. The bay supports seagrass meadows over shallow banks, typically<10 m deep [31]. Satellite-tracked dugongs frequently use these banks [32,33] where dugongs spend ca. 40% of their time [34] excavating the above- and below-ground plants of pioneer seagrass such asHalophilaspp.and Halodulespp. [28]. The main island of the New Caledonia archipelago (20.90˚S, 165.62˚E) located in eastern Melanesia is surrounded by a lagoon. The area where the dugongs were tracked (Cap Goulvain, Ouano and Noumea) consists of coral reefs, sandy bottoms and seagrass meadows [35,36]. No information on dugong feeding modes or stomach contents is available from New Caledonia, but seagrass assemblages similar to Moreton Bay and Torres Strait have been recorded (Thallasia,Cymodocea,Syringodium,Halophilaand Halodulespp. [37]).
Availability detection probability
Depth of detection zones. Two pieces of information are required to estimate the
depth resolution (±0.08 m). The experiment was carried out between April 2013 and April 2014 on an opportunistic basis. The details of the experiment are described inS1 File.
Data collection and processing. We analysed data collected from 28 wild dugongs that
[image:4.612.51.562.73.511.2]were each fitted with GEN4 GPS/Argos Systems units (Telonics Inc., Mesa, Arizona, USA) and archival TDRs (Mk9 or MiniPAT; Wildlife Computers Woodinville, WA, USA) in Octo-ber-November 2015 (Torres Strait), May-June 2011 [23] and July-September 2012 [33] (Moreton Bay) and September-October 2013 [38] (New Caledonia;Table 2). A GPS satellite transmitter was fitted to each dugong using a padded peduncle belt and a 3-m tether. A TDR was attached to the peduncle belt at the dugong’s tailstock and was thus unaffected by the length of the tether. This technique has been used successfully on more than 100 dugongs
Fig 1. Maps showing dugong aerial survey blocks and transects in: A) Torres Strait, Australia, B) Moreton Bay, Australia and C) New Caledonia. Shaded areas and lines in the main map represent the survey area and transect lines. The month and year of the aerial surveys conducted at each location are shown in the top right corner.
since the 1980s [33,39]. Procedures for capturing, handling and attaching the tracking units followed Sheppard et al. [18] in Moreton Bay and New Caledonia or Fuentes, Cleguer [40] in Torres Strait. Details of individual dugongs are provided inS1 Table.
The GPS satellite transmitters were programmed to communicate with satellites every hour (25 animals) or 30 min (three animals deployed in Moreton Bay) (S1 Fig). The TDRs recorded depths every 1–2 s (Mk9) or 75 s (MiniPAT). Each MiniPAT was programmed to transmit the data to the satellites upon detachment after 60 days or upon earlier detachment. The Mk9 units were recovered for data retrieval. The GPS location data were retrieved from the Argos web site and decoded using the Telonics Data Converter; the Wildlife Computers portal was used to obtain the MiniPAT data. We used only high-quality location data: GPS fixes (±2 to
<10 m) and resolved Quick Fix Pseudoranging (QFP) fixes (±<75 m) for further analysis. The dive records from the Mk9 units were decoded by HexDecode. The sources of error in the depth records included: 1) drift in zero-reading; 2) wave action; 3) the depth resolution of the depth sensors; 4) the location of the depth sensors attached to the animals; and 5) the angle of animals’ body. Thus the depth records were zero-offset at each 10-min interval using custom software [41].
[image:5.612.199.578.87.153.2]We assumed that the depth records collected by the Mk9 TDRs and MiniPATs were equiva-lent because: 1) both devices were made by the same manufacturer and had 0.5 m depth sensor resolution, 2) the accuracy of the depth records were tank-tested at a local 15m deep aquarium, and 3) the reliability of the depth profile provided by the maximum memory capacity of the MiniPATs (60 days) was confirmed by sub-sampling the depth records collected by the Mk9 TDRs assuming that the depth records were collected at the same frequency as the MiniPATSs (75sec) using the 1 sec Mk9 TDR sampling frequency as the standard. Some GPS transmitters and a MiniPAT were prematurely released from the dugongs due to unknown reasons or the
Table 1.
ECI In-water visibility Maximum depth (m)±SE Detection zone (m)
1 clear water, bottom clearly visible All depths1 All depths1
2 variable clarity, bottom visible but not clearly 2.07±0.50 0 to 2.0
3 clear water, bottom not visible 3.45±0.59 0 to 3.5
4 turbid water, bottom not visible 1.59±0.70 0 to 1.5
Means and standard errors (SE) of the maximum depths at which Dugong Secchi Disks were visible to experienced aerial observers under the Environmental Conditions Index (ECI), plus the depths of the detection zones used to estimate the proportion of time dugongs were available to aerial observers.
1
The experiment was not repeated for ECI1 because by definition all dugong models were available for detection by trained observers in aircraft at 500 ft (~152.4 m) under such environmental conditions.
https://doi.org/10.1371/journal.pone.0191476.t001
Table 2.
Site Year Dugongs sampled TDR Sampling interval (s) Number of days with data (mean±s.d.)
Torres Strait 2015 6 M MiniPAT 75 4–60 (x¼5121)
Moreton Bay 2011 4 F Mk9 1 16–78 (x¼6231)
Moreton Bay 2012 4 F; 5 M Mk9 2 6–48 (x¼3018)
New Caledonia 2013 5 F; 4 M Mk9 2 3–375 (x¼52121)
Summary of the dugongs studied, year of satellite tracking studies conducted, the equipment used and the number of days with both GPS and dive records used in the analysis.
M = male; F = female
[image:5.612.35.581.593.658.2]malfunction of the weak link installed on the tracking apparatus. The weak link was designed to ensure the release of animals if the tether became entangled.
Statistical methods. Availability detection probabilities and their standard errors were
estimated following Hagihara et al. [19]. The response was the proportion of time dugongs spent in each detection zone. Water depth and time of day were the two explanatory variables. The water depth was tidally adjusted at each location and time using a bathymetric model (± 100 m spatial resolution) [42]. The relationship between the response and water depth was non-monotonic and water depths were estimated from the model rather than measured empirically. Accordingly, water depth was divided into three empirically-selected depth cate-gories:<5 m deep, 5 to<20 m deep and water20 m deep. Time of day was divided into three equal periods: 0000-0800h, 0800-1600h and 1600-0000h. The 0800-1600h block reflected the time aerial surveys are conducted. We used Generalized Linear Mixed Models (GLMMs) assuming a binomial distribution and treated individual animals as a random variable. Auto-correlation between samples was minimal as each sample represented depth records from a 10-min block [41] and was collected at 1-h or 30-min interval. Statistical analysis was per-formed using lme4 (lme4_1.1–8) in R 3.1.3 (R Development Core Team, 2015).
Abundance estimation
Population abundance was re-estimated using the archived aerial survey data collected in Tor-res Strait (2006, 2011 and 2013 all in summer), Moreton Bay (summer 2005, summer 2011 and winter 2013) and New Caledonia (winter 2003, summer 2008 [43]; and summers and winters 2011 and 2012 [38]). The aerial survey methodology is detailed in Marsh and Sinclair [17], Marsh and Sinclair [44], Pollock et al. [18] andS2 Filefor surveys in Australia and Garrigue, Patenaude [43] for surveys in New Caledonia.
Results
Availability detection probability
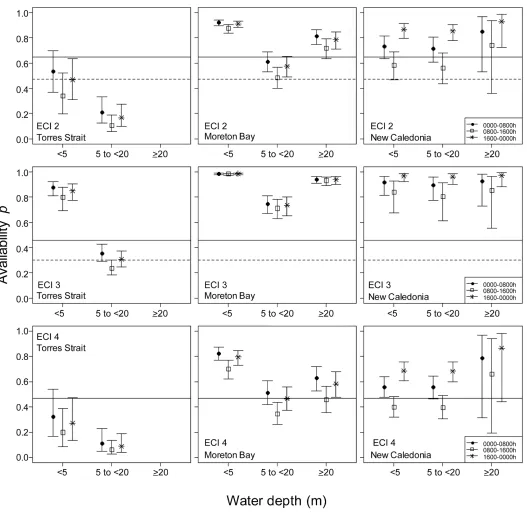
The time dugongs spent in each detection zone varied with location and time of day as well as water depth and environmental conditions. Dugongs in Torres Strait spent less time in the detection zones (Fig 2) than in Moreton Bay and New Caledonia, which were similar to each other. At all three locations, dugongs spent the smallest proportion of time in the detection zone during daylight hours (0800–1600 h). No satellite locations were obtained from dugongs in water>20m deep in Torres Strait. Therefore, the detection probability could not be esti-mated for that depth range at this location. This omission made only a trivial difference to the abundance estimates because few dugongs were sighted in this depth category during surveys (1% 2006, 4% 2011 and 3% 2013). The availability detection probabilities were the lowest in the intermediate depth category (5 to<20 m) in both Torres Strait and Moreton Bay but was no significant difference in New Caledonia between the shallowest (<5 m) and intermediate depth categories.S2 Tableprovides the model outputs.
Abundance
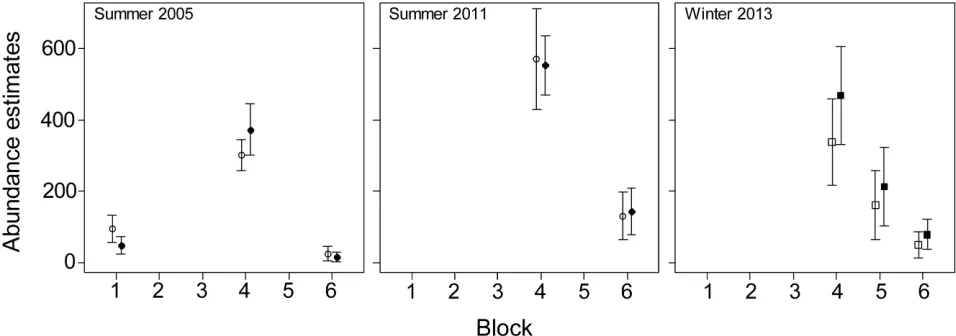
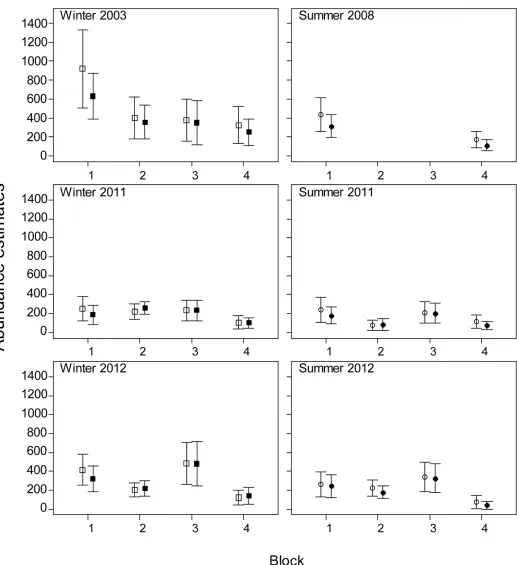
previous estimates except for the winter 2013 survey (Fig 4) when the estimates for all blocks were higher than for the earlier surveys (overall increase 1.28). In New Caledonia our abun-dance estimates were lower than the previous estimates for all surveys (Fig 5). The reduction was smaller in the winter surveys (3–22%) than in the summer surveys (12–30%). In all
Fig 2. Availability detection probability estimates at the three locations, three time periods, three depth categories and three levels of environmental conditions
index (ECI2-4). The horizontal lines represent the availability detection probabilities from Pollock et al. [18] for three turbidity levels and sea states (solid
lines = optimal sea state; dotted lines = marginal sea state). Note in this study turbidity levels and sea state were merged to give a composite index ECI. The dotted lines in ECI4 are invisible as they overlap with the solid lines.
surveys, the coefficients of variation of the abundance estimates were very similar to those obtained using the previous methodology (Table 3;S3 Table).
Discussion
[image:8.612.52.577.59.575.2]The proportion of time the tracked dugongs were close enough to the surface to be seen by aerial observers varied among locations with different bathymetries; the difference between
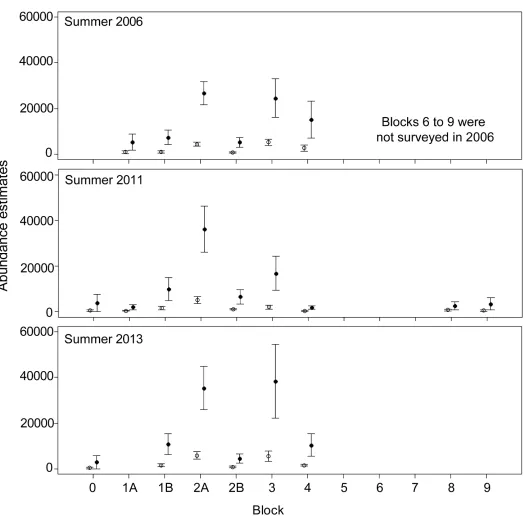
Fig 3. Population abundance estimates (±SE) (vertical lines) in Torres Strait obtained using the availability detection probabilities from Pollock et al. [18]
(open circles) and this study (closed circles).
Torres Strait and Moreton Bay/New Caledonia was substantial. These results are consistent with our hypothesis that the probability of a dugong being available for detection varies across locations with different depth distributions of seagrass communities. Dugongs in each location forage different assemblages of seagrass, and the feeding mode used may also be different (cropping is likely to be more frequently used by dugongs in Torres Strait whereas excavating may be more prevalent in dugongs found in Moreton Bay). This difference in seagrass com-munity targeted by dugongs and feeding mode may lead to different proportions of time spent in the detection zones. The magnitude of each of these factors to availability bias is unknown but is a potential area of further investigation.
[image:9.612.97.575.504.672.2]Although the dive profiles of the four dugongs tracked in Moreton Bay in 2011 showed that they transited rapidly between the surface and the seafloor in benthic dives and spent longer
Table 3.
Survey Abundance ratioa CV
1 2
Torres Strait Summer 2006 5.71 0.16 0.16
Summer 2011 6.61 0.17 0.18
Summer 2013 6.52 0.19 0.20
Moreton Bay Summer 2005 1.04 0.14 0.22
Summer 2011 0.99 0.22 0.15
Winter 2013 1.38 0.29 0.24
New Caledonia Winter 2003 0.78 0.27 0.26
Summer 2008 0.70 0.33 0.31
Winter 2011 0.97 0.25 0.22
Summer 2011 0.84 0.30 0.29
Winter 2012 0.95 0.24 0.25
Summer 2012 0.88 0.26 0.27
Ratio of the dugong abundance estimates using the availability detection probabilities from: 1) Pollock et al. [18] and 2) this study and the corresponding coefficients of variation (CV) of the abundance estimates.
aAbundance estimate from this study (numerator)/ corresponding estimate from Pollock et al. (2006) (denominator).
https://doi.org/10.1371/journal.pone.0191476.t003
Fig 4. Population abundance estimates±SE (vertical lines) in Moreton Bay obtained using the availability detection probabilities from Pollock
et al. [18] (open squares) and this study (closed squares).
Fig 5. Population abundance estimates±SE (vertical lines) in New Caledonia obtained using the availability detection probabilities from Pollock et al. [18] (open squares) and this study (closed squares).
time in the bottom phase of a dive [45], the shallow bathymetric characteristics of this area pre-sumably result in dugongs spending a longer proportion of their time in the detection zones. Nonetheless when in deeper waters, the tracked dugongs spent 72% of their time in the detec-tion zone during the day. This result suggests that in Moreton Bay feeding is not the main activity for dugongs in deep water where seagrass tends to be sparse or absent. In addition, the energy expended by a diving dugong presumably increases with water depth.
In New Caledonia, the times dugongs spent in the detection zones were generally similar to those found in Moreton Bay except for small differences, especially in the shallowest depth cat-egory where the animals spent less time in the detection zone than in Moreton Bay. New Cale-donian waters comprise a mixture of habitat types (coral reefs, seagrass meadows and sandy bottoms [37]) and although seagrass density is spatially variable most of seagrass meadows occur in water<5 m deep ([36], Claude Payri pers. comm.). These dugongs in New Caledonia may forage more frequently in this shallow depth range than in Moreton Bay where seagrass is available over vast banks extending to ca. 15 m deep. The longest times recorded for dugongs in the deepest depth category in New Caledonia are supported by observations of dugongs sur-face-resting at the edge of the lagoon [38].
Abundance
The population size estimates in Torres Straits were 6–7 times higher in our study than esti-mated using Pollock et al.’s [18] availability detection probabilities. This result is largely explained by all of our detection probabilities for environmental conditions (ECI2-4) in the intermediate depth category (5 to<20 m) being lower than those of Pollock et al. [18] and the high proportion of dugong sightings in that depth category (66% of animals sighted in 2006, 60% in 2011 and 78% in 2013;Fig 2). Our larger population size estimates are consis-tent with Marsh et al. [46], who used several lines of evidence to demonstrate that the Torres Strait dugong population has been stable for at least 30 years despite high levels of indigenous harvest and concluded that the population size must be much larger than previ-ously estimated.
The abundance estimates in Moreton Bay were similar to the previous estimates because most animals (73% in 2005 and 64% in 2011) were sighted in clear shallow water (EC1) and no correction was applicable to these sightings. In contrast, the abundance estimate for the 2013 winter survey was 1.28 times higher than the previous estimate. All our abundance estimates in New Caledonia were lower than the previous estimates because a large proportion of dugongs was sighted in environmental conditions ECI3 (46% 2003, 60% 2008, 41% and 38% in winter and summer 2011, 23% and 41% in winter and summer 2012) and the associated availability detection probabilities were higher than those from Pollock et al. [18]. The reduc-tion in the abundance estimates was, however, smaller in the winter surveys (22% in 2003, 3% in 2011 and 5% in 2012) than for the summer surveys (30% in 2008, 16% in 2011 and 12% in 2012). Seasonal differences in the dugong’s diving and surfacing patterns may explain this difference.
Conclusions
Our study demonstrates the importance of investigating the sources of and correcting for het-erogeneous availability bias to improve the accuracy of abundance estimates when absolute estimates are required. Even when interest focusses on trends in density or abundance, it is important to investigate whether and how much p(0, z) varies to avoid the confounding effects of heterogeneous bias [1] on the index of interest. The approach used here could be customised for coastal marine wildlife such as marine turtles [6], dolphins and sharks and other visual techniques such as the use of Unmanned Aerial Vehicles [7,50].
Supporting information
S1 File. Methods used for the Dugong Secchi Disk experiment.
(DOCX)
S2 File. Dugong aerial survey methodology.
(DOCX)
S1 Fig. GPS satellite points.
(DOCX)
S1 Table. Details of dugongs and fitted instruments.
(DOCX)
S2 Table. GLMM outputs.
(DOCX)
S3 Table. Abundance estimates.
(DOCX)
S4 Table. Data to reproduce availability bias estimates for Torres Strait.
(DOCX)
Acknowledgments
Funding was provided by James Cook University, the Australian Marine Mammal Centre, the National Environmental Science Program Tropical Water Quality Hub and the Torres Strait Regional Authority, ZoNeCo, AAMP (Agence des Aires Marines Prote´ge´es), the New Caledonian Dugong Technical Committee under the 2012–2015 Dugong Action Plan and an anonymous donor. Thanks to the Torres Strait Regional Authority and the Mura Badulgal Representative Native Title Body Corporate for their permission to conduct the tagging project in their sea country, Lionel Gardes and Damien Grima from the Agence des Aires Marines Prote´ge´es, Mark Hamann and Shane Preston from JCU and all the members of aerial survey and dugong tagging teams. Lachlan Marsh developed the Python program to estimate the stan-dard errors for abundance estimates.
Bay Marine Parks permit #QS2010/CVL228 and Scientific Purposes permit QISP11222812. Permits required to capture and satellite-track dugongs in New Caledonia in 2013 were obtained from the James Cook University Animal Ethics Committee (Permits A1735 and A1936) and the North (60912155-2013/JJC) and South (3157-2012/ARR/DENV) Provinces of New Caledonia.
Author Contributions
Conceptualization: Rie Hagihara, Rhondda E. Jones, Helene Marsh.
Data curation: Rie Hagihara, Susan Sobtzick, Christophe Cleguer, Claire Garrigue.
Formal analysis: Rie Hagihara.
Funding acquisition: Rie Hagihara, Helene Marsh.
Investigation: Rie Hagihara.
Methodology: Rie Hagihara, Rhondda E. Jones, Susan Sobtzick, Helene Marsh.
Project administration: Claire Garrigue.
Software: Rhondda E. Jones.
Supervision: Rhondda E. Jones, Helene Marsh.
Validation: Rie Hagihara.
Visualization: Rie Hagihara.
Writing – original draft: Rie Hagihara, Helene Marsh.
Writing – review & editing: Rie Hagihara, Rhondda E. Jones, Susan Sobtzick, Christophe
Cle-guer, Claire Garrigue, Helene Marsh.
References
1. Buckland ST, Anderson DR, Burnham KP, Laake JL, Borchers DL, Thomas L. Advanced distance sam-pling: estimating abundance of biological populations. New York, NY: Oxford University Press; 2004.
2. Thomson JA, Cooper AB, Burkholder DA, Heithaus MR, Dill LM. Heterogeneous patterns of availability for detection during visual surveys: spatiotemporal variation in sea turtle dive-surfacing behaviour on a feeding ground. Methods Ecol Evol. 2012; 3(2):378–87.https://doi.org/10.1111/j.2041-210X.2011. 00163.x
3. Edwards HH, Pollock KH, Ackerman BB, Reynolds JE, Powell JA. Estimation of detection probability in manatee aerial surveys at a winter aggregation site. J Wildlife Manage. 2007; 71(6):2052–60.https:// doi.org/10.2193/2005-645
4. Laake JL, Borchers DL. Methods for incomplete detection at distance zero. In: Buckland ST, Anderson DR, Burnham KP, Laake JL, Borchers DL, Thomas L, editors. Advanced distance sampling. New York: Oxford University Press; 2004. p. 108–89.
5. James MC, Ottensmeyer CA, Eckert SA, Myers RA. Changes in diel diving patterns accompany shifts between northern foraging and southward migration in leatherback turtles. Can J Zool. 2006; 84 (5):754–65.https://doi.org/10.1139/Z06-046
6. Fuentes MMPB, Bell I, Hagihara R, Hamann M, Hazel J, Huth A, et al. Improving in-water estimates of marine turtle abundance by adjusting aerial survey counts for perception and availability biases. J Exp Mar Biol Ecol. 2015; 471:77–83.https://doi.org/10.1016/j.jembe.2015.05.003
7. Schofield G, Katselidis KA, Lilley MKS, Reina RD, Hays GC. Detecting elusive aspects of wildlife ecol-ogy using drones: new insights on the mating dynamics and operational sex ratios of sea turtles. Funct Ecol. 2017. Epub 24 Jul 2017.https://doi.org/10.1111/1365-2435.12930
9. Heide-Jorgensen MP, Hammeken N, Dietz R, Orr J, Richard PR. Surfacing times and dive rates for nar-whals (Monodon monoceros) and belugas (Delphinapterus leucas). Arctic. 2001; 54(3):284–98.
10. Stockin KA, Fairbairns RS, Parsons ECM, Sims DW. Effects of diel and seasonal cycles on the dive duration of the minke whale (Balaenoptera acutorostrata). J Mar Biol Assoc Uk. 2001; 81(1):189–90. https://doi.org/10.1017/S0025315401003630
11. Teilmann J, Christiansen CT, Kjellerup S, Dietz R, Nachman G. Geographic, seasonal, and diurnal sur-face behavior of harbor porpoises. Mar Mammal Sci. 2013; 29(2):E60–E76.https://doi.org/10.1111/j. 1748-7692.2012.00597.x
12. Craig BA, Reynolds JE. Determination of manatee population trends along the Atlantic coast of Florida using a Bayesian approach with temperature-adjusted aerial survey data. Mar Mammal Sci. 2004; 20 (3):386–400.https://doi.org/10.1111/j.1748-7692.2004.tb01168.x
13. Gerrodette T. A power analysis for detecting trends. Ecology. 1987; 68(5):1364–72.https://doi.org/10. 2307/1939220
14. Taylor BL, Gerrodette T. The uses of statistical power in conservation biology—the Vaquita and North-ern Spotted Owl. Conserv Biol. 1993; 7(3):489–500.https://doi.org/10.1046/j.1523-1739.1993. 07030489.x
15. IUCN. The IUCN Red List of Threatened Species 2017.http://www.iucnredlist.org/.
16. Lefebvre LW, Ackerman BB, Portier KM, Pollock KH. Aerial survey as a technique for estimating trends in manatee population size: problems and prospects. O’Shea TJ, Ackerman BB, Percival HF, editors. Washington DC: US Department of the Interior, National Biological Service; 1995.
17. Marsh H, Sinclair DF. Correcting for visibility bias in strip transect aerial surveys of aquatic fauna. J Wild-life Manage. 1989; 53(4):1017–24.https://doi.org/10.2307/3809604
18. Forney KA. Environmental models of cetacean abundance: reducing uncertainty in population trends. Conserv Biol. 2000; 14(5):1271–86.https://doi.org/10.1046/j.1523-1739.2000.99412.x
19. Rowat D, Gore M, Meekan MG, Lawler IR, Bradshaw CJA. Aerial survey as a tool to estimate whale shark abundance trends. J Exp Mar Biol Ecol. 2009; 368(1):1–8.https://doi.org/10.1016/j.jembe.2008. 09.001
20. Fonnesbeck CJ, Edwards HH, Reynolds IJE. A hierarchical covariate model for detection, availability and abundance of Florida manatees at a warm water aggregation site. Thomson DL, Cooch EG, Conroy MJ, editors. New York, NY: Springer; 2009.
21. Langtimm CA, Dorazio RM, Stith BM, Doyle TJ. New aerial survey and hierarchical model to estimate manatee abundance. J Wildlife Manage. 2011; 75(2):399–412.https://doi.org/10.1002/jwmg.41
22. Pollock KH, Marsh HD, Lawler IR, Alldredge MW. Estimating animal abundance in heterogeneous envi-ronments: An application to aerial surveys for dugongs. J Wildlife Manage. 2006; 70(1):255–62.https:// doi.org/10.2193/0022-541x(2006)70[255:Eaaihe]2.0.Co;2
23. Hagihara R, Jones RE, Grech A, Lanyon JM, Sheppard JK, Marsh H. Improving population estimates by quantifying diving and surfacing patterns: a dugong example. Mar Mammal Sci. 2014; 30(1):348–66. https://doi.org/10.1111/mms.12041
24. Marsh H, O’Shea TJ, Reyholds JE III. Ecology and conservation of the sirenia. Cambridge: Cambridge University Press; 2011.
25. Wirsing AJ, Heithaus MR, Dill LM. Can you dig it? Use of excavation, a risky foraging tactic, by dugongs is sensitive to predation danger. Animal Behaviour. 2007; 74:1085–91.
26. Lee Long WJ, Coles RG, McKenzie LJ, editors. Deepwater seagrasses in northeastern Australia—how deep, how meaningful? Seagrass biology: Proceedings of an International Workshop, Rottnest Island, Western Australia, 25–29 January 1996; 1996; Perth, WA.
27. Andre J, Gyuris E, Lawler IR. Comparison of the diets of sympatric dugongs and green turtles on the Orman Reefs, Torres Strait, Australia. Wildlife Res. 2005; 32(1):53–62.https://doi.org/10.1071/ WR04015
28. Preen AR. Interactions between dugongs and seagrasses in a subtropical environment. Townsville: James Cook University; 1992.
29. Carter AB, Taylor HA, Rasheed MA. Torres Strait mapping: seagrass consolidation, 2002–2014. Centre for Tropical Water & Aquatic Ecosystem Research: James Cook University, Cairns, 2014.
30. Taylor HA, Rasheed MA. Deepwater seagrass dynamics in the Torres Strait Dugong Sanctuary. Cairns: Fisheries Queensland, 2011.
32. Sheppard JK, Preen AR, Marsh H, Lawler IR, Whiting SD, Jones RE. Movement heterogeneity of dugongs, Dugong dugon (Muller), over large spatial scales. J Exp Mar Biol Ecol. 2006; 334(1):64–83. https://doi.org/10.1016/j.jembe.2006.01.011
33. Zeh DR, Heupel MR, Limpus CJ, Hamann M, Fuentes MMPB, Babcock RC, et al. Is acoustic tracking appropriate for air-breathing marine animals? Dugongs as a case study. J Exp Mar Biol Ecol. 2015; 464:1–10.https://doi.org/10.1016/j.jembe.2014.11.013
34. Hodgson A. Dugong behaviour and responses to human influences. Townsville: James Cook Univer-sity; 2004.
35. Bouvet G, Ferraris J, Andrefouet S. Evaluation of large-scale unsupervised classification of New Cale-donia reef ecosystems using Landsat 7 ETM+ imagery. Oceanol Acta. 2003; 26(3):281–90.https://doi. org/10.1016/S0399-1784(03)00012-4
36. Hily C, Duchêne J, Bouchon C, Bouchon-Navaro Y, Gigou A, Payri C, et al. Les herbiers de phane´ro-games marines de l’outre-mer franc¸ais. Hily C, Gabrie´ C, Duncombe M, editors2010.
37. Garrigue C. Macrophyte associations on the soft bottoms of the south-west lagoon of New Caledonia: description, structure and biomass. Botanica Marina. 1995; 38:481–92.
38. Cleguer C. Informing dugong conservation at several spatial and temporal scales in New Caledonia. Townsville: James Cook University; 2015.
39. Marsh H, Rathbun GB. Development and application of conventional and satellite radio tracking tech-niques for studying dugong movements and habitat use. Aust Wildlife Res. 1990; 17(1):83–100.
40. Fuentes MMPB, Cleguer C, Liebsch N, Bedford G, Amber D, Hankin C, et al. Adapting dugong catching techniques to different cultural and environmental settings. Mar Mammal Sci. 2013; 29(1):159–66. https://doi.org/10.1111/j.1748-7692.2011.00531.x
41. Hagihara R, Jones RE, Sheppard JK, Hodgson AJ, Marsh H. Minimizing errors in the analysis of dive recordings from shallow-diving animals. J Exp Mar Biol Ecol. 2011; 399(2):173–81.https://doi.org/10. 1016/j.jembe.2011.01.001
42. Beaman RJ. Project 3DGBR: A high-resolution depth model for the Great Barrier Reef and Coral Sea. Cairns: James Cook University, 2010.
43. Garrigue C, Patenaude N, Marsh H. Distribution and abundance of the dugong in New Caledonia, southwest Pacific. Mar Mammal Sci. 2008; 24:81–90.
44. Marsh H, Sinclair DF. An experimental evaluation of dugong and sea turtle aerial survey techniques. Aust Wildlife Res. 1989; 16(6):639–50.
45. Hagihara R. Linking wildlife tracking data with environmental features to improve understanding of dugong diving ecology and population size estimates Townsville: James Cook University; 2015.
46. Marsh H, Grayson J, Grech A, Hagihara R, Sobtzick S. Re-evaluation of the sustainability of a marine mammal harvest by indigenous people using several lines of evidence. Biol Conserv. 2015; 192:324– 30.https://doi.org/10.1016/j.biocon.2015.10.007
47. Irvine AB. Manatee metabolism and its influence on distribution in Florida. Biol Conserv. 1983; 25 (4):315–34.
48. Elsner R. Living in water: Solutions to physiological problems. In: Reynolds JE III, Rommel SA, editors. Biology of marine mammals. Washington: Smithosonian Institute; 1999.
49. Reynolds JE, Wilcox JR. Distribution and abundance of the West Indian Manatee Trichechus manatus around selected Florida power plants following winter cold fronts 1984–85. Biol Conserv. 1986; 38 (2):103–13.https://doi.org/10.1016/0006-3207(86)90068-6