Int. J. Electrochem. Sci., 14 (2019) 5331 – 5343, doi: 10.20964/2019.06.22
International Journal of
ELECTROCHEMICAL
SCIENCE
www.electrochemsci.org
Effect of the Carbon Source on Facile Synthesized Si/Graphite
Composites and their Electrochemical Performance
Chan Liu1, Zhiqiang Gu1*, Zan Zhou1, Yuxi Chen1, Yuede He1, Xiaohong Xia1, Hongbo Liu1,2**
1 College of Materials Science and Engineering, Hunan University, Changsha, China
2 Hunan Province Key Laboratory for Advanced Carbon Materials and Applied Technology, Hunan
University, Changsha, Hunan, 410082, China
*E-mail: [email protected] (Zhiqiang Gu); [email protected] (Hongbo Liu);
Received: 7 February 2019 / Accepted: 20 March 2019 / Published: 10 May 2019
Silicon as the most promising candidate of anode for Li-ion batteries has high capacity (4200 mAh g−1), but the poor performance limits its practical application. In this paper, we explore the effects of different carbon sources on silicon/graphite composites. It is found that the sucrose as the carbon source can bind with the silicon particles and graphite well and form a continuous three-dimensional conductive network, resulting in improving the electrochemical properties of the materials. This silicon/graphite composites using sucrose as carbon source exhibit an excellent cyclic performance. The capacity retention is 88.5 % with a high capacity of 606 mAh g−1 after 50 cycles. Moreover, the effect of sucrose concentration on the electrochemical performance is investigated. When the additive amount of sucrose is 1.0 g, the materials can achieve the best electrochemical performance, which demonstrates that a suitable carbon layer is beneficial to the silicon/graphite composites.
Keywords: lithium-ion battery, Si/G composites, anode, carbon sources.
1. INTRODUCTION
discharge process (about 300%), which causes the fracturing, pulverization, and electrical isolation of silicon particles from the current collector [7]. Moreover, because of volume effect, the solid electrolyte interfaces (SEI) move back and forth between formation and destruction during the electrochemical process, which consume a lot of lithium ion, resulting in a lower coulombic efficiency and poor cyclic performance. Furthermore, the lower intrinsic electronic conductivity of Si impedes the transmission of electrons, which is bad for the electrochemical performance [8,9].
In order to solve the intrinsic defects of Si anode, a lot of researches have been expanded. Such as constructed different structure of the silicon including nanoparticles [10], nanowires [11], nanotubes [12], film and built the carbon/silicon composites [13,14,15], which attempt to accommodate the volume change and improve the conductivity. Among them, the graphite/silicon composites may be the best successful, and achieve a small amount of commercial applications [16]. Even so, the complicated synthesis of materials or expensive equipment, and the specific capacity of the graphite/silicon (Si/G) composites are not improved too much, so that it still cannot completely replace graphite [17]. Designing an applicable structure that can behave excellent electrochemical performance with a simple method and low-cost is still a challenge. In addition, the coating of G/Si composites is a generally tricky problem, and the research on different carbon source coated is rarely reported [6,18].
Herein, we precisely design and synthesis a Si/G@C structure by a simple water bath evaporation method. Effects of different common carbon sources on the bonding between silicon and graphite particles are explored, in order to make the graphite bond more firmly to the silicon, and obtain a complete surface coating carbon layer which can buffer the volume expansion of silicon particles during the lithiation process and provide efficient electronic and ion pathway, by using different carbon sources (the sucrose, citric acid and polyvinyl pyrrolidone (PVP)) to coat the Si/G composites. It is found that the citric acid and PVP cannot bond graphite and silicon very well. In contrast, when the sucrose as the carbon source the graphite and silicon particles can be bonded well, and the composites are uniformly coated with amorphous carbon as well as forming a three-dimensional carbon skeleton, which is advantageous to the electronic transmission. As a result, the composites of sucrose carbon-coated Si/G exhibits excellent cycle stability and rate-performance.
2. EXPERIMENTAL
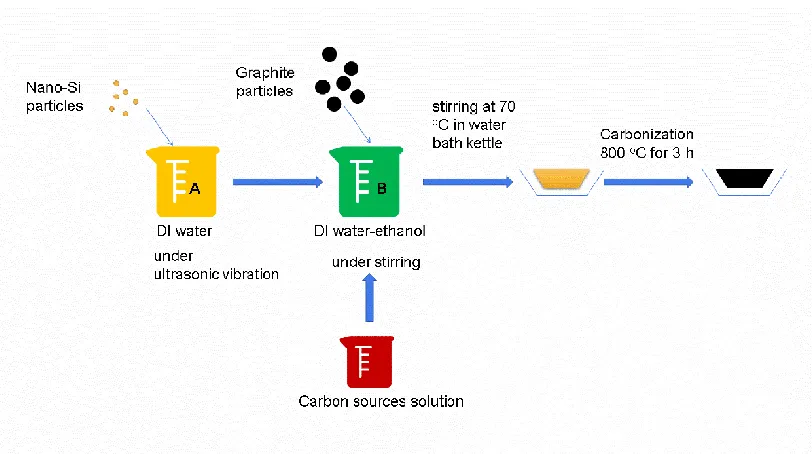
The experimental process is shown in Figure 1. Typically, a certain of nano-silicon particles were dispersed in DI water under ultrasonic vibration for 3 h to form a homogeneous suspension, marked it as suspension A. A little of natural graphite particles were dispersed in DI water-ethanol solution under stirring for 1 h, marked it as suspension B. Then, the suspension A was dropped into suspension B, followed by mechanical stirring for 1h. After that, carbon sources (sucrose or citric acid or PVP) solution was injected into the above system, under stirring for 3 h at 70 ℃ in water bath kettle, to evaporate the solvent and form slurry. The slurry above was poured into porcelain boat and dried overnight and then calcined at 800 ℃ for 3 h under N2 atmosphere at a heating rate of 2 ℃ min−1 to gain the Si/G@C
Figure 1. The schematic illustration of synthesis processes the composites
The morphology and microstructure were observed by scanning election microscope (SEM). X-ray diffraction pattern were record using an X-X-ray diffraction (XRD). Electrochemical properties were evaluated using typical CR2016 coin-type half cells. Electrodes were prepared by mixing active material, super P, and poly (vinylidene fluoride) (PVDF) binder with the mass ratio was 7:2:1 in N−methylpyrrolidone (NMP) to form a slurry. Then, pasted the slurry on a Cu foil and dried in a vacuum oven at 80 ℃ for overnight. The electrolyte was 1M LiPF6 dissolved in a mixture of ethylene carbonate
(EC), ethyl methyl carbonate (EMC), and diethyl carbonate (DEC) with volume ratio of 1:1:1, added 5% Fluoroethylene carbonate (FEC). The assembly of the cell was conducted in an Ar-filled glove box. The cycle life and rate performance of the cells were tested by a LAND battery testing system over a potential range of 0.01-3 V (vs Li/Li+) at room temperature. Cyclic voltammetry (CV, 0.1 mV s−1) plots and electrochemical impedance spectra (EIS,0.1 kHz to 100Hz) were carried out on an electrochemical work station (CHI660D).
3. RESULTS AND DISCUSSION
evaporation of the water bath process, afterwards, these small molecules may play an effective bonder of silicon and graphite particles, and fill the vacant between the Si and graphite, thereby form a complete carbon layer. However, the citric acid and PVP do not have the ability to hydrolyze into small molecules to make the graphite and silicon particles combined with each other during the current water bath condition. Trustingly, this continuous and smooth carbon layer can provide great convenience for the transmission of electronic, and improve the electrochemical performance, correspondingly [19,20].
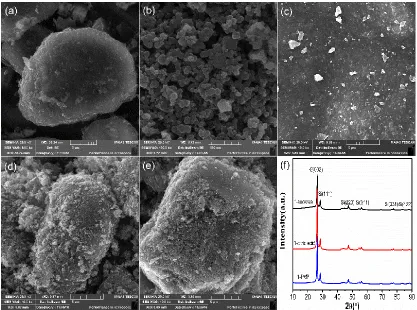
[image:4.596.90.507.318.628.2]The XRD patterns of synthesized composites of the sucrose, citric acid and PVP as carbon source coated on Si/G composites, respectively, are showed in Figure.2f. The distinct diffraction peaks at 28.2, 47.3, 56.1, 69.1, 77.5 and 88.6° correspond to (111), (220), (311), (400), (331) and (422) planes of Silicon (JCPDS no. 27-1402), and the sharp diffraction peaks at 26.04, correspond to the crystal planes of Graphite (002) [21]. The result of XRD patterns demonstrates that the three samples are composed of silicon and carbon, and no other peaks have been detected, implying the high pure properties of these samples.
Figure 2. The SEM images of graphite (a), nano silicon (b), sucrose Si/G (c), citric acid Si/G (d), PVP Si/G (e), and the XRD pattern dates of the samples, correspondingly.
[22]. But the samples coated with citric acid and PVP carbon can detect the characteristic peak of silicon, distinctly. This phenomenon echoes the above SEM images, suggesting that the sucrose as the carbon source can uniform coated the Si/G composites [23,24]. In contrast, there are some silicon are exposed on the surface of the materials when used the citric acid and PVP as the carbon sources [25].
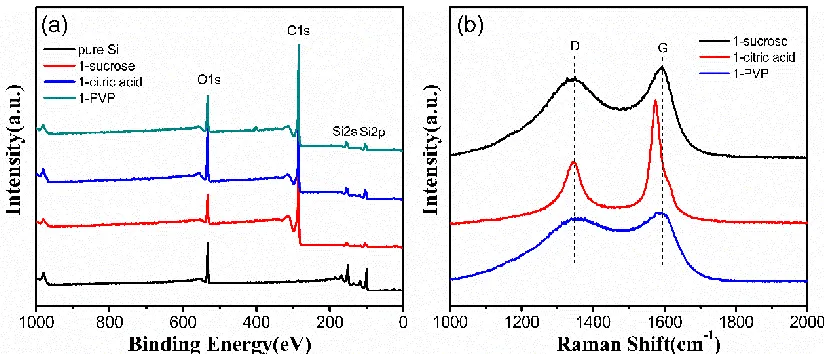
Figure 3b shows the Raman curves of samples (sucrose, citric acid and PVP as carbon source coated Si/G, respectively). The peaks of ID and IG correspond to the presence of carbon atoms with
dangling bonds (sp3-bonded carbon atoms, which are usually detected in disordered or amorphous
carbons) and the vibration of carbon atoms with sp2 hybridization in the graphite sheet structure of carbon material, respectively [14,26]. The ratio of ID and IG is reflected the graphitization degree of
carbon materials, and the ID/IG of the 1-sucrose, 1-citric acid and 1-PVP samples are 0.89, 0.53 and 0.92,
which shows the amorphous carbon formed by different carbon source have a diverse crystallinity at the same heat treatment step [11]. Carbon layer formed by citric acid and sucrose tend to graphitization, while carbon layer formed by PVP tends to the amorphous structure. It is well known that the amorphous carbon has more defects and flexibility, which can provide more active sites and buffer the silicon volume change during the electrochemical process [6], but the conductivity is insufficient. Due to the graphitized carbon possess more ordered structure, it is a good conductor of electrons, but not enough to buffer the volume expansion of silicon [27]. As discussed, the sucrose carbon may be the best choose for the Si/G composites, which can increase the electronic conductivity as well as accommodating the enormous volume change of silicon [28,29].
Figure 3. The XPS (a) and Raman (b) spectrum of sucrose, citric acid and PVP Si/G composites, respectively.
[image:5.596.92.504.408.585.2]
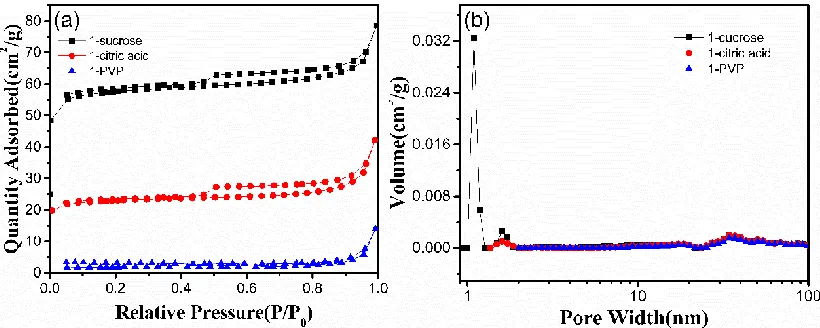
Figure 4. The N2 absorption and desorption curves of sucrose, citric acid, PVP Si/G and the
corresponding pore size distribution.
[image:6.596.94.504.86.250.2]
important, the presence of graphite can enhance the stability of the composites structure, effectively avoid collapse of the materials, as a result the electrode shows an excellent cycle stability [37].
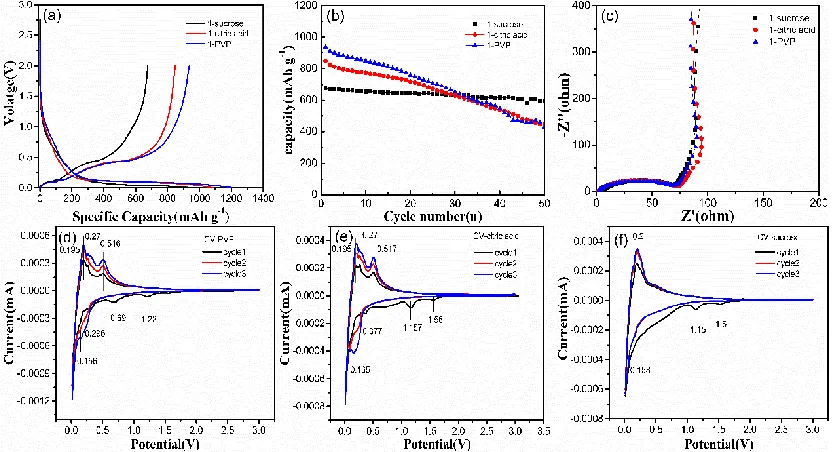
The effect of the different carbon sources coated on the ultimate electrochemical performance of the Si/G composites electrode can be also clarified by analyzing the electrochemical impedance spectroscopy (EIS), as show in the figure 5c. Clearly, each curve consists of a semicircle in the high-medium frequency is region attributed to the charge transfer (Rct) [38] and a linear tail in the low
frequency region ascribed to the solid-state diffusion of lithium into the bulk of electrode material, respectively. The fitted Rct value of the sucrose Si/G, citric acid Si/G and PVP Si/G are 32.5, 34 and 35 Ω, respectively, which indicates that the three carbon sources have little effect on the conductivity of Si, but the coating effects of carbon greatly improves the conductivity of silicon [39].
Figure 5. Electrochemical performance: The charge and discharge voltage profiles for the first cycle (a), the cycling performance (b), Nyquist plots for the initial (c), and the CV curves of the PVP (d), citric acid (e), sucrose (f) respectively.
Table 1. The reversible capacity of some similar anode materials.
Carbon source Reversible capacity (mAh/g)
Current density (mA/g)
Preparation method Reference
PVP, glucose 587 200 Dry ball milling [31]
Coal tar pitch 602.4 100 Two heating procedure [32]
Citric acid, pitch 723.8 100 Spay drying [33]
Acetylene 520.7 0.2C CVD [34]
Silane gas 517 0.5C CVD [35]
Sucrose 676 50 Water bath evaporation This work
[image:8.596.91.508.72.298.2]
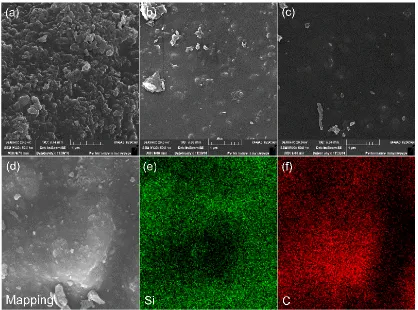
The individual elemental mapping of 1.0-sucrose result is shown in Figure 6d, e and f. From the elemental mapping analysis, it is found that the silicon and carbon are evenly distributed on the surface of the material, and silicon fit snugly around the graphite. Assuredly, the interesting structure with the three-dimensional conductive skeleton greatly contribute to the rapid transmission of electrons and ions, and enhancing the electrochemical properties [45].
Figure 6. The SEM images of the different sucrose addition of the Si/G composites, 0.5-sucrose (a), 1.0-sucrose (b), 1.5-1.0-sucrose (c), and the mapping images of 1.0-1.0-sucrose (d), (e), (f).
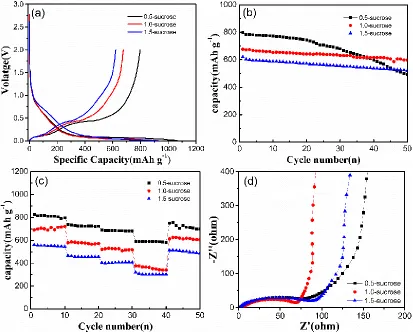
Figure 7a illustrates the charge and discharge profiles of sucrose Si/G composites for the first cycles at a current density of 50 mA g−1 with the voltage ranging from 0.01 to 2 V. The first discharge/charge capacity of the 0.5-sucrose, 1.0-sucrose and 1.5-sucrose composite electrodes is 1081.8/796, 948.1/676.3 and 940/621.4 mAh g−1 with an initial coulombic efficiency of 73.6, 71.3, and 66.1%, respectively. Obviously, the initial coulombic efficiency of the 0.5-sucrose, 1.0-sucrose and the 1.5-sucrose electrodes are decreased gradually. Due to the amorphous carbon increased, much disordered structures and defects are introduced, they consume a lot of lithium ions during the initial electrochemical process, which resulting in a decline in the initial coulombic efficiency [46].
[image:9.596.90.508.171.481.2]
coated carbon, lithium ion can easy to enter the silicon, but with the deepening of lithium intercalation, the carbon layer is too thin to buffer the strong mechanical stress. Caused by the volume expansion of silicon, the silicon particles gradually fall off the surface of the graphite, thus the materials exhibiting an unsatisfactory cycle performance [5]. The capacity of 1.0-sucrose composite electrodes remains 598.3 mAh g−1 after 50 cycles, and the capacity retention was 88.5 %. Because the coated carbon layer thickness is appropriate, which can not only increase the electrical conductivity of the material, but also provide lithium ion transport pathway [19]. The suitable coating thickness can effectively alleviate the volume expansion of silicon. As to the 1.5-sucrose composite, abundant of amorphous is bound to cause many defects, the defects may change the lithium insertion mechanism of the material, with the number of lithium insertions increases, these defects may cause the pore structure of the material to collapse, leading to the decrease in cyclic performance [47].
Figure 7. The electrochemical properties of the different sucrose addition samples: Charge and discharge voltage profiles for the first cycle (a), Cycling performance (b), Rate performance (c), and the Nyquist plots of the 0.5, 1.0, 1.5-sucrose, respectively.
[image:10.596.93.506.293.625.2]
sucrose and 1.5-sucrose, restored to its original capacity, immediately, and remains stable in the subsequence cycles, which further verified that the importance of a suitable carbon coating for Si/G composites [11].
The Nyquist plots of the different concentration of sucrose samples also shows in the Figure 7d, which compose of a semicircle where a high-frequency semicircle and a medium-frequency semicircle overlap each other, and an inclined tail at low frequency. The high-frequency semicircle can be attributed to SEI resistance, and the medium-frequency semicircle is correlated to the charge-transfer resistance. The charge-transfer resistance of the 0.5-sucrose, 1.0-sucrose and 1.5-sucrose sample is 55, 38, 46 Ω, separately. This can be interpreted that the carbon layer is too thin, the surface of graphite or silica particles was enshrouded incomplete, leading to the electrical conductivity of the material is not good. While, when the carbon layer is too thick, although the particulate was enshrouded completely, while the thickness of the carbon layer, the electronic transmission way gets longer, the conductivity of the material also can be affected [41]. Therefore, the 1.0-sucrose sample has the suitable carbon layer thickness, result in the least charge-transfer resistance.
4. CONCLUSION
In short, we have compared the structure and electrochemical performance of the three different carbon sources (sucrose, citric acid and Polyvinyl Pyrrolidone)-coated silicon and graphite particles. It is found that the hydrolysis of sucrose can generate such micromolecule, which may be advantageous to the bonding between graphite and silicon particles to form a complete and uniform carbon layer, but citric acid and PVP do not have this ability. At the same time, there are lots of microspores on the carbon layer surface, which conducive to the rapid diffusion of lithium ions. More importantly, the surface of carbon layer is smooth, without adhering of bare silica particles, suggesting the Si/G composites can be uniform coated by the sucrose. Hence, the electrode of the sucrose as carbon precursors sample has a higher reversible capacity (676 mAh g−1) and good cycle performance. Additionally, the coating carbon layer promote the formation of a stable SEI layer on the composites surface, which is the critical factor for the long cycle life as well as the high coulombic efficiency. In addition, we have also studied the coating effect of different concentration of sucrose solution. The suitable concentration of sucrose solution during preparation process of electrode is beneficial to the high irreversible capacity and excellent cycle stability.
ACKNOWLEDGEMENTS
This work was supported by National Natural Science Foundation of China (51772083, 51472083 and 51402101), Hunan Provincial Natural Science Foundation of China (14JJ3059 and 2017JJ2008), Growth Scheme for Young Teachers of Hunan University (No. 531107040185), and Key R & D projects of Hunan Province (2016GK2036).
References
2. H. Zhao, Y. Wei, C. Wang, R. Qiao, W. Yang, P.B. Messersmith and G. Liu, ACS Appl. Mater. Interfaces, 10 (2018) 5440.
3. T. Zhang, J. Yang, J. Zhu, J. Zhou, Z. Xu, J. Wang, F. Qiu and P. He, Chem. Commun., 54 (2018) 1069.
4. Y. Yao, J. Zhang, L. Xue, T. Huang and A. Yu, J. Power Sources, 196 (2011) 10240. 5. Q. Xu, J.-K. Sun, Y.-X. Yin and Y.-G. Guo, Adv. Funct. Mater., 28 (2018) 1705235.
6. K. Mishra, J. Zheng, R. Patel, L. Estevez, H. Jia, L. Luo, P.Z. El-Khoury, X. Li, X.-D. Zhou and J.-G. Zhang, Electrochim. Acta, 269 (2018) 509.
7. A.R. Park, D.Y. Son, J.S. Kim, J.Y. Lee, N.G. Park, J. Park, J.K. Lee and P.J. Yoo, ACS Appl. Mater. Interfaces, 7 (2015) 18483.
8. J. Meng, Y. Cao, Y. Suo, Y. Liu, J. Zhang and X. Zheng, Electrochim. Acta, 176 (2015) 1001. 9. H. Ge, T. Hao, H. Osgood, B. Zhang, L. Chen, L. Cui, X.M. Song, O. Ogoke and G. Wu, ACS
Appl. Mater. Interfaces, 8 (2016) 9162.
10.K. Feng, M. Li, W. Liu, A.G. Kashkooli, X. Xiao, M. Cai and Z. Chen, Small, 14 (2018). 11.W. Zhai, Q. Ai, L. Chen, S. Wei, D. Li, L. Zhang, P. Si, J. Feng and L. Ci, Nano Research, 10
(2017) 4274.
12.M. Guo, X. Zhang, Z. Bai, J. Ye, W. Meng, H. Song and Z. Wang, Int. J. Hydrogen Energy, 42 (2017) 15290.
13.R. Yang, Int J Electrochem Sci., 12(2017)7877
14.Z. Gu, X. Xia, C. Liu, X. Hu, Y. Chen, Z. Wang and H. Liu, J. Alloys Compd., 757 (2018) 265. 15.T. Yang, X. Tian, X. Li, K. Wang, Z. Liu, Q. Guo and Y. Song, Chemistry, 23 (2017) 2165. 16.H. Jo, J. Kim, D.-T. Nguyen, K.K. Kang, D.-M. Jeon, A.R. Yang and S.-W. Song, J. Phys. Chem.
C, 120 (2016) 22466.
17.A. Marzouk, P.B. Balbuena and F. El-Mellouhi, Electrochim. Acta, 207 (2016) 301.
18.Y. Xu, E. Swaans, S. Chen, S. Basak, P.P. R. M. L. Harks, B. Peng, H.W. Zandbergen, D.M. Borsa and F.M. Mulder, Nano Energy, 38 (2017) 1702737.
19.Y. Xing, T. Shen, T. Guo, X. Wang, X. Xia, C. Gu and J. Tu, J. Power Sources, 384 (2018) 207. 20.H. Zhao, N. Yuca, Z. Zheng, Y. Fu, V.S. Battaglia, G. Abdelbast, K. Zaghib and G. Liu, ACS Appl.
Mater. Interfaces, 7 (2015) 862.
21.L. Wang, Z. Liu, Q. Guo, G. Wang, J. Yang, P. Li, X. Wang and L. Liu, Electrochim. Acta, 199 (2016) 204.
22.J. Zhou, T. Qian, M. Wang, N. Xu, Q. Zhang, Q. Li and C. Yan, ACS Appl. Mater. Interfaces, 8 (2016) 5358.
23.D. Zhou, R. Liu, Y.-B. He, F. Li, M. Liu, B. Li, Q.-H. Yang, Q. Cai and F. Kang, Adv. Energy Mater., 6 (2016) 1502214.
24.N. Lin, T. Xu, T. Li, Y. Han and Y. Qian, ACS Appl. Mater. Interfaces, 9 (2017) 39318. 25.W. Shi, J. Chen, Q. Yang, S. Wang and C. Xiong, J. Phys. Chem. C, 120 (2016) 13807.
26.H. Mi, F. Li, C. He, X. Chai, Q. Zhang, C. Li, Y. Li and J. Liu, Electrochim. Acta, 190 (2016) 1032. 27.L. Zhong, T. Kwok and L. Mangolini, Electrochem. Commun., 53 (2015) 1.
28.X. Yu, H. Yang, H. Meng, Y. Sun, J. Zheng, D. Ma and X. Xu, ACS Appl. Mater. Interfaces, 7 (2015) 15961.
29.N. Toyama, T. Umegaki and Y. Kojima, Int. J. Hydrogen Energy, 40 (2015) 6151. 30.H. Tian, X. Tan, F. Xin, C. Wang and W. Han, Nano Energy, 11 (2015) 490. 31.H. Wang, J. Xie, S. Zhang, G. Cao and X. Zhao, RSC Adv., 6 (2016) 69882.
32.M. Ashuri, Q. He, Y. Liu, S. Emani and L.L. Shaw, Electrochim. Acta, 258 (2017) 274.
33.M. Li, X. Hou, Y. Sha, J. Wang, S. Hu, X. Liu and Z. Shao, J. Power Sources, 248 (2014) 721. 34.Z. Yi, W. Wang, Y. Qian, X. Liu, N. Lin and Y. Qian, ACS Sustainable Chem. Eng., 6 (2018) 14230. 35.M. Ko, S. Chae, J. Ma, N. Kim, H.-W. Lee, Y. Cui and J. Cho, Nature Energy, 8 (2016)16113. 36.Q. Hua, D. Dai, C. Zhang, F. Han, T. Lv, X. Li, S. Wang, R. Zhu, H. Liao and S. Zhang, Nanoscale
37.S. Huang, L. Zhang, L. Liu, L. Liu, J. Li, H. Hu, J. Wang, F. Ding and O.G. Schmidt, Energy Storage Mater., 12 (2018) 23.
38.Y. Zhang, Y. Pan, Y. Chen, B.L. Lucht and A. Bose, Carbon, 112 (2017) 72. 39.Z. Li, Z. Li, L. Li, W. Zhong and H. Zhang, J. Alloys Compd., 701 (2017) 487.
40.Y. Jin, S. Li, A. Kushima, X. Zheng, Y. Sun, J. Xie, J. Sun, W. Xue, G. Zhou, J. Wu, F. Shi, R. Zhang, Z. Zhu, K. So, Y. Cui and J. Li, Energy Environ. Sci., 10 (2017) 580.
41.J. Qin, M. Wu, T. Feng, C. Chen, C. Tu, X. Li, C. Duan, D. Xia and D. Wang, Electrochim. Acta, 256 (2017) 259.
42.B. Gattu, R. Epur, P.H. Jampani, R. Kuruba, M.K. Datta and P.N. Kumta, J. Phys. Chem. C, 121 (2017) 9662.
43.W. An, J. Fu, J. Su, L. Wang, X. Peng, K. Wu, Q. Chen, Y. Bi, B. Gao and X. Zhang, J. Power Sources, 345 (2017) 227.
44.G. Hou, B. Cheng, Y. Cao, M. Yao, B. Li, C. Zhang, Q. Weng, X. Wang, Y. Bando, D. Golberg and F. Yuan, Nano Energy, 24 (2016) 111.
45.P. Wei, M. Fan, H. Chen, D. Chen, C. Li, K. Shu and C. Lv, Int. J. Hydrogen Energy, 41 (2016) 1819.
46.T. Zhao, S. She, X. Ji, X. Guo, W. Jin, R. Zhu, A. Dang, H. Li, T. Li and B. Wei, Sci. Rep., 6 (2016) 33833.
47.D. Kowalski, J. Mallet, S. Thomas, A.W. Nemaga, J. Michel and C. Guery, M. Molinari, M. Morcrette, J. Power Sources, 361 (2017) 243.