promoting access to White Rose research papers
White Rose Research Online
Universities of Leeds, Sheffield and York
http://eprints.whiterose.ac.uk/
This is an author produced version of a paper published in
LEUKOS: The
Journal of the Illuminating Engineering Society of North America
.
White Rose Research Online URL for this paper:
http://eprints.whiterose.ac.uk/77013
Published paper
Counterbalancing Needed to Avoid Bias in Side-By-Side Brightness
Matching Tasks
SA Fotios1PhD, BEng, CEng, MEI, MSLL, MILE KW Houser2 PhD, PE, LC, LEED, AP
C Cheal1PhD, MSc, BSc
1 School of Architecture, University of Sheffield, UK
2 Department of Architectural Engineering, The Pennsylvania State University, USA
Fotios SA, Houser KW, & Cheal C, Counterbalancing needed to avoid bias in side-by-side brightness matching tasks, Leukos, 2008; 4(4); 207-223
Abstract
Spectral power distribution (SPD) is one of the variables that can be manipulated in
lighting design. This article examines twenty previous studies which have
investigated the effect of SPD on brightness using the side-by-side matching
technique. Three sources of experimental bias are identified and are shown to be
present in the majority of these studies, and hence must be considered to provide an
unreliable estimate of the magnitude of the SPD effect on brightness. The first bias
is associated with test participants’ use of dimming control and two forms are
apparent – a response contraction bias when the test is repeated at multiple
reference illuminances and a conservative bias when the test is carried out at a
single reference illuminance. The second bias is associated with the primary
direction in which dimming must take place and the third bias is associated with the
1 Introduction
There is a renewed attempt to investigate SPD effects within the lighting community.
IESNA has established committee RO17 to investigate effects of lamp spectral
distribution and there were articles from five research groups at the 26th Session of
the CIE in Beijing, 2007. This article presents evidence to aid in the identification of
experimental procedures expected to produce reliable data.
This article presents a critical analysis of past research on the effect of spectral
power distribution (SPD) on the perception on brightness. More specifically, our
analysis focuses on studies that used side-by-side matching as the principal
experimental methodology. In side-by-side matching, participants are presented with
two adjacent stimuli and instructed to adjust the illuminance of one until both appear
equal according to a prescribed criterion. At the point of subjective equality (PSE) the
stimulus magnitudes are recorded, in units of either illuminance or luminance, and
the ratio is used to quantify the visual effect. A variety of visual equality criteria have
been used in previous matching studies, including equal brightness, equal
appearance, and equal clarity, but there appears to be little effect on the PSE (Fotios
& Gado 2005) and hence this article is phrased in terms of brightness.
At photopic levels twelve studies have used stimuli of large size, such as illuminated
rooms or booths (Aston & Bellchambers 1969; Bellchambers & Godby 1972; Boyce
1977; Fotios & Levermore 1995, 1997; Hu, Houser & Tiller 2006†; Lemons &
Robinson 1976; Levermore 1994; Thornton, Chen, Morton & Rachko 1980; Thornton
& Chen 1978; Worthey 1985; Zheleznikova & Myasoedova 1995) and six studies
have used stimuli of small size, such as light patches subtending a visual arc of up to
ten degrees at the eye (Alman 1977; Alman, Breton & Barbour 1983; Booker 1978;
Harrington 1954; Hashimoto & Nayatani 1994; Houser & Hu 2004). Two studies have
been carried out at mesopic levels typical of street lighting at night time (Fotios &
Cheal 2007a; Randhawa 1997). While the list is not assumed to be exhaustive, it
does extend those presented in a recent review of the subject (Fotios 2001a). The
authors in all 20 studies reported that light source SPD had significant affect upon the
illuminance ratio at equal brightness, and thus this collection appears to be a strong
body of evidence. However, as will be shown, it is prudent to filter this body of work
by considering the quality of the experiments, and to re-evaluate the confidence that
can be placed in the conclusions for each of these studies.
†
The assessment of brightness is a psychophysical scaling task that requires the test
participant to make sensory responses to stimuli. These assessment tasks can
usually be allocated into one of three types [Gescheider 1988; Poulton 1989]:
(i) Discrimination: the participant is required to make simple ordinal
discrimination judgements of stimuli.
(ii) Adjustment: the participant is required to adjust stimuli toward a given
sensation. This group includes the side-by-side matching task.
(iii) Category Rating: the participant is required to assign numbers to stimuli that
represent the sensation magnitude.
Poulton places matching and discrimination tasks joint first in his order of preference
because they suffer from fewer source of bias than does category rating (Poulton
1989). Although matching is preferable to other psychophysical methods, it is
nonetheless imperfect. Brightness is a highly subjective perception that has
unfamiliar units, and this can lead to bias (Poulton 1989).
Bias is a change in the value of a psychophysically defined entity such as a PSE that
accompanies a change in task variables or in the set of test stimuli used: it can be
due to either sensory variables such as light/dark, chromatic or contrast adaptation,
to decision variables such as shifts in the subject’s psychophysical criterion, or to a
combination of both (Teller, Pereverzeva & Civan 2003). If bias changes the PSE
then there will be a distortion in the magnitude of the effect under study. For
example, if the methodology used to determine the illuminance ratio at equal
brightness is biased, then the magnitude of lamp SPD effects will be misstated.
This article presents evidence for three biases within the side-by-side brightness
matching task. The first is a response contraction bias associated with the application
of dimming‡ to the observed stimuli. The second bias is associated with the primary
direction in which dimming must take place. The third bias is associated with the
relative position of the stimuli within the apparatus. Hence three stages of
counterbalancing are required to remove the effect of biases from the experimental
results, these being application of dimming control to both stimuli in a pair, that the
initial illuminance of the variable source starts at both higher and lower levels than
the reference, and that the stimuli occupy the two available locations (e.g. left and
‡
right). Complete counterbalancing within subjects thus demands eight trials per pair
of stimuli.
This article suggests that 10 of the 20 previous studies (Alman 1977; Alman, Breton
& Barbour 1983; Aston & Bellchambers 1969; Bellchambers & Godby 1972; Booker
1978; Hashimoto & Nayatani 1994; Houser & Hu 2004; Randhawa 1997; Worthey
1985; Zheleznikova & Myasoedova 1995) contain bias which has not been countered
and thus do not provide reliable evidence of the magnitude of the SPD effect on
brightness; four studies present insufficient data to know whether bias has been
countered (Harrington 1954; Lemons & Robinson 1976; Levermore 1994; Thornton
Chen Morton & Rachko 1980). This is a critical finding because some of these
studies (e.g. Alman 1977; Aston & Bellchambers 1969; Bellchambers & Godby 1972)
are extensively referenced in the literature. Thus the ‘strong body of evidence’ is
reduced to only six studies which provide reliable evidence of the magnitude (in
illuminance units) of the SPD effect on brightness in the side-by-side matching task
(Boyce 1977; Fotios & Levermore 1995, 1997; Fotios & Cheal 2007a; Hu Houser &
Tiller 2006; Thornton & Chen 1978). Whilst this article is directed toward comparing
lighting of different SPD, the findings are applicable to psychophysical tests
employed to investigate other attributes of lighting.
2 Application of Dimming
In the typical matching task, the observer is given dimming control over one of the
two stimuli. Findings from previous studies demonstrate that if the dimming
mechanism is not applied with equal frequencies to both of the stimuli then there will
be bias in the results. Two different biases have been found, a response contraction
bias if the task is carried out at a range of reference illuminances, and a conservative
bias if the task is carried out at a single reference illuminance (Fotios & Cheal 2007b;
Fotios 2001b).
2.1 Response contraction bias
If the visual match is made at several different reference illuminances, a response
contraction toward the center of the range of stimulus magnitudes is expected (Fotios
& Cheal 2007b). Following Poulton (Poulton 1989) this is labeled a response
contraction bias, as the range of responses tends to converge toward the center of
the stimulus range, but it may alternatively be considered a sequential effect because
previous stimuli apparently become an additional reference magnitude against which
A response contraction is commonly found in psychophysical magnitude estimation
tasks – a natural tendency to shift the sensation in memory toward the middle of a
scale of intensities; participants performing estimation tasks are not certain about the
true values of the stimuli and therefore keep their estimates well within the
boundaries (or ranges) of stimulus values (Jou et al 2004). It would be expected, for
example, when estimating the brightness of a single stimulus presented at a range of
luminances. The brightness of the low luminance stimuli will be overestimated whilst
brightness of the high luminance stimuli will be underestimated. It was not expected
in side-by-side comparisons where the reference and variable stimuli are
simultaneously visible, for example it is not listed as an expected bias in Poulton
(Poulton 1989, Table 3.4, p61). Consider a reference stimulus that is set to three
illuminances for successive tests, e.g. 300, 400, and 500 lux. Matches made to the
300 lux reference will be biased upwards toward 400 lux, matches made to the 500
lux reference will be biased downwards toward 400 lux, and matches made at the
middle reference illuminance will not be significantly biased.
Evidence for a response contraction bias in the side-by-side visual matching task
was initially found in post-hoc analysis of null condition data and was then confirmed
in the between-lamps data (Fotios & Cheal 2007b). The null condition tests used 18
color-normal participants, each making eight brightness matches between two
side-by-side booths at each of three reference illuminances (2.0, 7.5, and 15.0 lux) . The
eight trials were carried out in anticipation of bias to enable complete
counterbalancing of stimulus position (left and right booth), dimming application (to
both of the stimuli) and the direction of dimming (initial illuminance of variable source
either higher or lower than illuminance of reference source). Identical lamps were
used in each booth.
The null condition data (Table 1) is presented as the ratio of the illuminances of the
variable and reference stimuli. A mean illuminance ratio of unity would suggest no
significant bias, and this was found at the middle of the three reference illuminances.
At the lower reference illuminance, the illuminance ratio is significantly greater than
unity, indicating the variable source tended to be set to a higher illuminance than the
reference – a bias toward the middle of the reference illuminance range. At the
higher reference illuminance, the illuminance ratio is significantly smaller than unity,
indicating the variable source tended to be set to a lower illuminance than the
this were an apparatus based bias, such as a positional bias (see below) the
direction of this error would be the same at all three reference illuminances – that it
isn’t suggests it is caused by the range of reference illuminances. The direction of
the error is toward the middle of the range of reference stimulus magnitudes, and
hence was identified as a response contraction bias.
[Table 1]
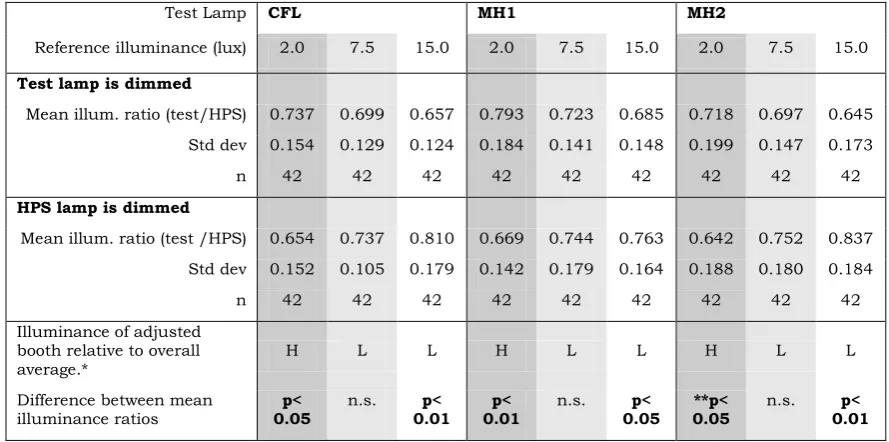
The results of Fotios & Cheal’s (Fotios & Cheal 2007a) between-lamps tests (Table
2) also suggested a response contraction bias. In these tests, three different light
sources (CFL, MH1, MH2) were matched with a single reference source (HPS). This
was carried out by 21 color-normal participants, each making four trials for each of
three reference illuminances (2.0, 7.5, and 15.0 lux) and the three lamp pairs. The
four trials were used to counterbalance dimming application and initial illuminance of
the variable stimulus – stimulus position was balanced between subjects as the null
condition tests suggested negligible bias between the left and right-hand sides. In
Table 2 the results are broken down according to the application of dimming. It can
be seen that at the lower reference illuminance, the illuminance of the variable
stimulus is biased toward a higher level, whilst at the higher reference illuminance the
illuminance of the variable stimulus is biased toward a lower level – a contraction of
the response range. These differences are significant according to the t-test.
[Table 2]
The effect of a response contraction bias is small but statistically significant, and
sufficient to affect whether a hypothesis of equality is accepted or rejected (Fotios &
Cheal 2007b). Fotios & Cheal used their null condition data as a correction factor to
the main results: that this correction did not significantly change the mean results
suggests that applying the dimming control with equal frequency to the two stimuli
was successful in countering the bias.
Fotios & Cheal suggested that where a number of different reference illuminances
are used, the range appears to become apparent to the observer, as does the
approximate center of the range of responses, and this becomes a secondary
reference toward which responses are biased (Fotios & Cheal 2007b). This is
compute some summary statistic about the stimuli, such as a measure of central
tendency, and this is used as a basis for modifying responses.
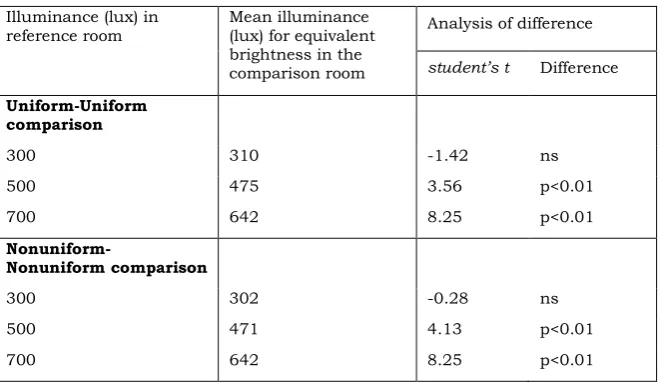
A response contraction bias can also be seen in the null condition data of Tiller &
Veitch (Tiller & Veitch 1995). This study used side-by-side brightness matching to
compare lighting of identical SPD but different spatial distribution (uniform and
non-uniform) at three different reference illuminances, 300 lux, 500 lux and 700 lux. In the
null condition trials, rooms of identical SPD and spatial distribution were matched.
The results are shown in Table 3. Tiller & Veitch report the mean illuminance
required to match the reference interior. At the lower reference illuminance (300 lux)
the mean illuminance of the adjusted lighting is slightly higher than the reference,
whereas at the higher reference illuminances (500 lux and 700 lux) the mean
illuminances of the adjusted lighting are lower than the references.
To analyze whether the differences are significant requires variance data. The
standard error of the mean (SEM) can be estimated at ± 7 lux from graphical
illustration of the results (Figure 2 in Tiller & Veitch). Standard deviation (σ) can then
be found using σ = SEM.N1/2 (Field 2005). Each condition (luminance distribution and
illuminance) has a sample of size n=120 (30 test participants x 4 trials), which gives a
standard deviation of σ=77 lux. The t-test is applied to determine whether the mean
illuminance of the comparison room is the same as the nominal illuminance of the
reference room; the difference is significant at 500 and 700 lux (p<0.01) but not at
300 lux.
[Table 3]
Whilst no additional studies have been found which can provide further clarification of
response contraction bias in side-by-side matching tasks carried out at multiple
stimulus magnitudes, the results from two previous studies (Teller, Pereverzeva &
Civan 2003; Jou et al 2004) provide further demonstration that using multiple
stimulus ranges will bias participant behavior.
Teller, Pereverzeva & Civan sought brightness judgments of red and blue targets
(subtending two degrees visual arc) presented on a white monitor screen (Teller,
Pereverzeva & Civan 2003). For each color, a range of targets varying in luminance
brighter or dimmer than the surround. Three ranges of target luminance were used
in successive trials – for the red target these ranges had midpoint values of 0.6,
-0.3 and 0.1 log luminance relative to the white surround. Typically 11 target stimuli
were used in each range, increasing in steps of 0.05 log units. Seven test
participants were used, each making 20 judgments of relative brightness per
condition. It was found that a stimulus judged brighter than the surround on 100% of
trials with the target range of low mid-point luminance was judged dimmer than the
surround on 100% of trials with a high mid-point range of luminances. Thus, the
stimulus range affected the brightness judgment, despite their being no change in the
reference stimulus. For the red target, a change in mid-point luminance of 0.7 log
units (-0.6 to 0.1 log luminance relative to white surround) caused a mean PSE shift
of 0.4 log units. For the blue target, a change in mid-point luminance of 0.8 log units
(-0.9 to -0.1 log luminance relative to white surround) caused a mean PSE shift of 0.6
log units. These findings were subsequently repeated by Pereverzeva & Teller
(Pereverzeva & Teller, 2005) who also adapted the test procedure in order to identify
the underlying mechanisms.
In the study of Jou et al (Jou et al, 2004) participants estimated alphabetic interval
distances between two letters for different levels of inter-letter distances. From all
possible letter pairs in the alphabet there are 325 distinct pairs. These were used in
three groups; low, having 1 to 13 inter-letter distances between letter pairs; middle,
having 9 to 21 inter-letter distances; and high, having 14 to 25 inter-letter distances.
In trials, letter pairs from within one of these groups were presented to observers
whose task was to estimate the distance between the letters without counting. The
results reveal a systematic distortion in the form of a centering bias within all three
separate groups, with inter-letter distances at the lower end of the range being
overestimated and inter-letter distances at the higher end of the range being
underestimated.
The range of inter-letter distances caused a difference in estimates of inter-letter
distance as can be seen by comparing inter-letter distances common to two ranges.
Inter-letter distances of 9 to 13 were common to the low and middle range groups; in
the low group these inter-letter distances are under-estimated and in the middle
group they are over-estimated. Inter-letter distances of 14 and 15 were common to
the middle and high range groups; in the middle group these inter-letter distances are
2.2 Conservative adjustment bias
A second potential bias associated with the application of dimming occurs when
side-by-side matching tests are carried out at only one reference illuminance. This was
previously reported by Fotios (Fotios, 2001b) who found from analysis of null
condition data that the stimulus over which participants have dimming control is set to
an illuminance below that of the reference stimulus. The bias is also evident in more
recent experimental data (Fotios & Gado, 2005; Houser & Hu, 2004). This may be
considered to be a conservative bias, reflecting the general conservative tendency
that is found in all quantitative judgments (Poulton, 1989). Although LaBoeuf &
Shafir might argue against such an explanation because participants were able to
adjust up and down, repeatedly, and with impunity (LaBoeuf & Shafir, 2006) the
effect is clearly evident in experimental results. As with the response contraction
bias the effect is small but statistically significant. A mean illuminance ratio
(constant/variable) of 1.098 was determined from the results of 80 null condition trials
(Fotios & Gado, 2005), similar to that reported previously (1.058) by Fotios (Fotios,
2001b).
Houser, Tiller & Hu (Houser, Tiller & Hu, 2003) carried out brightness matching using
side-by-side rooms at one reference illuminance (300 lux) and their null condition
data exhibits a bias with the application of dimming. Null condition trials using
identical lamps in both rooms were carried out by 32 observers, each providing two
responses under the same conditions. The mean illuminance ratio at equal
brightness (fixed/variable) is 0.877 (std dev = 0.083, n=63) which shows that on
average the variable stimulus was set to a higher illuminance than the fixed
reference. This is a significant departure from unity (p<0.01, t-test). However, this
effect is in the opposite direction to that reported by Fotios (Fotios, 2001b) and Fotios
& Gado (Fotios & Gado, 2005). This difference may be because their null condition
trials were confounded by simultaneous positional bias (the lamp to which dimming
was applied was always in the left-hand room) and directional bias (the variable
stimulus always demanded dimming up from the start level of 150 lux toward the
comparison level of 300 lux). Results of the between-lamps tests carried out by
Houser, Tiller & Hu suggest a similar trend, that on average the variable lamp was
set to a slightly higher illuminance than the fixed lamp, but this is not a significant
difference.
There is evidence to suspect significant bias in the act of dimming the illuminance of
a visual stimulus during a side-by-side matching task. If dimming is applied to only
one of a pair of matched stimuli, this can significantly affect the PSE. The bias can
be countered by applying dimming to both stimuli in the pair for an equal number of
trials.
There are variants in the type of dimming and the method used to apply dimming.
Fotios & Levermore (Fotios & Levermore, 1997) used electronic dimming applied to
fluorescent lamps and this was operated directly by the test participants. Electronic
dimming can affect lamp SPD and hence Fotios & Cheal (Fotios & Cheal, 2007a)
used a mechanical dimming device, an iris in the light transport tube, to control light
from high intensity discharge lamps, and this was controlled directly by the
participants. Gescheider suggested a shortcoming of the adjustment method results
from giving the observer control of the stimulus, as this makes it difficult to maintain
constant conditions during threshold measurement (Gescheider, 1997). Hence
Houser, Tiller & Hu (Houser, Tiller & Hu, 2003) used electronic dimming of
fluorescent lamps, but this was done by the experimenter and test participants
instructed the experimenter to adjust the lighting by saying “higher” or “lower” for the
variable room (the other room being fixed). Further analysis is needed of the effects
of different methods of dimming control.
3 Initial Illuminance of Variable Stimulus
In the side-by-side matching task, the stimulus to which dimming is applied can be
set by the experimenter to an initial illuminance either higher or lower than that of the
reference stimulus. The observer’s task is thus either to primarily increase the
brightness or primarily to decrease the brightness. This directional quality may have
significant effect on the results of the brightness matching task.
Consider the method of limits for determining a difference threshold. Two stimuli are
presented, the standard and comparison, and the comparison stimulus is set initially
to a magnitude greater or smaller than the standard. The test participant reports
whether the comparison stimulus is different to or equal to the standard, and if
different the magnitude of the comparison is changed by a small amount in the
direction of the standard. This method hence employs a series of ascending or
descending stimuli, and the point at which the comparison is reported to be equal
with the standard is different in each case, tending to be a higher magnitude with the
with the ascending series from a low initial magnitude. The difference between these
two points of equality, the upper and lower limens, is the interval of uncertainty, and
the point of subjective equality will be the mid-point of this range (Geschider, 1997).
This effect may be related to the state of visual adaptation or to the general tendency
to compare things against recent memory, with recent memory serving as a
benchmark.
Therefore, when a single visual stimulus is set by test participants to an absolute
illuminance, in the absence of a simultaneous reference, then it is expected that a
higher level will be set when starting from an initially high illuminance than when
starting from an initially low illuminance. This can be seen in the results of tests
carried out by Ray who asked observers to adjust the illuminance of lighting to a level
clear and comfortable to read at (Ray, 1989). This was carried out under two lamps,
clear-glass tungsten filament (GLS) and blue-glass tungsten filament (BG), and 18
observers repeated this twice for each lamp, once each starting from a high
illuminance and a low illuminance. The results are shown in Table 4. It can be seen
that the lamps are set to a higher illuminance when the initial illuminance is high than
when the initial illuminance is low – these differences are significant (p<0.05, t-test).
[Table 4]
It is expected that different starting points will yield different estimates, which are
biased toward the initial values (Tversky & Kahneman 1974). This may be due to
anchoring, with the initial illuminance of the variable stimulus modifying the perceived
illuminance of the reference stimulus. For the side-by-side matching task, this would
mean a trend for the variable stimulus to be set to a higher level at the matched
condition when starting from a high initial illuminance than when starting from a low
initial illuminance. Whilst this trend can be seen in the results from two studies
(Fotios & Cheal, 2007a; Fotios & Levermore, 1997) it is frequently not a significant
trend, and a significant effect in the opposite effect has been found (Houser, Tiller &
Hu, 2003).
Table 5 shows the results of null condition tests carried out at three reference
illuminances, broken down according to whether the initial illuminance was set by the
experimenter to be either above or below that of the comparison (Fotios & Cheal,
2007a). There is a trend for the illuminance ratio to be higher when the variable lamp
the difference is significant only at the lower of the three reference illuminances
(p<0.01, t-test).
[Table 5]
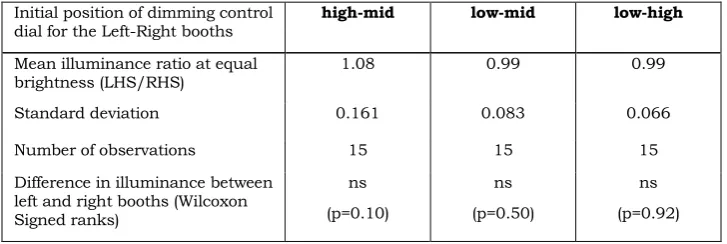
Table 6 shows the results of side-by-side matching tests which used separate warm
white (WW) fluorescent lamps to illuminate each booth (Fotios & Levermore, 1997).
Each booth had individual electric dimming control. Each of fifteen test participants
repeated the matching task three times. The dimming control dials were set by the
experimenter to one of three positions on their range prior to each trial, these being
high-middle, low-middle and low-high for the left and right booths respectively.
Observers were given the dimming controller for both booths, and had a free choice as
to whether only one, or both, of the booths were adjusted. The trend is again for the
booth initially set to the higher illuminance to end up at the slightly higher illuminance,
although the differences in illuminance are not significant (Wilcoxon Signed Ranks; the
results were not found to be normally distributed), although it is not known whether this
is because the higher illuminance stimulus was insufficiently dimmed downwards or the
lower illuminance stimulus was dimmed upwards too far.
[Table 6]
The results from a further study (Houser, Tiller & Hu, 2003) revealed the opposite
conclusion, that in a side-by-side brightness matching task when the adjusted stimulus
is initially set to a higher illuminance it is set, on average, to a lower illuminance at the
matched condition than when it starts from an initial low illuminance. In the
between-lamps trials (VT vs. CV between-lamps) the fixed stimulus was set to 300 lux whilst the
variable stimulus was set to either 150 lux or 450 lux before dimming was applied.
This was counterbalanced within trials. The results are shown in Table 7. The mean
illuminance ratio at equal brightness is significantly affected by the direction of
dimming (p<0.01). When the initial illuminance was higher (450 lux) it is set on
average to a lower level than when the initial illuminance was lower (150 lux). A
difference between this work and the two studies discussed above is that dimming
was carried out by the experimenter, under orders from the test participant, rather
than by the test participant directly, but this is not believed to explain the difference in
results.
Analysis of previous work suggests that the initial illuminance of the variable stimulus,
being either greater than or less than the reference stimulus, can significantly affect
the PSE in the matching task. Although the evidence is not conclusive, with trends
found in both directions, it is sufficient to warrant the precaution of counterbalancing
the initial illuminance of the variable stimulus.
4 Positional Bias
In the side-by-side matching task, the variable and reference stimuli will occupy the
left-hand side (LHS) or right-hand side (RHS) of the visual field. Similarly, if a
horizontal border is used, there are top and bottom fields. Poulton (Poulton, 1977)
comments that a stimulus range effect can occur when the observer knows which
stimulus of a pair is the standard, for example the one which is always presented on
the left, and that when the observer knows which stimulus is the standard he/she
tends to neglect it after a while, and instead judges each stimulus against the range
of stimuli presented. Data from previous lighting studies demonstrates a potential
bias caused by the position in which a stimulus is presented.
Thornton & Chen (Thornton & Chen, 1978) used side-by-side matching to compare
the visual clarity of lamps of different SPD. Their lamp pairs included four null
conditions, the same SPD being presented in both sides, for which an illuminance
ratio (RHS/LHS) of unity would be expected at equal clarity if there were no bias.
Subsequent analysis (Fotios, 2001a) of these null condition results suggested a
mean illuminance ratio (RHS/LHS) of 1.145 at equal clarity, although there are
insufficient data to determine whether this is a statistically significant departure from
unity.
Houser, Tiller & Hu also employed side-by-side matching to compare the brightness
of lighting from lamps of different SPD (Houser, Tiller & Hu, 2003). In null condition
trials carried out using VT65 lamps in both rooms, the mean illuminance ratio
(LHS/RHS) at equal brightness is 1.15 (std dev = 0.106, n=63) which is a significant
departure from unity (p<0.01, t-test) and suggests a significant positional bias.
These null condition tests are however confounded by a simultaneous bias in the
application of dimming - dimming was only applied to the left-hand lamp, and always
demanded dimming up from the initial level of 150 lux toward the comparison level of
300 lux. A positional bias can be found within their between-lamps trials although
(310.7 lux) than the RHS (298.4 lux). At equal brightness, the mean illuminance ratio
(LHS/RHS) is 1.049 (std dev = 0.12, n=1024) which is a significant departure from
unity (p<0.01, t-test).
These two studies (Houser, Tiller & Hu, 2003, Thornton & Chen, 1978) presented
large interior spaces. No matter how hard one tries to make two rooms or booths
identical there are always small differences. It is possible that the bias is caused by
experimental effects such as dissimilarities in the spatial distribution of luminance or
the location of the photometric measurement, variables which can be difficult to
match precisely in large spaces. A positional bias has also been reported when
using smaller fields; Kinney (Kinney, 1955) comments upon a subjective positional
bias, although without numerical data. This was an observer who consistently
reported the top half of a horizontally split field to be brighter than the bottom half,
even when the top and bottom stimuli were reversed.
Some studies using side-by-side stimuli have tested for this bias but did not find a
statistically significant effect (Fotios & Cheal, 2007a; Boyce 1977). Hence, although
a significant positional bias must be suspected when using techniques where two
side-by-side stimuli are compared, it is not a certainty, and this can be determined if
there are either sufficient quantitative data or that the stimuli locations were
counterbalanced. To generate reliable data the two lamps being compared should
each be used to illuminate the left-hand and right-hand spaces (or top and bottom)
for an equal number of trials.
5 Unreliable Data
From the above discussions it is apparent that for the side-by-side matching task to
generate reliable data the experimental design must consider effects of dimming
application, dimming direction, and stimulus position.
In some previous studies within the lighting literature, the application of dimming and
stimulus position were not counterbalanced, and in the absence of null condition data
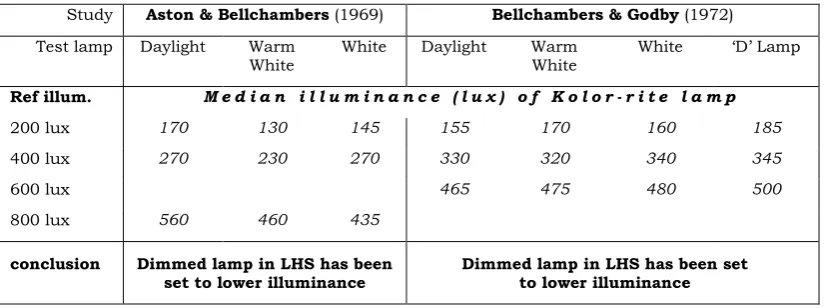
to quantify the effect, the results must be considered unreliable. For example, Table
8 shows the results from Bellchambers’ two studies (Aston & Bellchambers, 1969;
Bellchambers & Godby, 1972), which used side-by-side booths and rooms. In these,
dimming was applied to only one lamp in the pair, this being the Kolor-rite lamp, and
this was always in the left-hand side. The results show that the Kolor-rite lamp is set
as the variable lamp is set to a lower median illuminance, or the left-hand lamp is set
to a lower median illuminance, and can hence be at least partially attributed to effects
other than SPD.
[Table 8]
An estimate can be made of the cumulative effect of the three biases based on null
condition data described above. For the bias associated with the application of
dimming, the results from Tiller & Veitch at 700 lux suggest a bias magnitude of 1.09
(Tiller & Veitch, 1995). For the effect of dimming direction, the results of Fotios &
Levermore suggest an effect of magnitude 1.08 can be expected (Fotios &
Levermore, 1997). For the positional bias, analysis of data from Thornton & Chen
suggested an effect of magnitude 1.145 (Thornton & Chen, 1978; Fotios, 2001a) and
data from Houser, Tiller & Hu suggests a ratio of 1.15 (Houser, Tiller & Hu, 2003).
The product of these is 1.35, the bias expected assuming the effects are
accumulative. In a test with incomplete counterbalancing it is possible that some
biases would cancel out others but that would be fortuitous. The ratio of illuminance
of the Kolor-rite lamp to the median illuminance of the test lamps in Bellchamber’s
two studies ranges from 0.54 to 0.93. Hence, whilst bias is suspected, it does not
explain all the results. An effect of SPD is demonstrated but it is not possible to
determine what the size of this effect is because of the unknown amount attributed to
bias.
Worthey (Worthey, 1985) used side-by-side booths to demonstrate that the visual
clarity response is due to the distinctness of borders involving red-green contrasts.
The booths were separately lit by different light sources, a cool white fluorescent
(CW) in the left-hand booth and a prime-color cool white fluorescent (PCW) in the
right-hand booth. Neither lamp position nor dimming application were
counterbalanced in this study. Table 9 shows the seven experimental steps followed
by test participants. Of these seven steps, the clarity matches with identical color
papers in each booth (steps 3 and 6) were the focus of the experiment, the other
steps being control conditions. In each step a particular combination of colored
papers and visual equality criteria were used, and dimming was applied to one booth
in order to match them for the given visual criteria. This dimming was, however,
applied to just one interior, and hence to just one lamp, in each step. Worthey
shown in Table 9. In each step it is the stimulus to which dimming has been applied
that has been set to the lower illuminance.
[Table 9]
There are further matching studies which have not applied sufficient
counterbalancing and these also tend to reveal systematic bias with dimming
application and stimulus position. These studies demonstrate that the biases are
widespread and apparent across a range of viewing conditions and visual tasks.
• Alman, 1977: This study employed brightness matching with a two-degree field,
using a reference source that was always located on the right-hand side of the
field and dimming was applied only to the reference source (Alman, 1977). Of
26 stimulus pairs, the mean luminance ratios are all in the same direction
(greater than 1.0) except for only one (luminance ratio equal to 1.0) and there
are no null condition data by which to evaluate the causes of bias.
• Alman, Breton & Barbour,1983: This study used side-by-side matching with a
two-degree bipartite field (Alman, Breton & Barbour,1983). Dimming was
applied only to the test stimulus which was placed continually in the right-hand
side. In 35 of the 38 cases (filters of different color) the adjusted lamp is set to a
lower luminance than the fixed reference and there are no null condition data.
• Booker, 1978; This study used side-by-side comparisons of alpha-numeric
stimuli (the letter H) of approximate size one degree (Booker, 1978). The three
test stimuli were was always located on the right-hand side, the reference source
was always on the left-hand side, and dimming was applied only to the reference
source. All three results are in the same direction, having a luminance ratio
(variable/fixed) of >1.0 and there are no null condition data to check this.
• Hashimoto & Nayatani, 1994: This study used side-by-side booths to match the
contrast of four-color samples under different sources of light using haploscopic
presentation (Hashimoto & Nayatani, 1994). The reference source was always
on the left-hand side and was maintained at 1000 lux. The eight test lamps were
used to illuminate the right-hand booth, and dimming was applied only to these
lamps. For seven of the eight test lamps, the booth was set to a lower mean
illuminance than the reference, ranging from 445 lux to 994 lux, the other result
being 1049 lux. Again, this is a trend for the adjusted lamp to be set to the lower
• Randhawa, 1997: This study used side-by-side booths to compare different
lamps (Randhawa, 1997). In all of the comparisons dimming was applied to only
one of the two lamps and this was always the same lamp and always in the
right-hand booth. In 17 of the 18 conditions (6 lamp combinations and 3 visual
equality criteria) it is the booth to which dimming was applied that was set to the
lower illuminance.
• Zheleznikova & Myasoedova, 1995: This study used sequential matching
rather than side-by-side, in which the illuminance of the second room was
dimmed to match the brightness of the preceding room, identical other than type
of light source (Zheleznikova & Myasoedova, 1995). Two different lamps were
compared, and these were always observed in the same order. Dimming was
applied to lighting in only one room and hence only to one of the lamps, the
fluorescent. They found that the room lit by the fluorescent lighting required
approximately 15% less illuminance than the room lit by the sodium lighting for
equal brightness. It is again seen that the source to which dimming has been
applied is that which was set to the lower illuminance and there are no null
condition data.
Houser & Hu used a matching task but this was the Maxwell method of
color-matching rather than a brightness match (Houser & Hu, 2004). This study used a ten
degree horizontally bisected bipartite field with the lower half lit by ‘daylight’
fluorescent lamplight and the upper half lit by one of two tri-band primary sets – a
positional bias. Each of the three components of the primary sets was created using
incandescent lamps and narrow-band filters and these were individually adjustable.
The method of dimming was different in the upper and lower fields. In the upper field
subjects had independent control of the tri-band components, which were adjusted
individually using rotary dimmers. The subject adjusted the lower field with a toggle
switch that moved the daylight fluorescent lamps in and out of an integrating
chamber. This method allowed the subjects to make complete visual matches such
that the upper and lower fields were visually identical in both color and brightness,
despite having different spectral power distributions. Visually this is a simpler task
than brightness matching because the subject is not expected to ignore color
differences whilst making the match, but it is a more difficult task physically because
there are four separate “lights” that the subject can adjust. For both of the tri-band
primary sets, the mean luminance ratio (daylight/triband) at equal brightness was
greater than unity, although a significant departure in only one case, showing a
result could be attributed to the differences in spectral power distribution, which was
the main effect under study, but this is confounded with the positional bias. There are
no null condition data.
Fotios & Levermore used side-by-side booths to match lighting from standard
tungsten filament lamps (GLS) and similar lamps in which the glass envelope has a
blue coating, so-called daylight simulating lamps (Fotios & Levermore, 1995). Lamp
position and dimming direction were counterbalanced but dimming was applied only
to the GLS lamps, hence a potential bias – this was however corrected in later work
using null condition data (Fotios & Levermore, 1997).
An objective of this article is to highlight the need for null condition trials and for
counterbalancing. The benefits can be seen in the results from Houser, Tiller & Hu
(Houser, Tiller & Hu, 2003). In their null condition trials they did not apply
counterbalancing - the lamp to which dimming was applied was always in the
left-hand room and the variable stimulus always demanded dimming upwards from the
initial illuminance of 150 lux toward the comparison illuminance of 300 lux. The
mean illuminance ratio at equal brightness (fixed/variable) was 0.877 - on average
the variable stimulus (or, alternatively, the left-hand stimulus) was set to a higher
illuminance than the fixed (or right-hand) stimulus, and this is a significant effect
(p<0.01, t-test). The bias could have been due to some combination of position,
and/or direction, and/or the application of dimming. In their between-lamps tests they
did counterbalance lamp position, dimming direction and dimming application. Whilst
this did not eliminate the biases it made it possible to disengage them from the SPD
effects, hence to estimate their magnitude.
The counterbalancing discussed in this article is not the only consideration to be
made when using side-by-side matching. The results may be affected by contrast
adaptation and by the method of dimming employed – whether it affects the spectral
and spatial distribution of light and whether the control device provides the participant
with unintentional cues. The side-by-side presentation means that participants’ vision
will be chromatically adapted to the mixed SPD of the two stimuli rather than to the
SPD of one particular light source: this is not a dilemma, but rather awareness is
needed when considering analysis and application of the results.
This article has highlighted three causes for potential bias in side-by-side visual
matching tasks - a positional bias, a bias associated with the application of dimming,
and a bias with the direction of dimming. These biases can be counterbalanced,
demanding that in a test comparing two stimuli dimming is applied to both stimuli, the
stimuli are located in both positions, and the variable stimulus starts at an illuminance
higher and lower than the reference stimulus. The implication for experimental
design is that to examine one stimulus pair requires that participants carry out eight
trials, extending the duration of testing.
The existence of these biases means that several previous studies using the
matching task to identify the effect of lamp SPD on visual perception
must be considered unreliable because they did not carry out sufficient
counterbalancing. This conclusion is drawn with the caveat that it is important to
consider the magnitude of the between-lamps effect with respect to the magnitude of
the expected bias – it may be that the work does demonstrate an effect of SPD but
the size of this effect cannot be reliably quantified.
This work highlights the benefit of carrying out null condition trials. Unfortunately, this
means of validating experimental apparatus is absent from many studies in the
lighting literature. Null condition data can be used to correct non-null condition data
which did not employ sufficient counterbalancing, but this should be considered a last
resort: the preferred approach is to employ counterbalancing and use null condition
data as a back-up validation.
References
Alman DH. 1977 October. Errors of the standard photometric system when measuring the brightness of general illumination light sources. Journal of the Illuminating
Engineering Society: 55-62.
Alman DH, Breton ME, Barbour J. 1983. New results on the brightness matching of heterochromatic stimuli. Journal Of The Illuminating Engineering Society 12(4): 268-274.
Aston SM, Bellchambers HE. 1969. Illumination, colour rendering and visual clarity. Lighting Research and Technology 1(4): 259-261.
Bellchambers HE, Godby AC. 1972. Illumination, colour rendering and visual clarity. Lighting Research and Technology 4(2): 104-106.
Boyce PR. 1977. Investigations of the subjective balance between illuminance and lamp colour properties. Lighting Research and Technology 9: 11-24.
CIE. 1978. Light as a true visual quantity: principals of measurement. Paris: Commission Internationale De L’Éclairage.
Field A. 2005. Discovering statistics using SPSS. London: Sage Publications.
Fotios SA. 2001a. Lamp colour properties and apparent brightness: a review. Lighting Research and Technology 33(3): 163-181.
Fotios SA. 2001b. An error in brightness matching associated with the application of dimming. Lighting Research & Technology 33(4): 223-231.
Fotios SA, Cheal C. 2007a. Lighting in subsidiary streets: investigation of SPD effects. Part 2 – Brightness. Lighting Research & Technology 39(3): 233-252.
Fotios SA, Cheal C. 2007b. Evidence For Response Contraction Bias In Side-By-Side Matching Tasks. Lighting Research & Technology 39(2): 159-169.
Fotios S, Gado T. 2005. A comparison of visual objectives used in side-by-side matching tests. Lighting Research & Technology 37(2): 117-131.
Fotios SA, Levermore GJ. 1997. The Perception Of Electric Light Sources Of Different Colour Properties. Lighting Research & Technology 29(3): 161-171.
Fotios SA, Levermore GJ. 1995. Visual perception under tungsten lamps with enhanced blue spectrum. Lighting Research & Technology 27(4): 173-179.
Gescheider GA. 1997. Psychophysics: The fundamentals. Mahwah (NJ): Lawrence Erlbaum Associates.
Harrington RE. 1954. Effect of color temperature on apparent brightness. Journal of the Optical Society of America 44(2): 113-116.
Hashimoto K, Nayatani Y. 1994. Visual clarity and feeling of contrast. Color Research & Application 19(3): 171-185.
Houser KW, Tiller DK, Hu X. 2003. Prototype demonstration of vision-tuned fluorescent lamps. Final report for California Energy Commission.
Houser KW, Hu X. 2004. Visually matching daylight fluorescent lamplight with two primary sets. Color Research & Application 29(6): 428-437.
Hu X, Houser KW, Tiller DK. 2006. Higher colour temperature lamps may not appear brighter. Leukos 3(1): 69-81.
Hunt RWG. 1995. Measuring Colour. London: Ellis Horwood.
Jou J, Leka GE, Rogers DM, Matus YE. 2004. Contraction bias in memorial quantifying judgment: Does it come from a stable compressed memory representation or a dynamic adaptation process? The American Journal of Psychology 117(4): 543-564.
Kinney JAS. 1955. Sensitivity of the eye to spectral radiation at scotopic and mesopic intensity levels. Journal of the Optical Society of America 45(7): 507-514.
LaBoeuf RA, Shafir E. 2006. The long and the short of it: Physical anchoring effects. Journal of Behavioral Decision Making 19: 393-406
Lemons TM, Robinson AV. 1976. Does visual clarity have meaning for IES
illuminance recommendations for task lighting? Lighting Design & Application 6(11): 24-30.
Pereverzeva M, Teller DY. 2005. Centering biases in heterochromatic brightness matching. Vision Research 45(25-26): 3290-3300.
Poulton EC. 1989. Bias in quantifying judgements. London: Lawrence Erlbaum Associates Ltd.
Poulton EC. 1977. Quantitative subjective assessments are almost always biased, sometimes completely misleading. British Journal of Psychology 68: 409-425.
Randhawa HS. 1997. Visual characteristics of light sources for residential road lighting. Visual Scales: Photometric & Colorimetric aspects. NPL - CIE-UK Conference, March 1997. pp.65-68.
Ray S. 1989. The evaluation of a daylight tungsten lamp for task lighting. Under-graduate student research project, Department of Human Sciences, Loughborough University
Teller DY, Pereverzeva M, Civan AL. 2003. Adult brightness vs. luminance as models of infant photometry: Variability, biasability, and spectral characteristics for two age groups favour the luminance model. Journal of Vision 3: 333–346.
Thornton WA, Chen E. 1978. What is visual clarity? Journal of the Illuminating Engineering Society 7: 85-94.
Thornton WA, Chen E, Morton EW, Rachko D. 1980 October. Brightness Meter. Journal of the Illuminating Engineering Society: 52-63.
Tiller DK, Veitch JA. 1995. Perceived room brightness: Pilot study on the effect of luminance distribution. Lighting Research & Technology 27(2): 93-101.
Tversky A, Kahneman D. 1974. Judgment under uncertainty: Heuristics and biases. Science, New Series, 185(4157) 1124-1131
Worthey JA. 1985. An analytical visual clarity experiment. Journal of the Illuminating Engineering Society 15(1): 239-251.
Reference illuminance (lux) 2.0 7.5 15.0 Mean illuminance ratio
(variable/reference) 1.05 0.99 0.97
Std dev 0.13 0.10 0.08
n 144 144 144
Departure from unity (student’s
[image:23.595.85.399.90.188.2]t-test) p<0.01 n.s. p<0.01
Table 1
Results of null condition tests using a side-by-side brightness matching task to compare lamps of identical SPD (Fotios & Cheal, 2007b). The illuminance ratios suggest the illuminance to which the variable stimulus is set is biased toward the middle of the range of reference illuminances.
Test Lamp CFL MH1 MH2
Reference illuminance (lux) 2.0 7.5 15.0 2.0 7.5 15.0 2.0 7.5 15.0 Test lamp is dimmed
Mean illum. ratio (test/HPS) 0.737 0.699 0.657 0.793 0.723 0.685 0.718 0.697 0.645 Std dev 0.154 0.129 0.124 0.184 0.141 0.148 0.199 0.147 0.173 n 42 42 42 42 42 42 42 42 42 HPS lamp is dimmed
Mean illum. ratio (test /HPS) 0.654 0.737 0.810 0.669 0.744 0.763 0.642 0.752 0.837 Std dev 0.152 0.105 0.179 0.142 0.179 0.164 0.188 0.180 0.184 n 42 42 42 42 42 42 42 42 42 Illuminance of adjusted
booth relative to overall
average.* H L L H L L H L L
Difference between mean
illuminance ratios 0.05 p< n.s. 0.01 p< 0.01 p< n.s. 0.05 p< **p< 0.05 n.s. 0.01 p<
Table 2
Results of between-lamp tests using a side-by-side brightness matching task (Fotios & Cheal, 2007b). The results are broken down according to the application of dimming to either the reference lamp (HPS) or the Test lamp (CFL, MH1, MH2). Comparison of the illuminance ratios demonstrates that the illuminance of the variable stimulus is biased toward a higher level at the lower reference illuminance, and to a lower level at the higher reference illuminance.
* H = Illuminance of adjusted booth is higher than overall average L = Illuminance of adjusted booth is lower than overall average lower
[image:23.595.87.532.327.548.2]Illuminance (lux) in
reference room Mean illuminance (lux) for equivalent brightness in the comparison room
Analysis of difference
student’s t Difference
Uniform-Uniform comparison
300 310 -1.42 ns
500 475 3.56 p<0.01
700 642 8.25 p<0.01
Nonuniform-Nonuniform comparison
300 302 -0.28 ns
500 471 4.13 p<0.01
[image:24.595.87.418.88.279.2]700 642 8.25 p<0.01
Table 3
Results of null condition tests using a side-by-side brightness matching task to compare lamps of identical SPD and spatial distribution (Tiller & Veitch, 1995). The mean illuminance of the variable stimulus is biased toward the middle of the stimulus range. In each case, standard deviation estimated at σ=77 lux and the sample size is n=120.
Lamp Standard GLS lamp GLS lamp with blue glass bulb
Initial illuminance of variable
stimulus high low high low
Mean illuminance (lux) set “clear
and comfortable to read at”. 1123 645 806 419
Std dev 482 505 513 375
Table 4
[image:24.595.83.446.443.536.2]Initial illuminance of adjusted lamp
Illuminance ratio
(variable/fixed) Reference illuminance (lux)
2.0 7.5 15.0
Higher Mean 1.08 1.00 0.98
Std dev 0.12 0.10 0.08
Lower Mean 1.02 0.99 0.97
Std dev 0.13 0.10 0.08
Difference between higher and lower
[image:25.595.85.474.83.212.2]mean illuminance ratios (t-test) p<0.01 n.s. n.s
Table 5
Results of brightness matching null condition tests, broken down according to the initial illuminance of the adjusted stimulus, an illuminance higher or lower than the illuminance of the reference stimulus (Fotios & Cheal, 2007a). In all cases, sample size n = 72.
Initial position of dimming control
dial for the Left-Right booths high-mid low-mid low-high Mean illuminance ratio at equal
brightness (LHS/RHS) 1.08 0.99 0.99 Standard deviation 0.161 0.083 0.066
Number of observations 15 15 15
Difference in illuminance between left and right booths (Wilcoxon Signed ranks)
ns (p=0.10)
ns (p=0.50)
ns (p=0.92)
Table 6
[image:25.595.89.453.381.503.2]Lamp to which dimming applied
Initial illuminance of variable lamp (lux)
Mean illuminance
ratio (VT/CV) std dev Effect of initial illuminance (two sample t-test)
VT 150 1.084 0.126 p<0.01
450 0.980 0.095
CV 150 0.989 0.115 p<0.01
[image:26.595.84.515.102.210.2]450 1.056 0.127
Table 7
Results of brightness matching tests broken down according to the initial illuminance of the variable stimulus (Houser, Tiller & Hu, 2003). In all cases n=256.
Study Aston & Bellchambers (1969) Bellchambers & Godby (1972) Test lamp Daylight Warm
White White Daylight Warm White White ‘D’ Lamp Ref illum. M e d i a n i l l u m i n a n c e ( l u x ) o f K o l o r - r i t e l a m p
200 lux 170 130 145 155 170 160 185
400 lux 270 230 270 330 320 340 345
600 lux 465 475 480 500
800 lux 560 460 435
conclusion Dimmed lamp in LHS has been
set to lower illuminance Dimmed lamp in LHS has been set to lower illuminance
Table 8
[image:26.595.85.499.364.518.2]Step
No Lamp in LHS Lamp in RHS Criteria for visual equality Lamp to which dimming was
applied
Mean illuminance ratio (PCW/CW) at the visual match
Booth at lowest illuminance
1 CW PCW brightness PCW 0.9 PCW
2 CW PCW overall
brightness PCW 0.8 PCW
3 CW PCW clarity of
red-green border PCW 0.085 PCW 4 CW PCW clarity of border CW 20.0 CW 5 CW PCW overall
brightness PCW 0.9 PCW
6 CW PCW clarity of
blue-yellow border CW 3.2 CW
7 CW PCW clarity of border PCW 0.17 PCW
Table 9
Summary of dimming application and visual objectives in the matching test carried out by Worthey using side-by-side booths (Worthey, 1985). It can be seen that the booth to which dimming is applied is set on average to the lower illuminance.