Crop Hail Damage: Insurance Loss Assessment
Using Remote Sensing
F. R. Young*, O. Chandler#, and A. Apan*
*
Faculty of Engineering and Surveying University of Southern Queensland
Toowoomba Qld 4350 Email: [email protected]
#
Freemans Toowoomba Suite 1, 382 Ruthven Street
PO Box 511 Toowoomba Qld 4350
Email: [email protected]
ABSTRACT
The project focussed on designing a remote sensing data acquisitions strategy that will suitably respond to the requirements of broadacre crop hail damage mapping and assessment. Current field based hail damage assessment practices are both time and labour intensive. This new strategy required multi-stage and multi-source data acquisition to be performed within specific time, spatial resolution and cost limitations. Integration with a Geographic Information Systems (GIS) database is also essential to interface with an interactive administrative system.
Remote sensing and GIS provides an economically viable technique for the recording, correlation, analysis and judicious evaluation of hail damage loss accuracy, consistency and creating a relational database. Value adding is realisable through modelling storm damage and past claims information for risk analysis scenarios to provide planning and crop management information to farmers. Information can also be provided to developers; land use planners; prospective buyers; insurance brokers and financial lending agencies. This technique’s attributes will enable a commercial Internet claims management platform to be established.
This paper reports on results that encompass the strategy; spectral signature evaluation from a multiple hail damage simulations; and hail damage assessment using remotely sensed imagery.
1
Introduction
Freemans Australian are loss adjusters with a wealth of paper filed historical data relating to clients, claimants, event assessments, related environmental factors and claim success outcomes. The methods of collecting and storing data are largely manual and the entire process is quite complex (figure 1). The potential of alternative innovative approaches to develop better competitive practices and commercial leadership, and to contribute to precision agricultural research in regional Australia, have been identified as:
•improved data collection methods that are conducted more rapidly;
•having greater data reliability;
•more extensive collection area;
•compatibility with a single information dissemination network; and
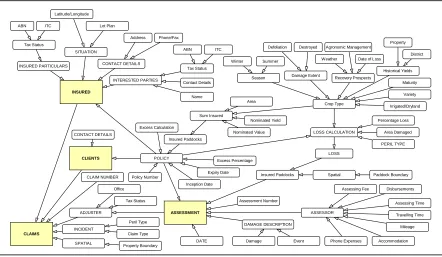
CLAIMS ADJUSTER CLAIM NUMBER INCIDENT Claim Type Peril Type Tax Status Office SPATIAL Property Boundary Excess Calculation CLIENTS POLICY CONTACT DETAILS Excess Percentage Area Policy Number Nominated Yield Nominated Value Expiry Date Inception Date Insured Paddocks Sum Insured INSURED SITUATION Address CONTACT DETAILS INTERESTED PARTIES Lot Plan Latitude/Longitude Phone/Fax INSURED PARTICULARS ABN Tax Status Contact Details ITC Name ABN Tax Status ITC Travelling Time ASSESSMENT ASSESSOR DATE Assessing Time Mileage Accommodation Phone Expenses Disbursements LOSS CALCULATION Area Damaged
Percentage Loss Crop Type Recovery Prospects Irrigated/Dryland Damage Extent Defoliation Destroyed Season Summer Winter Variety Maturity Assessing Fee Date of Loss Weather Damage Historical Yields DAMAGE DESCRIPTION Event Property District PERIL TYPE
Insured Paddocks Spatial Paddock Boundary LOSS
Assessment Number
[image:2.595.96.538.81.338.2]Agronomic Management
Figure 1. Insurance claims process inter-relationship (Chandler 2001)
Approximately 3% (highs of 6.5% -11.2% and lows of 0.5% -1% (Chandler, 2001)) of total cereal crop production is lost every year within the Darling Downs region, Queensland, Australia, due to hail damage. This weather-induced crop damage occurs in irregular patterns and varies widely within affected area.
1.1 Project concept development
The premise of this research was to develop a computer based system capable of accurately and efficiently assessing the extent and degree of loss sustained from a hailstorm event in broadacre agricultural crops. This was to be performed in a cost effective way, using satellite or airborne imagery, geographic information system and Internet based information distribution.
This structure was perceived as having the potential to be more accurate and objective than traditional methods; have minimal variations between assessments; be more efficient; and has the added potential for expansion into various agricultural crops and insurable phenomenon. Textual and image data relating to the insurer, client, claimant and field assessment were to all be geo-referenced and stored in a Geographic Information Systems environment. The final development stage was to create a database system and Internet facilities to enable appropriately selected information formats to be commercially available to insurers, claimants and for value adding to other potential clients not necessarily associated with insurance.
The current methodology for assessing the percentages of damage; area of damage; requirements for further assessment; crop maturity; and identifiers of yield potential done on-site in consultation with the claimant. The agronomist/field assessor must also evaluate and determine other factors that may have caused or increased the damage. These include winds, frost, before and after event rainfalls, pests, diseases and surrounding vegetation influences.
1999). Assessing loss has not been a precise science and it is difficult for field assessors to quantify both area and extent of damage across large fields (Erickson et al., 2004). Physical assessment processes, potentially compromised by post event damage, weather, time and people, must be considered in parallel with various factors such as crop condition caused by the supply of water and nutrients, insect or pest infestation, disease outbreaks and prevailing weather conditions (Rao, 1997). If damaged has occurred whilst the crop is in an early stage of growth, often a secondary assessment is required to confirm actual loss of production as a result of the hail storm.
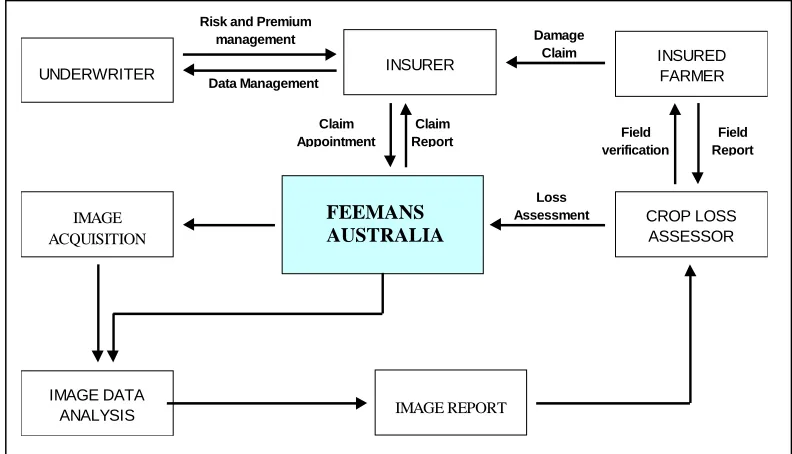
In the well serviced South East Queensland region an average claim assessment cost is directly related to travel. Multiple assessment of variable damage of different crop areas affects the required field assessment efforts before having to attend to the office based processes. There is a clear need for a simple, speedy and reliably consistent data acquisition and better data storage to assist or replace part of the field and office work and enable integration and multi application to provide information. Figure 2 depicts the operation integration of satellite imagery within the loss adjuster’s environment.
UNDERWRITER
INSURED FARMER
FREEMANS
[image:3.595.106.502.309.536.2]
Figure 2.Remote sensing, GIS and insurance operational integration (Chandler 2001)
Both data and information are subjected to different privacy and commercially sensitive issues and are therefore used differently in a commercial sense. Atzeni et al. (1999) distinguish between data and information "The concept of ‘data’ and ‘information’ are often confused, however ‘data’ alone has no significance, but once interpreted and suitably correlated, it provides ‘information’ that allows us to improve our knowledge.” Hence, data is necessary for the claims adjuster's assessments, but information is their primary and commercial interest. The ease and speed of the satellite sensing system to acquire data which can be largely analysed automatically to provide information for immediate application and value-added modelling were then the prime objectives of the project. Freemans surmised the main limitations or disadvantages of their current system:
•The science of estimation is not precise and is constantly under improvement;
• Variations between assessors can exist;
•It is often difficult to view the entire area due to size or access constraints; RURAL LOSS
ADJUSTERS
CROP LOSS ASSESSOR INSURER
IMAGE ACQUISITION
IMAGE DATA
ANALYSIS IMAGE REPORT
Risk and Premium management
Data Management
Claim Report Claim
Appointment Field
Report Field
verification Damage
Claim
Loss
FEEMANS AUSTRALIA
•It can be difficult to gain access to the property due to uncontrollable factors (for example, flooding);
•It is difficult to ensure the availability of all concerned parties;
•Long distances to claim sites, or multiple sites, have high time and cost resource requirements; and
•Assembly and deployment of logistics can be difficult;
The researchers anticipated that the following benefits were achievable through the use of remote sensing and GIS:
•Scientifically more accurate and objective damage assessment;
•Minimised variations between assessments with a standard technique;
•Improves efficiency from reduced travelling requirements and shorter assessment time;
•Cost savings where one image covers multiple claims;
•Expansion into other crops and insurable phenomena and value adding using data to model and predict insurance and claims probability: and
•Ability to assess the entire field or damage region.
1.2 Assessment considerations
The project objectives were to firstly assess the capability and utility of satellite imagery for crop loss adjustment and, secondly, to develop techniques that analyse the extent and degree of loss from hail in broadacre agricultural crops sorghum.
Research indicates that very little radiation is absorbed (<5%) within the leaf but the majority is reflected (40-50%) or transmitted (McAlpine and Phinn, 2001). It is these high reflectance values, for the NIR but not B, G, R bands, which enable greater utility for vegetation studies and provided separation between vegetative and non-vegetative areas (Campbell, 1996).
The appropriateness of Vegetation Indices as the quantitative measure of vegetation vigour or biomass was confirmed in our trial project investigation (refer 2.1). This ratio of radiance in the red and near infrared regions, one of many ratios related to the measurement of vigour and abundance, is accepted as more effective than the red-green ratio (Campbell, 1996 and Lillesand and Kiefer 1994). However, Rao (1997) discusses how crop condition is affected by a combination of various factors including supply of water and nutrients, insect or pest attack, disease outbreaks and weather conditions. These stresses cause physiological changes that alter the optical and thermal properties of plants and leaves, causing changes in canopy geometry and reflectance. Hence, crop condition and yield loss predictions need to be considered, together with plant damage in any of the categories of Stand reduction (the number of plants killed by the hailstorm); Stalk damage (damage sustained to the main stalk of the plant); or Head damage (measure of kernel destruction in the head) (Chandler 2001).
Defoliation is the loss of leaf area of the plant, which may lead to yield losses through the plant’s inability to effectively photosynthesise. It has been identified that the percentage defoliation is more accurate when evaluated within 7-10 days after the hailstorm (Erickson et al., 2004 and Freemans 1999). It was recognised that satellite sensing will be most effective in assessing defoliation but that the assessment accuracy is linked to crop condition, vigour and biomass factors.
plot (refer to 2.2) was established to address this issue and to establish validity for satellite imagery assessment or to enhance an algorithm that will achieve an enhanced accuracy and reliable solution.
2
Methodology
The research method and techniques were required to consider limitations relating to cost, simplicity and reliability, suitable for incorporating into a loss adjustment environment, and outcome transparency that could be acceptable to both clients and claimants alike. Following the success of a trial (refer 2.1) the decision to use Landsat TM for more controlled events was based on availability and cost.
A test study (refer 2.2) using a spectroradiometer in a controlled laboratory field plot was initiated because the continuing drought reduced the probability of crop growth suitable to sustain hail damage and the unusual absence of the annual hail season. This study also provided the opportunity to test the reflectance responses of a variety of controlled damage percentages over a selection of growth stages.
The initial trial and test study findings are discussed together with the initial evaluation of one late-season limited hail event.
2.1 Analysis of initial project trial
On 2 January 2000, two storm calls delivered rain and hail, in sizes from marbles to golf balls, which destroyed thousands of hectares of crops. The total loss claimed exceeded $3m (Chandler, 2001).
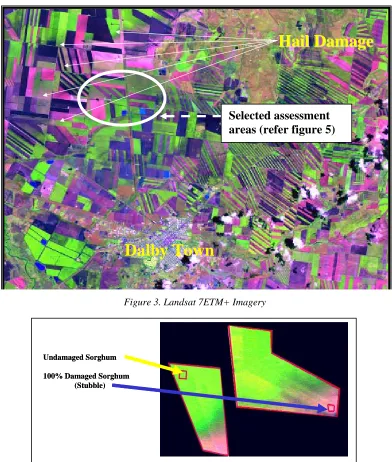
Due to the unavailability of a usable SPOT image, spatial resolution was not actively considered for this project and Landsat 7 ETM+ imagery was selected (figures 3 and 4). Geo-referencing of the image was achieved through locating the property boundaries from the Digital Cadastral Database (DCDB). The defoliation damage identification is possible by selecting:
• individual fields within the property which sustained damage;
• areas of interest which represent undamaged sorghum equivalent to that of the damaged fields before the hail storm; and
•areas of interest, which represent 100% damaged sorghum.
The process used to determine the defoliation of sorghum across the field involves numerous before and after crop conditions, weather, soil, damage and surrounding environmental variables. In the development of more universal analytical test technique for determining defoliation due to hail, the number of variable factors was minimized. The following selection criteria was considered and used for the five fields (figure 5):
•Consistent soil types;
•Minimal topological variations;
•Same variety of sorghum;
•Same maturity of sorghum;
•Same cropping practices;
•Same cropping history of field; and
•A continuum of damage across a field.
The usefulness of remote sensing in monitoring vegetation biomass was attempted by showing the spectral behaviour of three differing levels of defoliation:
•moderately damaged sorghum; and
[image:6.595.117.509.106.568.2]•severely damaged sorghum
Figure 3. Landsat 7ETM+ Imagery
Dalby Town
Hail Damage
Hail Damage
Dalby Town
Hail Damage
Hail Damage
Selected assessment areas (refer figure 5)
Undamaged Sorghum
100% Damaged Sorghum (Stubble)
Undamaged Sorghum
100% Damaged Sorghum (Stubble)
Figure 4. Example fields selected for analysis (Chandler 2001)
To overcome the problems of mixed pixels and the ‘edge effect’, the area of interest was reduced by n-pixels to achieve a ‘pure pixel’ representation of only the field. This project then considered three techniques for image processing:
•Normalized Vegetation Difference Index (NDVI);
•Tasselled Cap Transformation; and
•Modified Soil Adjusted Vegetation Index (MSAVI)
Using bands 3 and 4 (red and near infrared), large variations in pixel values occur. These qualities have allowed the assessment and quantification of defoliation from satellite imagery and form the best band combination for discriminating vegetation defoliation.
An assumed undamaged and an assumed 100% damaged region has been selected for analysis, based on image observation and personal communications with the assessors, Freemans and the farmer. The techniques developed in this project relied entirely on the ability to accurately extract these features before analysis. Therefore, variations in the representative plots could potentially reduce consistency and lead to erroneous results. However, from the satellite imagery and the ground observations there was minimal influential atmospheric conditions, reducing possible errors from this influence. The most important contribution to differences in assessment was judged to be the occurrence of infield variability; there were minimal and accepted as a small error sources for this project. A combination of all these factors may influence plant vigour, health, regeneration capabilities and spectral characteristics within a single field. It is also important to note for the analysis process that variations in the field can occur before and after a hailstorm
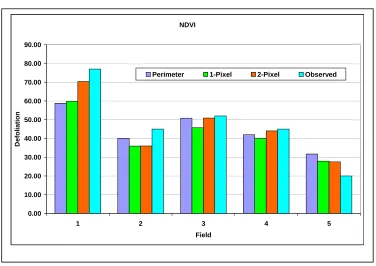
It was established, both by the assessor and within those techniques relating to vegetation biomass and vigour, that Field 1 contained regions of severe defoliation to a rate less than 30% foliation within the south-east corner. The large differences in this field’s defoliation may be attributed to this fact that it is less than the recommended lowest plant cover percentages. Ray (1994) identified that the NDVI has the best sensitivity to changes in vegetation cover, except in low vegetation cover less than 30%.
The results observed in a number of cases have been relatively accurate, within 5% to 10% of observed assessment using NDVI and Tasselled Cap Greenness techniques. The use of Tasselled Cap Brightness and Wetness techniques have shown little to no correlation between observed and calculated defoliation rates. Furthermore, the MSAVI2 has generally revealed a low accuracy when compared to the observed defoliation rates.
These relative accuracies were based on the assumption that the defoliation observed by the assessor was 100% correct. More realistically, the assessor may possible be marginally different from the true defoliation evident within an entire field. Further comparison of field observation of defoliation and patterns, and multiple assessments (different assessors) of the same claim, could provide a more reliable verification of a true indication of the damage within the field.
Rescaled NDVI Thematic Map of Defoliation Rescaled NDVI Thematic Map of Defoliation Rescaled NDVI Thematic Map of Defoliation
Field 1
Field 2 Field 3
Field 4
[image:8.595.136.451.73.425.2]Field 5
Figure 5. NDVI defoliation thematic map
NDVI
0.00 10.00 20.00 30.00 40.00 50.00 60.00 70.00 80.00 90.00
1 2 3 4 5
Field
D
e
fo
li
at
io
n
Perimeter 1-Pixel 2-Pixel Observed
Figure 6. NDVI analysis comparison of the perimeter and three adopted boundaries
[image:8.595.113.489.443.709.2]predict defoliation in sorghum to an average accuracy of up to 5.05% to that found by an assessor.
Other vegetation analysis techniques and a combining multiple techniques need to be investigated as they may lead to improved accuracies in defoliation estimation. However, as cereal crop begins to dry/ripen, remote sensing may not detect the levels of damage because there is minimal spectral response variation. Hence, viability of this hail damage assessment system initially requires image acquisition reliability and suitable imagery.
2.2 Test study trials
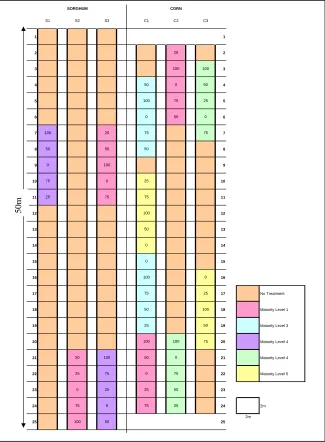
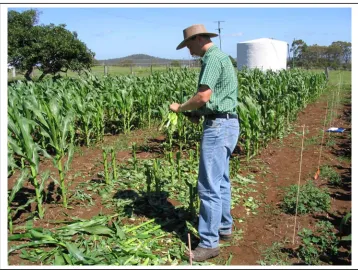
To evaluate spectral responses of different percentages of hail damage at various crop-growth periods, a test site to mimic hail damage environments was established (figure 7 and 8).
The site consisted of two sections of 3 rows, each row two metres wide (three plants at one meter spacing between them) and separated by one metre, one planted with corn and the other sorghum. Each row was marked in two metre section lengths to facilitate a controlled defoliation regime at each of the six growth
1 1 2 2 3 3 4 4 5 5 6 6 7 7 8 8 9 9 10 10 11 11 12 12 13 13 14 14 15 15 16 16
17 17 No Treatment
18 18 Maturity Level 1
19 19 Maturity Level 3
20 20 Maturity Level 4
21 21 Maturity Level 4
22 22 Maturity Level 5
23 23
24 24 2m
25 25
2m
S1 S2 S3 C1 C2 C3
[image:9.595.131.456.316.758.2]SORGHUM CORN 50 100 50 0 75 25 50 25 0 75 100 25 50 100 0 75 100 75 25 0 50 100 0 75 50 25 75 100 50 0 0 100 75 50 25 100 50 0 25 75 25 100 0 75 50 100 0 75 50 25 100 50 25 0 75 0 25 100 50 75 50m
Figure 8. Simulated hail damage to trial plot.
stages (table 1). Planting was undertaken on the 26th November following adequate rainfall. The cropping constants are described in table 2. To collect spectral data as reference values for correlation with satellite imagery data analysis of hail damage, the following methodology was used.
Maturity at Defoliation (Stages) Defoliation
STAGE Sorghum Corn Control (0%)
Stage 1 6-Leaf 6-Leaf 25%
Stage 2 Boot 12-Leaf 50%
Stage 3 Head Ear Formation 75%
Stage 4 Flowering Flowering 100%
Stage 5 Soft Dough Soft Dough
[image:10.595.104.488.416.740.2]Stage 6 Harvest Harvest
Table 1. Variables
Fertiliser Plant Population
Crop Type Applied Fertiliser
Crop Type Recommended Population
Achieved Population
Sorghum Nil Sorghum 7-8/m/row 7-8/m/row
Corn Nil Corn 4/m/row 4/m/row
Row Spacing Weed Control
Crop Type Applied Row Spacing
Crop Type
Applied Herbicide
Sorghum 1m Sorghum
Roundup 1000ml
Corn 1m Corn
Rainfall: Dryland cropping, nature dependent Pesticide: On demand
[image:10.595.106.484.425.548.2]At each growth stage a discrete section was selected to have manually induced destruction (cutting, bending , impact and shredding) amounts for 0%, 25%, 50%, 75% and 100%. ASD FieldSpec® Handheld spectroradiometer (Analytical Spectral Devices, 2002) readings were observed for each growth and destruction event from both 1.5 and 2.5 metre distances. The spectroradiometer has a spectral range of 325-1075 nm (covering the Visible/Near Infrared (VNIR)) spectrum, with the sampling interval of 1.6nm and spectral resolution of approximately 3nm at around 700nm. These tests used the fixed 25° field of view, corresponding to about 60cm radius on the ground at two metres from the ground. The spectroradiometer data collection commenced on the 11th December 2003 the 6 leaf stage (corn). The same crops areas were assessed by an agronomist on the 19th December 2003 to confirm the amount of defoliation.
From the preliminary analysis, the spectroradiometer reading of the crop areas at different growth and damage stages were not consistent, either within the growth stages or relative to the percentage of damage. The variable reflectances were evident for both low (1.5m) and higher (2.5m) reading distances from the crop. The major consistency observed, also found by Erickson et al. (2004) for corn crops in the USA, was the expected high NIR reflectance for no damage (high green biomass) and a lower NIR reflectance for 100% damage (low green biomass). The reverse was true for the values recorded in the red spectral band due to the chlorophyll absorption of light in those frequencies. In many cases the red light provided more useful information in distinguishing the different levels of damage, similar to the work done by Erickson (2004) with maize.
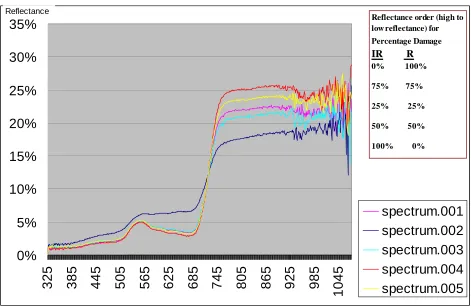
Figure 9 is an example of spectral response curves, generated using Microsoft Excel, of the 1.5m height readings in row C1. The 0% and 100% damage reflectance readings were relatively correct with the intermediate damage values not showing an ideal consistency. Some other intermediate damage test readings values were less consistent, but the 100% damage and 0% damage reflectance values always maintained their relative correctness.
Analysis of the data is ongoing, in conjunction with aerial NIR digital camera images taken from a tethered balloon, in an endeavour to eliminate spurious values and determine useful algorithms for correlating to satellite imagery spectral responses in damaged crops. Current analysis results have determined the following problems with the methodology and techniques of this test study:
• The initial damage was conducted on young and vigorously growing plants and the inflicted damage did not necessarily distress such young plants as would be evident in a hail event.
• Possible anomalies with the red and NIR spectral reading with the pure red soil colour.
• Wispy and fast moving cloud presence resulted in variances in illumination during sampling.
• Effects of varying winds on leaf shadow and aspect changing dispersion and reflectance of light.
• This was the first time the spectroradiometer was used.
• The spectroradiometer appears to better suited to a single item, not a group (eg leaves),
• reading for consistent and relatively graded values.
• It is less a situation of measuring change in an object to one of imaging an object/s and then imaging object/s that are no longer present.
• The maturity (size) of the plants in the early stages of growth and the small plot cropping practice meant an abnormally large quantity of soil reflectance is visible in the field of view.
[image:12.595.66.537.173.479.2]Like Erickson et al. (2004), the analysis has so far determined distinct differences in spectral responses amongst the simulated hail-damaged plots and undamaged areas where the bare soil is a significant portion of the area under evaluation.
Figure 9. Spectral response curves example.
0%
5%
10%
15%
20%
25%
30%
35%
325
385
445
505
565
625
685
745
805
865
925
985
1045
spectrum.001
spectrum.002
spectrum.003
spectrum.004
spectrum.005
ReflectanceReflectance order (high to low reflectance) for
Percentage Damage
IR R
0% 100%
75% 75%
25% 25%
50% 50%
100% 0%
2.3 Hail damage event
A recent 2004 minor hail damage even at Dalby was the sole test for this year as a consequence of the drought and unseasonable conditions. The damage was barely noticeable on the Landsat TM image and only limited spectroradiometer readings were taken of discrete points 10m into paddock. The spectroradiometer values were, as before, inconclusive and are undergoing further analysis, particularly as this crop had full heads (greatly disperses reflectance) growth condition.
A SPOT image imaging over a larger sample area, provided the initial analysis of the damage (figure 10). The reflectance responses in the red and NIR regions provided expected and reasonably good correlation with the percentage of hail damage.
3
Discussion
Soft Dough - Spot (20/02/2004)
0 10 20 30 40 50 60 70 80 90 100
(:Layer_1) (:Layer_2) (:Layer_3) (:Layer_4)
Band
Di
g
it
a
l Nu
m
b
e
r
Defoliation 5-10% (Soft Dough) 014
Defoliation 15% (Soft Dough) 020
Defoliation 20-30% (Soft Dough) 026
Defoliation 20-30% (Soft Dough) 010
Defoliation 25-30% (Soft Dough) 018
Defoliation 25-30% (Soft Dough) 034
Defoliation 30-40% (Soft Dough) 012
Defoliation 50-60% (Soft Dough) 016
Defoliation 60-70% (Soft Dough) 038
Decending digial number plot against defoliation percentage.
[image:13.595.78.537.50.378.2]R NIR 60-70 5-10 50-60 15 25-30 20-30 25-30 20-30 15 30-40 30-40 20-30 20-30 25-30 5-10 60-70 20-30 50-60
Figure 10. Spot imagery of hail damaged crop.
The results indicated that remote sensing can be used for analysing defoliation to an accuracy of 5% to 30% (refer 2.1) difference from that observed in the field by an assessor.
The high NIR reflectance for 0% damage (high green biomass), a lower NIR reflectance for 100% damage (low green biomass) and the reverse in the red spectral band were positive outcomes. The red spectral values were sometimes superior to NIR in distinguishing the different levels of damage, but both spectral regions did not provide a graded consistency between the extremes, making the identification of small damage percentages difficult to verify.
Localised and close reading using a spectroradiometer do not appear to simulate the satellite sensing situation that will enable the spectroradiometer to provide accurate ground truthing information. Further analysis of the wealth of collected ground based spectroradiometer data and the NIR imagery acquired from further away, from a tethered balloon platform, will be continued in an effort to establish better correlation information or methods.
4
Commercial opportunities
The commercial opportunities (discussed in sections 1 and 1.1) include a more economic operation through improved data collection and reliability; increased compatibility with a single information dissemination network; and better utilisation of resources.
There is the additional opportunity to utilise the same data for an increased variety of value-added and commercially advantageous information outlets. Ongoing satellite determined data and traditional data forms for each new claim can be used to enhance the modelling and prediction of future hail damage intensity and location. This value-adding to the core business is realisable through modelling damage paths and past claims information for risk analysis scenarios. This information could provide planning and crop management information to farmers and decision support information for land developers, land use planners, prospective buyers, insurance brokers, economists and financial lending agencies.
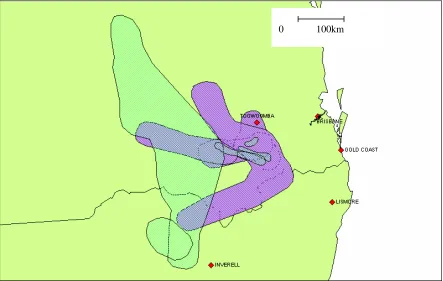
Using past crop damage records, figures 11 is an example of damage path predictions in the 2002/2003 season. Figure 12 depicts individual claims made from October 2002 until April 2003 and figure 13 a selection of major claims of the 2000 to 2003 cropping season. Limited geo-referencing of claims data records and extent of the damage, plus the volume of loosely paper based records would require a huge resourse allocation to complete a comprehensive analysis. Loading all this data into a GIS and continually adding new assessment and imagery data can establish a substantial and powerful modelling and re-assessment capacity.
[image:14.595.88.531.388.669.2]
Figure 11. Damage path prediction 2002/2003 hail season
Figure 12. Major hail damage loss claims 2002/2003 hail season.
[image:15.595.94.535.420.723.2]5
Conclusions / Summary
Research carried out on small crop plots with simulated hail damage, to control the level and timing of damage, has demonstrated that a fully reliable estimation of actual damage levels using a ground based spectroradiometer is elusive. Ongoing testing and analysis with NIR imagery acquired between 30m to 60m distance above the crop has promise of identifying anomalies to enabling more reliable evaluations.
Remote sensing imagery data of crops can be inherently complex when the analysis is conducted in conjunction with the limited data and understanding of multiple crop conditions and associated variabilities. Geo-referencing satellite data is therefore essential, using GPS or DCDB data, to enable a close correlation with ground data and calculations for information accuracy. Developing a library of spectral responses related to field variability will enable a more comprehensive understanding of the variability and meaning of spectral responses. Therefore, it is considered that the best progress with evaluating hail damage using satellite imagery is to evaluate several actual hail damage events aided by full ground data, and, if possible, comprehensive spectroradiometer reading.
However, the outcomes so far have already shown that using satellite imagery should result in fewer and shorter field visits and increased accuracy in determining loss. Further verification of these benefits will result in the economic catalyst to initiate its use and progress the methodology to have it accepted by insurance clients, claimants and other interested groups.
Employing remote sensing imagery assessment of hail damage and a GIS management and information system should enhance the commercial viability and advantage of the loss adjusting business. Coupled with archived and future acquired data, there is also a significant potential benefit in modelling and predicting hail damage as a value-added commercial enterprise.
Acknowledgements
This research was partially funded by the Australian Government’s AusIndustry Research and Development Start Grant awarded on 2nd April 2002 for the project “Quantifying Hail damage for Crop Assessment Using GIS”. Freemans Toowoomba provided advice on loss adjustment techniques and need and access to insurance loss assessment information necessary to support this research.
References
Analytical Spectral Devices, 2002, FieldSpec UV/VNIR Handheld Spectroradiometer User’s Guide, Boulder CO, USA.
Atzeni, Ceri, Paraboschi and Torlone, 1999; Database Systems: Concepts, Language and Architectures. McGraw Hill, London.
Campbell, J.B., 1996. Introduction to Remote Sensing, 2nd edn. The Guildord Press, New York.
Erickson, B. J, Johannsen, C. J, Vorst, J. J, and Biehl, L. L (2004) Using Remote Sensing to Assess Stand Loss and Defoliation in Maize, Photogrammetric Engineering & Remote Sensing, Journal Of The American Society For Photogrammetry And Remote Sensing, Vol. 70, No. 6, June 2004, pp.717-722.
Freemans, 1999. Freemans Crop Loss Assessors Manual, Company document.
Lillesand, T.M., and Keifer, R.W., 1994. Remote Sensing and Image Interpretation, edn. John Wiley and Sons, USA.
McAlpine, C., and Phinn, S., 2001. ENVM1504 Introduction to Remote Sensing Study Book, University of Queensland, Gatton
Rao, K, 1997. Remote Sensing in Agriculture, in Remote Sensing and Geographic Information Systems for Environment and Natural Resources Management, pp. 149-153, United Nations, New York
Ray, T., 1994. A FAQ on Vegetation in Remote Sensing, [Online]: