This is a repository copy of Motor Sequence Learning in the Brain: The Long and Short of
It.
White Rose Research Online URL for this paper:
http://eprints.whiterose.ac.uk/127247/
Version: Accepted Version
Article:
Gonzalez, CC and Burke, MR orcid.org/0000-0002-2561-053X (2018) Motor Sequence
Learning in the Brain: The Long and Short of It. Neuroscience, 389. pp. 85-98. ISSN
0306-4522
https://doi.org/10.1016/j.neuroscience.2018.01.061
(c) 2018, IBRO. Published by Elsevier Ltd. This manuscript version is made available
under the CC BY-NC-ND 4.0 license https://creativecommons.org/licenses/by-nc-nd/4.0/
[email protected] https://eprints.whiterose.ac.uk/ Reuse
This article is distributed under the terms of the Creative Commons Attribution-NonCommercial-NoDerivs (CC BY-NC-ND) licence. This licence only allows you to download this work and share it with others as long as you credit the authors, but you can’t change the article in any way or use it commercially. More
information and the full terms of the licence here: https://creativecommons.org/licenses/
Takedown
If you consider content in White Rose Research Online to be in breach of UK law, please notify us by
Motor sequence learning in the brain: the long and short of it.
Gonzalez C. C.1 and Burke M. R.2
1 Department of Psychology, Thomson Rivers University, 900 McGill Road, Kamloops, BC, Canada. V2C 0C8; [email protected]; phone (250) 828 5316
2 Department of Psychology, Faculty of Medicine and Health, University of Leeds, U.K. LS2 9JT, UK. [email protected]
Corresponding Author: Dr Melanie Rose Burke, Department of Psychology, Faulty of Medicine
and Health, University of Leeds, LS2 9JT, U.K.
Email: [email protected]
Abstract
Motor sequence learning involves predictive processing that results in the
anticipation of each component of a sequence of actions. In smooth pursuit, this predictive
processing is required to decrease tracking errors between the eye and the stimulus. Current
models for motor sequence learning suggest parallel mechanisms in the brain for acquiring
sequences of differing complexity. We examined this model by comparing shorter versus
longer sequences of pursuit eye movements during fMRI. In this way we were able to identify
overlapping and distinct brain areas involved in simple versus more complex oculomotor
learning. Participants revealed predictive pursuit eye movements from the second
presentation of the stimulus in both short and long sequences. Brain imaging results
indicated activation of parallel brain areas for the different sequence lengths that consisted
of the Inferior Occipital Gyrus and the Cingulate as areas in common. In addition, distinct
activation was found in more working memory related brain regions for the shorter
sequences (e.g. the middle frontal cortex and dorsolateral prefrontal cortex), and higher
activation in the frontal eye fields, supplementary motor cortex and motor cortex for the
longer sequences, independent on the number of repetitions. These findings provide new
evidence that there are parallel brain areas that involve working memory circuitry for short
sequences, and more motoric areas when the sequence is longer and more cognitively
demanding. Additionally, our findings are the first to show that the parallel brain regions
involved in sequence learning in pursuit are independent of the number of repetitions, but
contingent on sequence complexity.
Introduction
Many of our daily activities involve learning new sequences of movements and then
executing this learnt behaviour (Lee & Quessy, 2003). Motor sequence learning involves the
transition from reactive to predictive processing that is associated with skilled behaviour,
resulting in faster, more accurate movements. A good example of this transition is observed
during pursuit eye movements of repeated single velocity ramps, double-step ramps and
sinusoids (Barnes et al., 2000; Barnes & Donelan, 1999; Barnes & Schmid, 2002; Collins &
Barnes, 2005; Wells & Barnes, 1999; Kao and Morrow 1994). The outcome of this learning is
revealed by the early initiation (latency) of the movement, with eye velocity increasing
towards a moving target prior to the brain receiving the information to drive the movement
response (Kowler & McKee, 1987). Furthermore, prediction in pursuit results from the
learning of not only timing, but also direction and velocity of the up-coming stimulus
presentation (Barnes & Donelan, 1999; Wells & Barnes, 1999). This type of learning is often
known as prediction and is inherent to all motor systems, providing compensation for the
delays in internal neural processing in the brain. The pursuit system provides an excellent
model for investigating early motor learning (such as those used for sequence learning) with
the benefits of clear measurable behavioural markers of the acquired sequence.
A number of previous studies have shown that the learning of new motor sequences
involves activation in prefrontal, premotor, anterior cingulate, and parietal brain areas
(Jenkins, Brooks, Nixon, Frackowiak, & Passingham, 1994; Jueptner et al., 1997). In support
of these findings Toni, Krams, Turner, and Passingham (1998) were the first to study the
time-course of motor learning using fMRI and found that the dorsolateral prefrontal cortex
(DLPFC), anterior cingulate and dorsal premotor cortex are involved in early learning of an 8
finger sequence. However, activity in these areas decreased as learning progressed, with a
differences in activation across brains region during learning are a result of increased
efficiency in the brain (Koch et al., 2006; Schmid, Rees, Frith, & Barnes, 2001), facilitating the
acquisition of more complex motor skills. This activation of different brain regions seems to
reflect distinct learning stages (early versus late), but also, different aspects of learning such
as speed or accuracy (Hikosaka, Rand, Miyachi, & Miyashita, 1995; Rand et al., 2000).
One way in which motor learning can be classified is via a serialprocess when the
flow of information shifts from spatial memory to the development of a motor skill via serial
sensorimotor transformations. Another possibility of learning in the brain is via parallel
processing, whereby spatial and motor information are acquired independently and
processed in parallel (Alexander, DeLong, & Strick, 1986; Hikosaka et al., 1999). Hikosaka et
al (1999) proposed that serial processing may apply to simple movements, such as reaching,
but that this serial process would be repetitive and inefficient for more complex sequences of
actions. To optimise these demanding brain computations, Hikosaka et al. (1999; 2002; Sakai
et al., 1998) proposed a motor learning model that supports the notion that prior to learning
a sequence, performance relies on the sensorimotor information flow (serial sensorimotor or
visual-to-motor processing and is predominantly a form of spatial memory However, with
practice, performance becomes non-reliant on this serial sensorimotor transformation and is
taken over by two parallel acquisition mechanisms: 1) an explicit short-term spatial
coordinate system; and 2) an implicit longer-term motoric storage system. The acquisition by
the spatial sequence process occurs early (in the order of milliseconds) and is highly flexible,
relying on attention and working memory mechanisms. Acquisition achieved by the motoric
system occurs more slowly (i.e. minutes/hours), and in the later stages of learning (i.e.
days/months) performance retains speed without awareness (Hikosaka et al., 1999, 2002).
There is a gradual shift between these parallel sequential processes from the initial fast
activation in monkeys) towards motor cortices in later stages (automatic movements).
Consistent with (ikosaka et al s (1999, 2002) findings in humans and non-human primates,
Sakai et al.s (1998) fMR) study also describes a transition between an early declarative stage
of learning in frontal brain areas (DLPFC and pre-SMA), to a later more procedural learning
stage in parietal brain regions (precuneus and intraparietal sulcus).
One important feature of the model described here, is that the learning of a sequence
occurs via spatial and motor mechanisms independently and each system has its own
input-output (spatial or motor coordinates). However, accurate and quick performance of a
sequence means that the two parallel sequence process must communicate (possibly in
pre-SMA or PMA), ideally with the spatial sequence guiding the motor sequence (Hikosaka et al.,
1999). However, Hikosaka et al (1999) noted that the parallel arrangement means that a
sequence can be acquired by either of these mechanisms (initiated by spatial or motor
mechanisms), thus, a sequence might be acquired rather implicitly by the motor sequence
mechanism, as with implicit SRT learning (Pascual-Leone, Grafman, & Hallett, 1994).
Additionally, when disrupting the motor sequence process the spatial process may continue
to acquire the sequence, but with errors (e.g., SMA, Hikosaka, Miyashita, Miyachi, Sakai, & Lu,
1998). Nakahara, Doya, and Hikosaka (2001) examined neural network models of sequence
learning and also found that the parallel (independent) systems required communication or
a monitor pre-SMA) but that subsequent manipulations of the model suggested that the
model is robust even if one mechanism fails (or it is destroyed), as the other can take over
and still learn the sequence although not perfectly (i.e., implicit or motor vs. explicit or
spatially accurate).
In smooth pursuit tracking, the reactive to predictive transition into a steady state
occurs quickly (after a single presentation) when implementing repeated short sequences of
memory requirement needed for such a simplistic task. However, the question still remains
as to how the system copes with more complex sequences of actions that require enhanced
attention and go beyond the short-term memory (prediction) buffer capacity (see Collins and
Barnes 2005). Collins and Barnes (2005) found that the predictive drive in smooth pursuit is
optimal during short sequences, but is affected by increased cognitive load (added ramps to
a sequence), resulting in learning at a slower rate. They suggested this slower learning may
reflect the additional working memory requirements, but that learning was indeed possible
in the more complex sequences. This finding provides evidence of the robustness of the
sequence learning processing. However, it is still unclear whether the learning of complex
sequences results in a slower, spatial to motor serial transition, or alternatively the system
immediately implements a more implicit (slower) motor mechanism to acquire the sequence.
Furthermore, previous studies have shown areas involved in very short term predictive
mechanisms, including frontal eye fields (FEF), supplementary eye fields (SEF), dorsolateral
prefrontal cortex (DLPFC) and anterior cingulate cortex (ACC) (Burke & Barnes, 2008; Ding,
Powell, & Jiang, 2009; Lencer et al., 2004; Schmid et al., 2001); but have failed to examine
longer more complex sequence lengths. Thus, knowledge of how prediction in the early stages
of learning is used for more complex motor skills acquisition is not yet understood.
The present study aimed to identify the brain areas involved in sequence learning in
oculomotor tracking, by addressing a previously unexplored effect of varying sequence
length on the BOLD activation in these areas of interest. Our study differs from previous
studies in that we compared learning in short (4 ramp) and long (8 ramp) sequences of eye
movements using directly comparable stimuli, where only the sequence length (i.e., number
of ramps) varied within the fMRI scanner. Furthermore, based on previous studies
(mentioned above) we predict the outcome will show distinct parallel circuitry for the
The present study used a novel paradigm to examine early (explicit) motor learning in the
brain by inducing visuomotor learning of a 4 or 8 continuous target sequence in smooth
pursuit. In this way we avoided effector-related learning that may have occurred in previous
studies in more motor specific regions (such as the hand in a finger tapping task). In addition,
our sequences were presented in a more ecologically valid way that better represent linked
sequences of actions compared to single ramps. Our approach was different to previous
studies that have investigated brain activation to a single repeated motion of a smoothly
moving target (e.g. Ding et al., 2009; Schmid et al., 2001), which are linked to anticipation
(rather than learning). It is clear these previous studies have focussed on interrogating the
early serial processing model as introduced by (ikosaka and colleagues in 1999. In contrast,
the focus of the current study was to examine how the parallel model is altered by
implementing more complex sequences of eye movements. To avoid confounds we matched
precisely the temporal and spatial (visuomotor) properties of the stimulus between the
sequence lengths, and contrasted a novel (1st presentation of the sequence) to an early acquisition (4th repetition) of that same sequence within the design.
Methods
Participants
Twelve participants took part in the study and were included in the final analysis.
Participants were aged between 22 to 34 years old (9 females, mean age 26.1 years, SD 3.83)
with normal or corrected-to-normal vision and no known neurological conditions. All
participants were university students with the same educational status, and successfully
completed the medical history questionnaire resulting in no exclusions. All participants were
1) a behavioural testing session in the visuomotor laboratory (Leeds, UK), and 2) an fMRI
scanning session (Salford Hospitals, Manchester, UK) approximately 1 week apart. This study
was approved by the Salford Royal NHS ethical committee and by The University of
Manchester and Leeds ethical committees and conducted in accordance with the standards
laid out in the 1964 Declaration of Helsinki. All participants gave informed written consent
and completed a medical history questionnaire prior to the experimental sessions. Please
note that all participants also performed an additional block of saccadic eye movements
within the fMRI and laboratory sessions. This saccadic data alongside the 4 PRD pursuit data
have been reported elsewhere (Gonzalez, Billington, & Burke, 2016) to address the question
of the different eye movement types on brain activation during sequence learning.
Laboratory experimental set-up
The first experimental session took place in a dark room and participants were seated,
with their heads stabilized by a forehead-and-chin rest (EyeLink, SR Research Ltd, Canada).
Eye movement data was sampled at 1000 Hz and the visual stimuli were created using
custom-made programs (Psychtoolbox version 3.0.9 for Matlab®, Mathworks, USA)
(Brainard, 1997) and presented on a computer screen ( CRT colour monitor, 1024 by 768
pixel resolution, 75Hz, mean luminance of 50 cd/m2), positioned 57 cm in front of the participant. A nine-point (3 x 3 target array) eye movement calibration took place prior to
each of the 4 experimental blocks presented in this study (plus 1 saccade block published
previously: Gonzalez, Billington and Burke, 2016) to ensure accurate eye measurements
throughout. Rest breaks were given between each block, in which the lights were turned back
on in order to avoid dark adaptation and fatigue. The experimental sessions lasted for
MRI Experimental Set-up
In the second experimental session the same paradigm was also employed within an
fMRI scanning system. A custom-made program was used to design new sequences and
display the stimuli for the scanner session (Psychtoolbox, Brainard, 1997, and COGENT,
www.vislab.ucl.uk, Matlab®, Mathworks, USA), similar to the one used for the laboratory
session. Data was collected using a 3T (Phillips 3.0 T Achieva) MRI scanner with an
eight-channel SENSE head-coil (Achieva 3.0 T Neuro Coil) designed to reduce the signal-to-noise
ratio. A T1-weighted anatomical image (256 x 256 x 176, voxel size = 1mm3) was obtained prior to the 4 functional imaging blocks (plus 1 saccade block published previously, Gonzalez,
Billington and Burke, 2016). Scans were collected using T2*-weighted spin echo pulse
sequence (TR of 2000ms, TE of 30ms; 90° flip angle, FOV of 250 mm, 1.8 x 1.8 x 4 mm3 voxel size and a total of 30 slices) covering the whole brain. An optical video eye tracker (Applied
Science Laboratory, Bedford, MA) with a sampling rate of 60 Hz was used to inspect eye data
during scanning to ensure correct task performance. Two mirrors were positioned on the
head coil, one to reflect an image of the eye to the ASL video camera, and the second to reflect
an image of the stimulus from the projector screen (size: 180cm x 110cm, temporal
resolution: 75Hz) located at the participant s feet to the participant. The 4 experimental
blocks were counterbalanced between participants and new sequences were implemented to
avoid learning between sessions. As in the first session, nine-point eye calibrations took place
in the scanner prior to each experimental block and the room was kept as dark as possible
during testing with the experimental session lasting approximately 60 minutes. Each
experimental block contained 212 volumes with the first two volumes excluded as dummy
runs. None of the blocks were found to exceed 2mm movement in any direction and no
erroneous image artefacts were observed and hence all data was included in the further
Stimulus
The target (white square, 15 x 15 pixels) started at the centre of the screen and then
moved smoothly in one of four directions (left, right, up or down) to build sequences of 4 or
8 constant speed (15°/s) ramps (see Figure 1). Each sequence consisted of 4 or 8 smoothly
moving components (ramps), linked to generate a continuous motion target for subjects to
follow with their eyes. The short (4 components) and long (8 components) sequences were
presented in two conditions: random (RND) and predictive (PRD). The PRD sequence
learning task consisted of a sequence (4 or 8 components) that was repeated 4 times in a row.
In the RND condition, all sequence combinations (4 or 8) were unique. Experimental blocks
(2 sequence lengths x 2 conditions) were counterbalanced between participants and
consisted of: (i) 4 component RND sequences (4RND), (ii) 4 component PRD sequences
(4PRD), (iii) 8 component RND sequences (8RND), and (iv) 8 component PRD sequences
(8PRD). The duration of each component (ramp) was set at 750 ms in the PRD condition and
thus, the 4 and 8 component PRD sequences were 3000 ms and 6000 ms in duration
respectively. The duration of each component was randomised between ~500, ~750 and
~1000ms in the RND sequences while still maintaining a 3000ms and 6000ms duration for
the 4 and 8 component RND sequences respectively (Figure 2). All participants performed
the same sequences within each block and instructions were to follow the moving target as
accurately as possible with their eyes only. A 1000ms inter-trial interval was implemented
between each sequence, and a 3000ms or 6000ms fixation was also introduced between each
set of 4 sequences for the 4 and 8 component sequences respectively. A repetition in this
context refers to the repeated presentations of the same sequence in the PRD condition only,
of which there were 4 repetitions of a single sequence for both the short and long component
sequences. The 4 blocks were presented pseudo-randomly to each participant with 80 unique
times in a row in 4PRD, 40 unique sequences in 8RND and 10 unique sequences presented 4
times in a row in the 8PRD block. Each block had a duration of ~6 minutes. Although the same
experiment from the laboratory session was repeated for the fMRI session, new PRD and RND
sequences were designed for this fMRI session and thus (short-term) sequence learning of
the short and long PRD sequences was examined in both sessions to new repeated sequences.
Analysis
Eye Data
Eye movement data was sampled at 1000 Hz and initially pre-processed using the
Data Viewer software (SR research Ltd, Canada). This pre-processing involved removing
blinks and bridging the gaps within the missing data using linear interpolation. Eye velocities
were analysed using a custom made programme in Matlab® (version 7.8, Mathworks Inc.,
USA). Intrusive and catch-up saccades were eliminated from the smooth pursuit eye
movement data using a previously described linear interpolation technique to link the
resulting gaps (Bennett & Barnes, 2003). The velocity traces were then filtered using a 10Hz
low-pass, zero phase filter. Eye movement data were also obtained from the scanning
environment (60Hz), which revealed an identical pattern of responses from the participants
during all conditions (i.e. prediction shows earlier onsets than the random condition),
although the signal was significantly noisier. For the purpose of clarity, we will present only
the laboratory based data within this section (see Gonzalez, Billington, & Burke, 2016 for
examples of eye data inside and outside the scanner in supplementary material).
A cross-correlation analysis was performed on the pre-processed eye and target velocity
traces as a global temporal assessment to calculate the overall differences in time between
eye movements and the target stimulus for PRD and RND sequence trials (for previous
implemented due to the fact that pursuit onsets of a continuous eye movement to multiple
components (ramps) can be problematic to identify, as the eye velocity at the start of each
ramp is influenced by the decaying response to the prior ramp (Barnes & Schmid, 2002) (see
Figure 2). Thus, the cross-correlations between the target and eye movements of each
sequence were performed to obtain the overall temporal delays from the target for RND and
for each repeated PRD sequence (SEQ1, SEQ2, SEQ3 and SEQ4). The time at which the
maximum correlation was reached (tCOR) was calculated and used to describe the time delay between the eye velocity during the repeated sequences and the corresponding moving
stimulus. Eye velocity X and Y traces were combined to create a single eye velocity trace,
which was used to compare with the target velocity (see Figure 2). This resulted in a tCOR value independent of direction.
A repeated measures ANOVA (IBM SPSS statistics, version 20, NY, USA) with 2 levels was used
to identify significant differences for the 4PRD and 8PRD conditions (level 1) and between
the identical sequence presentations (level 2: SEQ1, SEQ2, SEQ3 and SEQ4). Interactions
between variables were evaluated using a Bonferroni corrected post-hoc t-test. A significance
level of P < 0.05 was established for all statistical analyses. Results and graphs are expressed
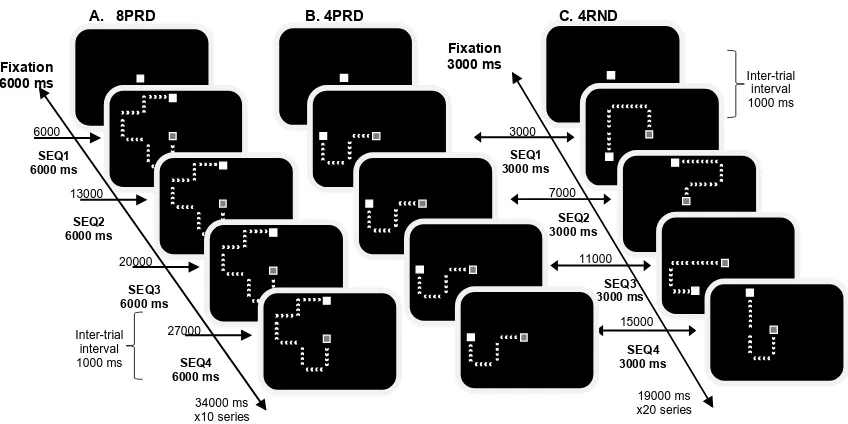
Figure 1. Examples of sequence presentations for the 8PRD (A, left), 4PRD (B, middle) and
4RND (C, right) experimental blocks. In PRD conditions (A and B), each sequence was
repeated 4 times following a fixation and all sequences started in the centre of the screen. In
RND conditions, each sequence was unique (C). Each series of 4 repeated sequences and 4
unique sequence presentations (i.e., SEQ1, SEQ2, SEQ3 and SEQ4) started with a fixation of
equal duration to the sequence trials (6000 ms and 3000 ms for the long and short sequences,
respectively). A 1000 ms inter-trial interval was implemented between each sequence and
between a fixation and a sequence. Participants performed 10 series of the long sequences
(40 sequences + 10 fixations in total) and 20 series in the shorter sequences (80 sequences +
20 fixations in total). Stimuli were designed for schematic purposes and are not to scale.
34000 ms x10 series 27000 20000 13000 6000 Inter-trial interval
1000 ms SEQ4 6000 ms SEQ3 6000 ms SEQ2 6000 ms SEQ1 6000 ms Fixation 6000 ms 19000 ms x20 series 15000 11000 7000 3000 SEQ4 3000 ms SEQ3 3000 ms SEQ2 3000 ms SEQ1 3000 ms Fixation 3000 ms
A. 8PRD B. 4PRD C. 4RND
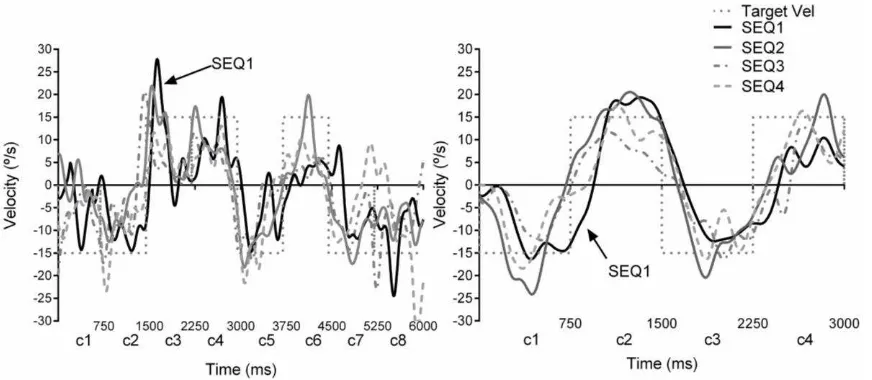
Figure 2. The graphs show examples of eye velocities to the repeated sequences, across a 8
(A, left) and 4 (B, right) PRD sequences. Each component (ramp) lasted for ~750ms and
resulted in 6000ms and 3000ms sequences in the 8PRD and 4PRD trials respectively. The eye
velocity traces show temporal shifts of the repeated sequences (SEQ2, SEQ3 and SEQ4, grey
and dotted traces) towards the target (dotted squared trace), compared to the first sequence
(SEQ1, black line). All sequences started in the centre of the screen or zero position, thus the
velocity of each component shows upward, rightward (15°/s), downward or leftward
(-15°/s) directional changes.NB c1, c2, etc. denote the components within a sequence; c1 to c4
for the 4PRD sequences and c1 to c8 for the 8PRD sequences.
fMRI
Data was pre-processed in the standard way using BrainVoyager QX version 2.8
(Brain Innovations B.V. Maastrict, the Netherlands), and included; slice time correction,
motion correction, spatial realignment, co-registration with individuals anatomical images,
normalized and transformed into Talairach space (Talairach Daemon software,
http://www.nitrc.org) (Lancaster et al., 2000). Finally, data was filtered using a temporal
Gaussian kernel with a FWHM of 8mm. No participant exceeded the cut-off of 2mm in any
direction for head motion and so were included in the final analysis.
We used a general linear model to gain estimates of voxel activation to each condition (4PRD,
4RND, 8PRD and 8RND). The regressors in the design matrix were boxcar functions designed
to model the activity during each sequence (3s or 6s seconds for 4 and 8 sequence lengths
respectively) with the fixation also modelled independently (also 3 or 6 seconds). These
boxcar functions were then convolved with an individual estimate of the haemodynamic
response function.
We extracted the mid-sequences from each trial (2nd and 3rd presentation within the set of 4 sequences) and for each participant (1st level analysis) for both the RND and PRD conditions. We then did a 2nd level contrast of the resultant RND versus PRD data (group level) in order to identify areas important for sequence learning (PRD condition) and remove
low level visual processing (RND condition). After applying a threshold of t >= 3.5 and cluster
size > 20 (based on previous studies: Gonzalez et al., 2016) and a FWE (p < 0.05) to correct
for multiple comparisons, we identified a number of regions of interest (ROIs) that confirmed
our previous a priori findings (Gonzalez et al., 2016). From these regions of interest, we
extracted normalized beta weights for each participant from the first (1st sequence) and final (4th) repetition of each sequence within the PRD condition (as reported in figures 4-7). We used this method to try and avoid any circulatory bias in our data when extracting beta
weights allowing more accurate comparisons of reactive (SEQ1) and predictive (SEQ4)
behaviour. Although we accept that since the ROI are from the 2nd and 3rd sequences a greater bias towards the predictive weighting will be predicted. Finally, regression analyses were
performed to compare beta weight activation of each ROI during SEQ1 and SEQ4, with the
Separate regressions were also performed between common ROI beta weights for short and
long sequences.
Results
Eye movements
Cross-correlation analysis revealed that the temporal delays of the eye velocities from
SEQ1 in PRD conditions compared with the overall RND responses were not statistically
different in either the short (p = 0.3) or long (p = 0.24) sequences. Thus, the first presentation
of a sequence (SEQ1) in PRD conditions was determined as a reactive response in both
sequence lengths. A repeated measures ANOVA was then used to compare between this SEQ1
and the repeated sequences and within PRD sequence repetitions (SEQ2, SEQ3 and SEQ4)
and determine learning effects, both within and between the sequence lengths (4PRD vs.
8PRD).
Cross-correlations: temporal shifts
Analysis revealed a significant interaction between repetition and sequence length
(F(1, 11)= 5.106; p = 0.04). Post hoc tests revealed a decrease in tCOR values of the repeated sequences (SEQ2, SEQ3 and SEQ4) compared to SEQ1 in the 4PRD condition (all p < 0.001),
however, there were no differences between the repeated sequences (p = 1.0, p = 1.0 and p =
0.59 for SEQ2, SEQ3 and SEQ4 respectively) (Figure 3, left).
Similar to the 4PRD, the 8PRD sequences all had shorter tCOR values compared to SEQ1 (all p < 0.001), but with no differences between the repeated sequences (p = 1.0, p = 0.15 and
p= 0.06 for SEQ2, SEQ3 and SEQ4 respectively) (Figure 3, right). Post hoc tests also showed
confirming participants were performing equally regardless of sequence length to the
random trials. Differences were evident between the sequence lengths in the repeated
(predictable) sequences (p = 0.018, p = 0.04 and p = 0.005 for SEQ2, SEQ3 and SEQ4
respectively), with shorter temporal lags (aka better prediction) in the 4PRD sequences
(mean across repetitions = 75.7 ± 18.8 ms) than the 8PRD (mean across repetitions = 91.8 ±
17.2 ms).
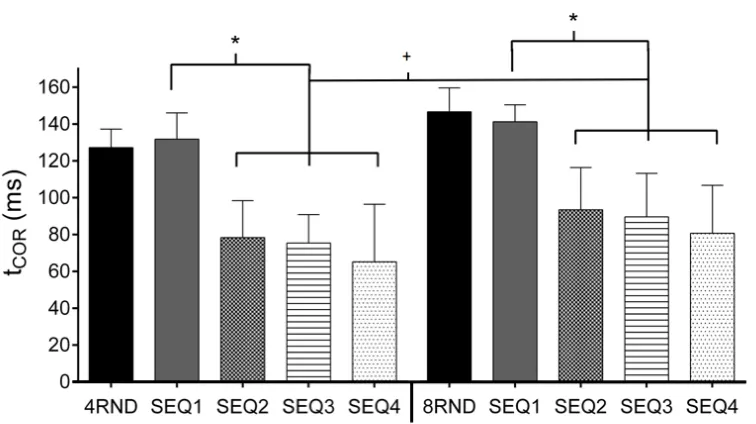
Figure 3. The Mean (and SD) tCOR values of the blocked 4 component tasks (left) and 8 component (right) sequences for all participants is shown for both RND (solid colour bars)
and repeated PRD (patterned bars) conditions. The first presentation of the predictive
sequence (SEQ1; solid grey column) was determined as reactive with no significant
differences between these responses and the RND responses (solid black bar) in either
sequence length condition. Both graphs show that eye velocities of the repeated sequences
(SEQ2, SEQ3 and SEQ4) had shorter temporal delays (closer to the target) compared to SEQ1,
[image:18.612.115.493.242.454.2]component sequence condition showed smaller tCOR values compared to the repeated 8 component sequences (+, p < 0.05).
fMRI results
We performed contrasts between overall PRD and RND conditions, identifying basal
ganglia (BG) and frontal regions (BA 11, BA 9) for random sequences and inferior occipital
gyrus (IOG), frontal eye fields (FEF), cerebellum (CBM), anterior cingulate cortex (ACC), as
well as motor regions and the inferior parietal lobe (IPL, BA40) for predictive sequences
(Table 1). In addition, contrasts between the overall short versus long sequences (4SEQ vs.
8SEQ) resulted in activation, at a threshold of T>3.5, of frontal (BA9, BA8), motor (BA4, M1)
and inferior occipital gyrus (IOG) for shorter sequences, whilst higher activation in BG and
the subcortical areas of the anterior cingulate cortex (ACC) and the parahippocampus (PHC)
[image:19.612.89.513.542.710.2]were observed during the longer sequences, see (Table 1).
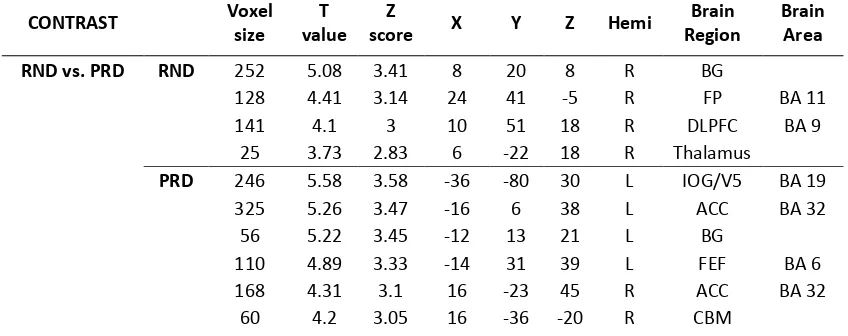
Table 1: The table reports the overall significant effects from the group level (RFX analysis)
to the RND versus PRD and 4 versus 8 sequence (SEQ) conditions, showing the number of
voxels; T value; x, y and z coordinates of peak activation; Hemisphere (Hemi); Brain region
and Brodmann Area. The cut-off used was T > 3.5.
CONTRAST Voxel size
T value
Z
score X Y Z Hemi
Brain Region
Brain Area
RND vs. PRD RND 252 5.08 3.41 8 20 8 R BG
128 4.41 3.14 24 41 -5 R FP BA 11 141 4.1 3 10 51 18 R DLPFC BA 9
25 3.73 2.83 6 -22 18 R Thalamus
PRD 246 5.58 3.58 -36 -80 30 L IOG/V5 BA 19 325 5.26 3.47 -16 6 38 L ACC BA 32
56 5.22 3.45 -12 13 21 L BG
110 4.89 3.33 -14 31 39 L FEF BA 6 168 4.31 3.1 16 -23 45 R ACC BA 32
190 4.18 3.04 42 -78 26 R V5 BA 19 111 4.18 3.04 -12 -11 50 L SMA BA 6
52 3.87 2.9 40 -2 28 R SMA BA 6 100 3.61 2.77 -44 3 13 L IC BA 13 135 3.53 2.73 -50 -37 46 L IPL BA 40
4SEQ vs. 8SEQ 4SEQ 3794 7.27 4.07 30 -76 -3 R IOG/V5 BA 19 204 5.61 3.59 -18 39 35 L DLPFC BA 9 153 3.92 2.92 36 -16 39 R PCG BA 4
160 3.62 2.77 -26 9 35 L FEF BA8
8SEQ 60 4.22 3.06 -24 -46 8 L PHC BA 30 104 3.7 2.81 40 -26 -14 R PHC BA 36
45 3.67 2.8 16 -14 23 R BG
32 3.66 2.79 -16 -16 39 L ACC BA 24 X, Y and Z correspond to Talairach coordinates in mm. BG= basal ganglia; FP= fronto-polar; DLPFC=
dorsolateral prefrontal cortex; IOG= inferior occipital gyrus; ITG= inferior temporal gyrus; SMA=
supplementary motor area; FEF= frontal eye fields; IC= insular cortex; IPL= inferior parietal lobe; PCG=
precentral gyrus; PHC= parahippocampus, ACC= Anterior Cingulate, CBM= cerebellum.
ROI results
We contrasted sequence 2 and 3 of each set of PRD tasks, with RND sequences for the 4
and 8 component sequence tasks individually. This was done to identify which areas of the
brain are principally involved in sequence learning during our predictive tasks and for each
sequence length and to remove activation related to low level visual processes (as observed
for the RND condition). Please note, since these ROIs were generated using specific sequences
within the 4PRD and 8PRD tasks only, these regions are not the same as the global activations
observed in Table 1, but do show considerable overlap. We found some regional similarities
for the different sequence lengths, but also identified a number of distinct activations.
Regional commonality for both the 4 PRD and 8 PRD sequence tasks included: the inferior
occipital gyrus (IOG/BA19) and parts of the cingulate cortex. Areas that revealed more
activation for the shorter 4PRD were more rostral in location (PCC/BA31), whereas the
frontal lobe for both sequence lengths, however, these corresponded to distinct sub-regions
of the prefrontal lobe for 4PRD (DLPFC/BA9 and middle frontal gyrus/BA10) and 8PRD
(FEF/BA6) respectively. In addition, we found brain areas that were more active in the
learning of the 8 component sequence learning task when compared to the shorter sequences
along the precentral gyrus (BA4 and 6) related to motor and premotor areas.
Areas for both Short and Long Sequences:
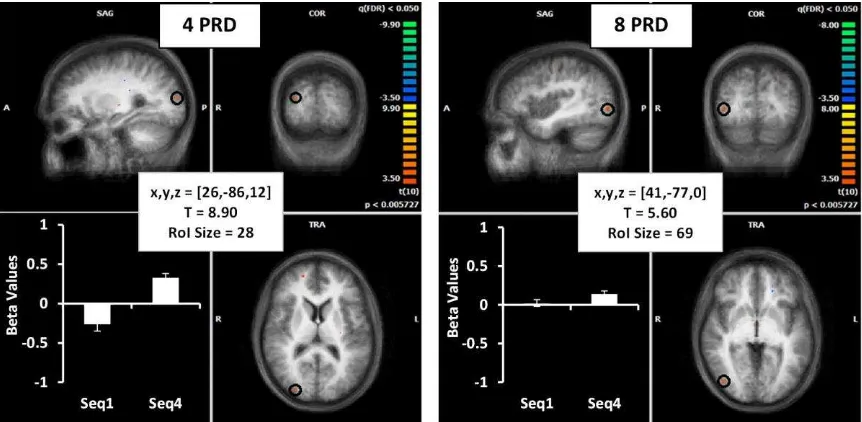
(i) Inferior Occipital Gyrus (IOG)
We found the IOG to be involved in both the shorter and longer sequence learning tasks, when
compared to the 1st presentation of the predictive trials (behaviourally equivalent to the random condition). Both sequence lengths revealed right hemisphere activation above
threshold during learning in BA19. A regression analysis revealed a significant relationship
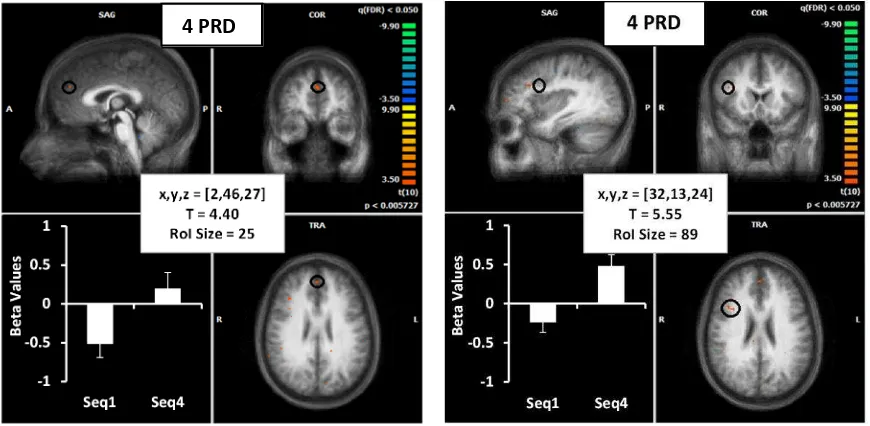
Figure 4. Brain images show location of activation (from seq 2-3) in red (highlighted with a
black circle) for the 4PRD (left) and 8PRD (right) task on an averaged brain of all participants.
In addition, corrected average beta weighting across all participants (for the 1st and 4th sequence) are presented in the lower left corner of each image for the first (SEQ1) and final
sequence (SEQ4). Details of Talairach coordinates, T value and cluster size are given in the
central white boxes.
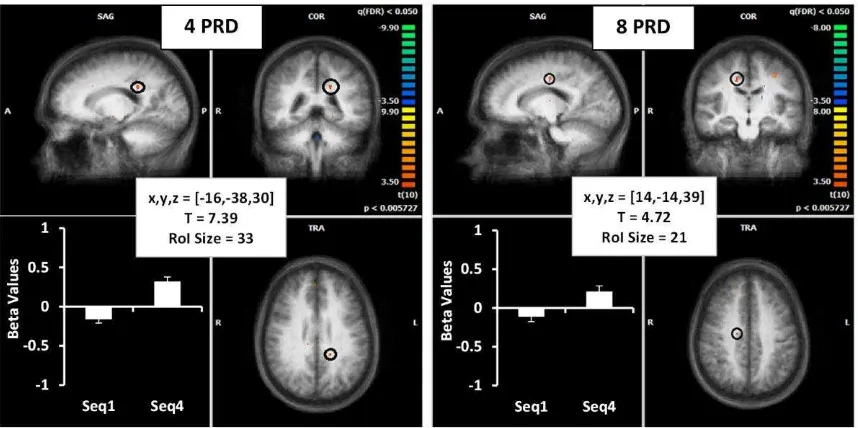
(ii) Cingulate
The cingulate was also identified as an important structure for the learning of sequences,
however shorter sequences revealed a more posterior location (PCC, BA31) (Figure 5, left)
and longer sequences were more anterior (ACC, BA24) (Figure 5, right). Regression analysis
between ACC beta weights and tCOR values showed a higher R2 for ACC in the longer sequences during the 4th repetition; however, this did not reach statistical significance (R2 = 0.24, p = 0.08). Additionally, regression analysis between short and long sequence beta weights in this
region was also not found to be significant during the 4th repetition of the sequence (R2 = 0.27,
Figure 5. Convention for image is the same as figure 3: activation for the 4PRD (left) and
8PRD (right) from sequence 2 and 3 is shown. The activation in the posterior cingulate
(BA31) is shown for the shorter sequence in red (with a black outline) on the left image and
the ventral anterior cingulate (BA24) found in longer sequences is highlighted on the right
image. Averaged beta weights (for the 1st and 4th sequence) are displayed in the graphs on the lower left quadrant of each image and details of regions of interest (ROI) are presented in the
box in the centre. Details of Talairach coordinates, T value and cluster size are given in the
central white boxes.
Activation for Longer Sequences
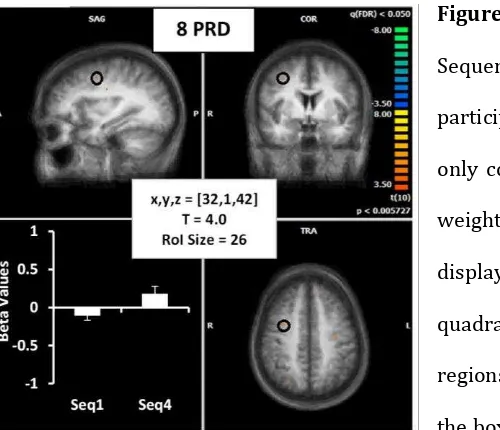
(i) Frontal Cortex
The frontal cortex was found to be involved in motor learning for both the shorter and longer
sequence lengths. However, longer sequences (Figure 6) revealed greater activation
Figure 6. As above, activation (from
Sequence 2 & 3) in frontal cortex for all
participants to longer sequences (8PRD)
only corresponding to FEF. Averaged beta
weights (for the 1st and final sequence) are displayed in the graphs on the lower left
quadrant of each image and details of
regions of interest (ROI) are presented in
the box in the centre of each image. Details
of Talairach coordinates, T value and cluster size are given in the central white box.
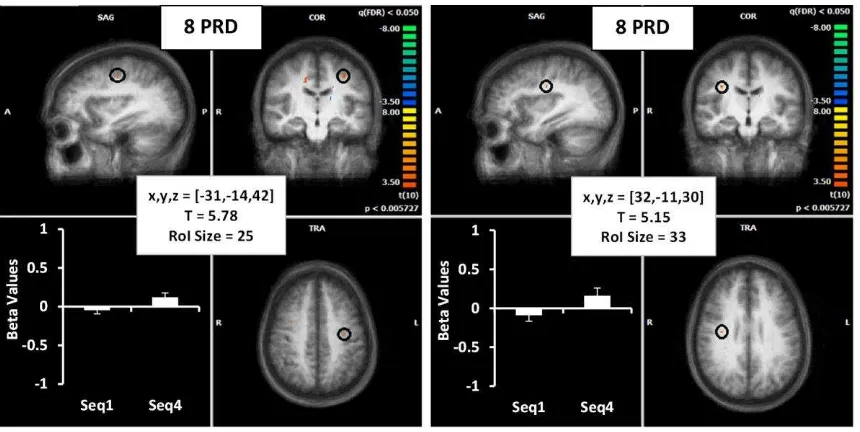
(ii) Precentral Sulcus
In addition to areas in common for shorter and longer sequence lengths, we also found
bilateral activation in the precentral gyrus that was specific for longer (8PRD) sequences. In
the right hemisphere of the motor cortex (BA4), whereas in the left hemisphere the activation
was more towards the midline (between middle frontal and precentral gyrus) and identified
as part of the supplementary motor area (SMA, BA6). A regression analysis revealed a
[image:24.612.98.348.72.287.2]Figure 7. The brain images show the mean activation for the 8PRD task from all participants
in the supplementary motor area (SMA, BA6) (left image) and the motor cortex (BA4) (right
image). Beta weights for these ROIs are displayed in the lower left quadrant of each image.
Details of Talairach coordinates, T value and cluster size are given in the central white boxes.
Activation for Shorter Sequences
(i) Frontal cortex: Middle Frontal Gyrus and Dorsolateral Prefrontal Cortex
Short sequences revealed more prefrontal activity in the dorsolateral prefrontal cortex
(DLPFC) (Figure 8, left). Additionally, shorter sequence lengths revealed one area (that did
not reach above threshold for the 8 sequence task) that was identified as an anterior and
medial part of the prefrontal cortex, known as the frontopolar cortex (BA10) (Figure 8, right).
Despite this, a regression analysis failed to find a significant relationship between the beta
Figure 8. The brain image shows the average activation location for the 4PRD task (in red
with a black circle) overlaid on an averaged brain from all participants. Activation of DLPFC
is shown on the left and frontopolar cortex (BA10) on the right, corresponding to the shorter
sequences. The averaged (normalized) beta weights are shown in the lower left quadrant and
details of the ROI displayed in the centre of the image. Details of Talairach coordinates, T
value and cluster size are given in the central white boxes.
Discussion
Prediction in pursuit serves as an excellent example for early learning in the brain,
since it has also been shown to contribute to the learning of more complex trajectories
(Barnes & Schmid, 2002; Burke & Barnes, 2008; Collins & Barnes, 2005; Gonzalez et al., 2016).
In the current study we aimed to identify the brain areas that aid the understanding of how
sequence length affects brain activity by implementing a shorter sequence of eye movements,
to more complex sequences that can be used for more naturalistic motor learning skills such
as playing the piano or writing. To achieve this, we designed a task that involved participants
following a sequence of smoothly moving targets of either 4 or 8 continuous ramps in
predictive and random conditions. In addition, we identified the brain areas of interest based
on previous studies (Burke & Barnes, 2008; Gonzalez et al., 2016), and the contrast between
randomly generated sequences and the predictive sequences independently for the shorter
and longer sequences. Furthermore, we used different sequences to the ones within the block
design to identify levels of activity within these regions of interest to the 1st and last (4th) presentation of the sequence for each sequence length. This novel approach allowed us to
interrogate if parallel (i.e. both spatial and motor circuits are active simultaneously during
acquisition) in both shorter and longer sequence length acquisition, or the shorter versus
longer sequences activate the same (overlapping) brain areas.
Our data revealed clear learning of our continuous velocity sequences, since their
tracking abilities improved rapidly (by the second presentation of the sequence or SEQ2)
regardless of sequence length/complexity. More specifically, the sequences of repeated
targets (PRD) elicited predictive responses by our participants as shown by smaller temporal
lags (tCOR of the eye velocity from the target s velocity in the repeated sequences when compared to the first (reactive) sequence presentation. This indicated that our task was
inducing motor learning and a motor plan of these continuous target motions in the brain, as
found previously in tasks where a series of single ramps (i.e. smooth movement from left to
right) were presented (Burke & Barnes, 2008; Collins & Barnes, 2005). Furthermore, in
support of a previous study by Collins and Barnes (2005), we found a significant difference
between the repeated shorter (4 component) and longer (8 component) sequences with a
shorter temporal lag in the shorter sequence condition. This result indicates that there was
less anticipation occurring in the longer sequences compared to the shorter sequences and
overlapping areas which correspond to pursuit activation (V5 and cingulate cortex), as well
as a distinct brain activations for these different sequence lengths. In particular, we observed
activation in more memory related areas (DLPFC and BA10) during the shorter sequences,
whereas in the longer sequences the activated areas that corresponded to pre-motor and
motor cortex. These results may reflect the behavioural differences observed in the level of
prediction or timing between sequence lengths.
Brain areas for longer versus shorter sequences
M1and SMA: Activation in pre-motor, SMA and motor cortex reflects movement
planning and advance preparation of a movement that are vital when learning a new motor
skill (Georgopoulos, 1994; Pascual-Leone et al., 1994). Hikosaka et al., (1999, 2002) described
the two parallel information processing loops for sequence learning that comprise of the
prefrontal cortex (corresponding to the spatial process), and a motor sequence process that
utilizes the premotor and motor cortices.
The fact that prediction did not reach equal levels and that distinct brain areas were
found active between the two sequence lengths could indicate that different mechanisms are
being used during the early stages of learning that both resulted in predictive behaviour; one
guided by spatial memory and another via implicit motor networks (for review, see Penhune
& Steele, 2012), and thus is ultimately dependent on the task demands. According to the
motor sequence model presented in the introduction (Hikosaka et al., 1999; 2002), early
learning takes place in memory and attention networks involved in the accurate acquisition
of the sequence, whilst motor sequence acquisition takes place in a parallel, but slower
network of brain areas and contributes to longer-term learning and retention. This
hypothesis is supported by findings showing that spatial/sequential components develop
(Penhune & Steele, 2012). Our task explored early learning of both sequence lengths and
revealed more complex longer sequences involved predominantly motor/premotor
activation, whereas shorter sequences utilized frontal activation. However, in contrary to
earlier findings (e.g., Toni et al., 1998) this effect was not contingent on the number of
repetitions (or practice) since both sequence lengths were repeated 4 times. Interestingly we
did not find higher activation in the parietal cortex for the longer sequence length compared
to the shorter, however we did find higher activation in this region (specifically BA40) for
predictive versus random conditions indicating a similar role for this area in both our
learning tasks.
Activity of the motor cortex has not yet been clearly delimited to a specific stage of
learning, with some studies revealing activation in the early stages that decreases with
practice, and others showing activation increasing with practice (Karni et al., 1995; Penhune
& Doyon, 2002). It is possible that the motor cortex could be active in both early and late
stages, and activity is more dependent on the complexity of the task (i.e. if the sequence being
learnt is beyond the scope for WM mechanism in PFC) (Seidler et al., 2005; Wu, Kansaku, &
Hallett, 2004). The parallel sequence learning model, specifies that activity of the motor
cortex and other regions (e.g., cerebellum) could emerge at distinct learning stages depending
on task demands, and that sequence parameters (i.e., velocity, timing and accuracy) may be
optimised over distinct time frames (see Penhune & Steele, 2012) supporting (ikosaka et al s
model.
The fact that there was less prediction observed in the behavioural measures during
the longer sequences may be due to the higher requirements for storage of information (more
components). This is in agreement with the notion of a limited capacity memory buffer in
storing eye velocities as suggested by Collins and Barnes (2005) and the general notions of a
duration this clearly involved a short-term memory system for generating predictive
responses and was supported by the data revealing higher levels of activity within PFC.
However, the longer sequence was 6 seconds in duration and the reliance on this short-term
working memory system was weak (reduced activity in PFC), suggesting an alternative
mechanism for more complex learning. Furthermore, brain areas for more complex
sequences also included the precentral gyrus or more specifically the premotor (BA6) and
motor cortices (BA4), providing new evidence that segregates brain area involvement in the
learning of a task based on the complexity and duration of a stimulus.
Motor areas are not typically reported as core brain areas for pursuit and only a few
researchers have found activation of these areas during predictive conditions (e.g., PMA in
Lencer et al., 2004; pre-SMA in Schmid et al., 2001). The fact that these areas are not typically
found in previous studies using short, repeated ramps (for review see Burke & Barnes, 2008;
Lencer & Trillenberg, 2008) and were not significantly active during our shorter sequences,
may indicate that these motor regions were only needed for more complex sequences of
longer duration. Our findings provide novel insight into how the pursuit predictive
(short-term buffer) system copes with additional sequence components. We further describe how
these brain areas differ below.
Frontal cortex:The prefrontal cortex is commonly reported as an active area during
the initial stages of learning, when decision making, selection of movements, working
memory and attention are required (Halsband & Lange, 2006; Miller, 2000; Miller & Cohen,
2001; Pierrot-Deseilligny et al., 2002). In particular, the DLPFC, active in our shorter
sequences, has been shown to be involved in both the encoding and retrieval of stimuli
information, however right DLPFC is more important for retrieval in-line with the findings
presented here (Halsband & Lange, 2006; Sakai et al., 1998). This area is more typically
also been associated with learning and prediction in pursuit eye movements (Burke & Barnes,
2008; Ding, Powell, & Jiang, 2009; Lekwuwa & Barnes, 1996; Schmid et al., 2001). In addition
to the DLPFC, we found the frontopolar region (BA10) in the rostrolateral prefrontal cortex
was significantly active for the shorter repeated sequences in contrast to the 1st presentation of the predictive task, which was behaviourally equivalent to the randomized condition.
However, this area did not reach significant thresholds in the longer sequence. The orbital
and medial prefrontal cortex are also structures for memory processing (Miller & Cohen,
2001). BA10 has been identified as an area important for executive function and for
anticipatory eye movements (Burke and Barnes, 2008). In Hikosaka et al s
model, the prefrontal cortex (DLPFC) is suggested to be involved in the early stages of
learning in which learning occurs via a spatial mechanism, reliant on attention and working
memory. After longer practice, the procedure will be acquired by the motor sequence
mechanism involving pre-motor and motor cortex, which we observed in the longer
sequences. We expect that continued practice in the shorter sequences, in which these frontal
areas were more prevalent, would show a decrease in DLPFC and FP activity as previously
shown (Burke & Barnes, 2008; Ding et al., 2009; Hikosaka et al., 1999; Koch et al., 2006), and
studies identifying learning-related transitions (e.g., Koch et al., 2006).
We did not observe any pre-frontal activation reaching our thresholds in the longer
sequences, however we did observed activity in the FEF, located in frontal cortex. Classically
FEF is more associated with reactively driven eye movements. For example, Burke and
Barnes ( 2007, 2008) found that FEF was more active for random pursuit, whilst activation
of supplementary eye fields (SEF) corresponded to predictive pursuit, in accordance with
previous studies (Heide, Kurzidim, & Kömpf, 1996; Schmid et al., 2001). However, a brain
stimulation study revealed that predictive pursuit (gain) is controlled by FEF, whilst
Pike O Driscoll . Similarly, Drew and Van Donkelaar (2007) found that SEF was
involved in predictable changes of on-going pursuit and FEF controlled the initiation and
maintenance of pursuit in both predictable and non-predictable pursuit, which may explain
why FEF was not a feature of the shorter predictable sequences (after contrasting 4RND vs
4PRD). Notably, lesions to pursuit FEF have been shown to decrease acceleration, steady state
velocity and seem to hinder predictive eye movements during periodic stimuli (MacAvoy,
Gottlieb, & Bruce, 1991). This suggests a more prevalent role of FEF in the maintenance of
pursuit (also see Fukushima, Fukushima, Warabi, & Barnes, 2013) that are needed during
longer sequence presentations. Other studies have found that the FEF is largely unaffected by
cognitive factors or increased cognitive load (Culham, Cavanagh, & Kanwisher, 2001; Paus,
1996). However, our study suggests that this area is utilized during more complex sequence
acquisitions, and that these types of sequences may form a network with ACC and V5 for the
learning of longer sequences in pursuit.
Regional similarities for both sequence lengths
The pursuit system is efficient at integrating both feedback and prediction, a process
which occurs during visually-guided tracking as well as in predictive pursuit. The brain areas
found here for predictable and non-predictable pursuit is in accordance with previous studies,
but with the addition of prefrontal and cingulate areas during prediction (Burke & Barnes,
2008; Schmid et al., 2001). We isolated activation for the learning of a sequence by removing
visual and motor related effects by performing a contrast with the 1st (reactive) presentation of the sequence. In addition, we examined these areas more closely for comparisons between
the shorter and longer sequence lengths. The data revealed similarities to previously
reported data on prediction with the brain areas involved in sequence learning including: (i)
frontal cortex. However, we also identified distinct sub-regional differences within these
regions for simpler versus more complex sequences. Interestingly, higher cerebellum
activation was observed in the overall for PRD conditions when contrasted with the
randomized trials (Table 1), indicating a role for this area in sequence learning during pursuit
(for review see Lencer & Trillinberg, 2008). However, we did not see differential activation
for the shorter versus longer sequences, indicating complexity does not impact this level of
activity.
V5:The medial temporal lobe is a key area not only for motion perception, but also
for the maintenance of smooth pursuit (for review, see Lencer & Trillenberg, 2008). This area
connects with frontal cortex and in particular, FEF where the motor commands for pursuit
initiation, maintenance and prediction are generated (Fukushima, Yamanobe, Shinmei, &
Fukushima, 2002; Gagnon et al., 2006; Heide et al., 1996). According to non-human primate
studies, V5 receives corollary eye movement information as well as a pursuit command that
corresponds to an efference copy (or motor plan) that is vital for prediction (Barton et al.,
1996). It is however, still not clear how this area aids prediction and/or learning. Dukelow
et al (2001) and Schmid et al (2001) both found that V5 in humans was active during
anticipatory eye movements in the absence of visual targets. Also, Nagel, Sprenger, Hohagen,
Binkofski, and Lencer (2008) examined the cortical mechanisms of visually-guided pursuit
and pursuit during target blanking and found that V5 was important for coding target velocity
important prediction. Similarly, Burke and Barnes (2008) fMRI findings revealed
learning-related activation during predictive eye movements in V5, among other areas learning-related to
prediction in pursuit compared to random target presentations. In the current study the
activation of this area (regardless of sequence length) could be due to the nature of our
continuous sequence presentations. One explanation is that foveal tracking observed in PRD
lengths. Another option is that this area is involved in very early stimulus acquisition (of the
efference copy) and therefore has a role for both the short and longer sequence. Given that
other researchers have found V5 activation related to memory and learning in pursuit and
the fact that V5 was more active during the short sequences, then our suggestion would
support these earlier findings and suggest a principal role for this area early in the learning
pathway, during the acquisition of an efference copy of the target information, that becomes
less important as learning progresses. Indeed, supporting this suggestion is that the
correlations between the tCOR values (eye movements) and the fMRI beta weights suggests a closer correspondence with the shorter when compared to the longer sequence lengths. More
research into the role of V5 in learning is needed to make further conclusions.
Cingulate cortex: The cingulate cortex is suggested to be a higher order structure
involved in motor memory and planning (Schmid et al., 2001) and related to both saccadic
and pursuit eye movements (Gaymard et al., 1998; Haller, Fasler, Ohlendorf, Radue, &
Greenlee, 2008). In pursuit studies, the role of anterior cingulate (ACC) is in the motor
planning and memory of stimulus (timing and trajectory), and very important for predictive
eye movements (Burke & Barnes, 2008; Ding et al., 2009; Schmid et al., 2001). Interestingly,
single cell recordings from Procyk, Tanaka and Joseph (2000) revealed selective activation of
neurons within the ACC for new learning and also for learnt behaviour. Furthermore, Ding et
al (2009) found that both the DLPFC and the ACC increased in activity during visuomotor
tracking of occluded targets. However, they also found a stronger correlation between the
ACC and the FEF in the more predictable conditions (i.e., when tracking visible targets in a
predictable sinusoidal path), whereas higher activation was observed in the DLPFC when the
target was occluded and working memory requirements were higher. Schmid et al (2001)
also found an increase in ACC activation when tracking a more predictable stimulus
shorter sequences, and the ACC/FEF active for complex sequence acquisitions. In addition, as
a novel contribution to the literature we also find shorter sequences tend to active more
posterior cingulated regions (PCC) suggesting a shift in activity for simpler (posterior) to
more complex (anterior) learning in this frontal-cingulate loop.
Conclusion
Our data collectively highlights distinct brain areas involved in motor sequence
learning for the longer versus the shorter sequence options. These results provide new
evidence for the parallel model suggesting that short-term motor learning is an adaptive
process that shifts from prefrontal activation in simpler shorter sequences, to more motor
areas when longer sequence of movements are required, but is independent of number of
repetitions as suggested by earlier studies. This process is possibly equivalent to the initial
stages of learning a new motor skill when individuals are exposed to movements with
differing complexity.
Acknowledgements
We would like to acknowledge Dr Rochelle Ackerley for support in the collection of this data
and programming input, alongside Prof Graham Barnes for his advice and support in the
running of this project.
References
Alexander, G. E., DeLong, M. R., & Strick, P. L. (1986). Parallel organization of functionally
segregated circuits linking basal ganglia and cortex. Annual Review of Neuroscience,
Baddeley, a. (2000). The episodic buffer: a new component of working memory? Trends in
Cognitive Sciences, 4(11), 417 423.
Barnes, G. R., Barnes, D. M., & Chakraborti, S. R. (2000). Ocular pursuit responses to
repeated, single-cycle sinusoids reveal behavior compatible with predictive pursuit.
Journal of Neurophysiology, 84(5), 2340 55.
Barnes, G. R., & Donelan, S. F. (1999). The remembered pursuit task: evidence for
segregation of timing and velocity storage in predictive oculomotor control.
Experimental Brain Research, 129(1), 57 67.
Barnes, G. R., & Schmid, A. M. (2002). Sequence learning in human ocular smooth pursuit.
Experimental Brain Research, 144(3), 322 35.
https://doi.org/10.1007/s00221-002-1050-8
Barton J J Simpson T Kiriakopoulos E Stewart C Crawley A Guthrie B Mikulis D
(1996). Functional MRI of lateral occipitotemporal cortex during pursuit and motion
perception. Annals of Neurology, 40(3), 387 398.
https://doi.org/10.1002/ana.410400308
Bennett, S. J., & Barnes, G. R. (2003). Human ocular pursuit during the transient
disappearance of a visual target. Journal of Neurophysiology, 90(4), 2504 20.
https://doi.org/10.1152/jn.01145.2002
Brainard, D. H. (1997). The Psychophysics Toolbox. Spatial Vision, 10(4), 433 436.
Burke, M. R., & Barnes, G. R. (2007). Sequence learning in two-dimensional smooth pursuit
eye movements in humans. Journal of Vision, 7(1), 5. https://doi.org/10.1167/7.1.5
Burke, M. R., & Barnes, G. R. (2008). Brain and behavior: a task-dependent eye movement
Collins, C. J., & Barnes, G. R. (2005). Scaling of smooth anticipatory eye velocity in response
to sequences of discrete target movements in humans. Experimental Brain Research,
167(3), 404 13. https://doi.org/10.1007/s00221-005-0044-8
Culham, J. C., Cavanagh, P., & Kanwisher, N. G. (2001). Attention response functions:
characterizing brain areas using fMRI activation during parametric variations of
attentional load. Neuron, 32(4), 737 45.
Ding, J., Powell, D., & Jiang, Y. (2009). Dissociable frontal controls during visible and
memory-guided eye-tracking of moving targets. Human Brain Mapping, 30(11),
3541 52. https://doi.org/10.1002/hbm.20777
Drew, A. S., & van Donkelaar, P. (2007). The contribution of the human FEF and SEF to
smooth pursuit initiation. Cerebral Cortex, 17(11), 2618 24.
https://doi.org/10.1093/cercor/bhl169
Dukelow, S. P., DeSouza, J. F., Culham, J. C., van den Berg, A. V., Menon, R. S., & Vilis, T. (2001).
Distinguishing subregions of the human MT+ complex using visual fields and pursuit
eye movements. Journal of Neurophysiology, 86(4), 1991 2000.
Fukushima, K., Fukushima, J., Warabi, T., & Barnes, G. R. (2013). Cognitive processes
involved in smooth pursuit eye movements: behavioral evidence, neural substrate
and clinical correlation. Frontiers in Systems Neuroscience, 7, 4.
https://doi.org/10.3389/fnsys.2013.00004
Fukushima, K., Yamanobe, T., Shinmei, Y., & Fukushima, J. (2002). Predictive responses of
periarcuate pursuit neurons to visual target motion. Experimental Brain Research,
145(1), 104 20. https://doi.org/10.1007/s00221-002-1088-7
Gagnon, D., Paus, T., Grosbras, M.-( Pike G B O Driscoll G A Transcranial
Journal of Neuroscience, 26(2), 458 66.
https://doi.org/10.1523/JNEUROSCI.2789-05.2006
Gaymard, B., Rivaud, S., Cassarini, J. F., Dubard, T., Rancurel, G., Agid, Y., &
Pierrot-Deseilligny, C. (1998). Effects of anterior cingulate cortex lesions on ocular saccades
in humans. Experimental Brain Research, 120(2), 173 83.
Georgopoulos, A. P. (1994). New concepts in generation of movement. Neuron, 13(2), 257
268.
Gonzalez, C. C., Billington, J., & Burke, M. R. (2016). The involvement of the fronto-parietal
brain network in oculomotor sequence learning using fMRI. Neuropsychologia, 87,
1 11. https://doi.org/10.1016/j.neuropsychologia.2016.04.021
Haller, S., Fasler, D., Ohlendorf, S., Radue, E. W., & Greenlee, M. W. (2008). Neural activation
associated with corrective saccades during tasks with fixation, pursuit and saccades.
Experimental Brain Research, 184(1), 83 94.
https://doi.org/10.1007/s00221-007-1077-y
Halsband, U., & Lange, R. K. (2006). Motor learning in man: a review of functional and
clinical studies. Journal of Physiology, Paris, 99(4 6), 414 424.
https://doi.org/10.1016/j.jphysparis.2006.03.007
Heide, W., Kurzidim, K., & Kömpf, D. (1996). Deficits of smooth pursuit eye movements after
frontal and parietal lesions. Brain: A Journal of Neurology, 119 ( Pt 6), 1951 1969.
Hikosaka, O., Miyashita, K., Miyachi, S., Sakai, K., & Lu, X. (1998). Differential roles of the
frontal cortex, basal ganglia, and cerebellum in visuomotor sequence learning.
Neurobiology of Learning and Memory, 70(1 2), 137 149.
Hikosaka O Nakahara ( Rand M K Sakai K Lu X Nakamura K Doya K
Parallel neural networks for learning sequential procedures. Trends in
Neurosciences, 22(10), 464 471.
Hikosaka, O., Nakamura, K., Sakai, K., & Nakahara, H. (2002). Central mechanisms of motor
skill learning. Current Opinion in Neurobiology, 12(2), 217 222.
Hikosaka, O., Rand, M. K., Miyachi, S., & Miyashita, K. (1995). Learning of sequential
movements in the monkey: process of learning and retention of memory. Journal of
Neurophysiology, 74(4), 1652 1661.
Hikosaka, O., Rand, M. K., Nakamura, K., Miyachi, S., Kitaguchi, K., Sakai, K., Shimo, Y. (2002).
Long-term retention of motor skill in macaque monkeys and humans. Experimental
Brain Research, 147(4), 494 504. https://doi.org/10.1007/s00221-002-1258-7
Jenkins, I. H., Brooks, D. J., Nixon, P. D., Frackowiak, R. S., & Passingham, R. E. (1994). Motor
sequence learning: a study with positron emission tomography. The Journal of
Neuroscience: The Official Journal of the Society for Neuroscience, 14(6), 3775 3790.
Jueptner, M., Stephan, K. M., Frith, C. D., Brooks, D. J., Frackowiak, R. S., & Passingham, R. E.
(1997). Anatomy of motor learning. I. Frontal cortex and attention to action. Journal
of Neurophysiology, 77(3), 1313 24.
Karni, A., Meyer, G., Jezzard, P., Adams, M. M., Turner, R., & Ungerleider, L. G. (1995).
Functional MRI evidence for adult motor cortex plasticity during motor skill
learning. Nature, 377(6545), 155 158. https://doi.org/10.1038/377155a0
Koch, K., Wagner, G von Consbruch K Nenadic ) Schultz C Ehle C Schlösser R
(2006). Temporal changes in neural activation during practice of information
retrieval from short-term memory: an fMRI study. Brain Research, 1107(1), 140 50.