Kearns, Hayleigh and Goodacre, Royston and Jamieson, Lauren E. and
Graham, Duncan and Faulds, Karen (2017) SERS detection of multiple
antimicrobial-resistant pathogens using nanosensors. Analytical
Chemistry, 89 (23). pp. 12666-12673. ISSN 0003-2700 ,
http://dx.doi.org/10.1021/acs.analchem.7b02653
This version is available at
https://strathprints.strath.ac.uk/62958/
Strathprints is designed to allow users to access the research output of the University of Strathclyde. Unless otherwise explicitly stated on the manuscript, Copyright © and Moral Rights for the papers on this site are retained by the individual authors and/or other copyright owners. Please check the manuscript for details of any other licences that may have been applied. You may not engage in further distribution of the material for any profitmaking activities or any commercial gain. You may freely distribute both the url (https://strathprints.strath.ac.uk/) and the content of this paper for research or private study, educational, or not-for-profit purposes without prior permission or charge.
Any correspondence concerning this service should be sent to the Strathprints administrator:
The Strathprints institutional repository (https://strathprints.strath.ac.uk) is a digital archive of University of Strathclyde research outputs. It has been developed to disseminate open access research outputs, expose data about those outputs, and enable the
Peer-reviewed accepted author manuscript of the following research output: Kearns, H., Goodacre, R., Jamieson, L. E., Graham, D., & Faulds, K. (2017). SERS detection of multiple antimicrobial-resistant pathogens using nanosensors. Analytical Chemistry, 89(23), 12666-12673. DOI: 10.1021/acs.analchem.7b02653
SERS Detection of Multiple Antimicrobial-Resistant Pathogens using
Nanosensors
Hayleigh Kearns,
†Royston Goodacre,
‡Lauren Jamieson,
†Duncan Graham
†and Karen Faulds
†*
† Centre for Molecular Nanometrology, Department of Pure and Applied Chemistry, University of Strathclyde, 99 George Street, Glasgow, G1 1RD, United Kingdom. Email: [email protected]
‡ The Manchester Institute of Biotechnology, School of Chemistry, University of Manchester, 131 Princess Street, Manchester, M1 7DN, United Kingdom
ABSTRACT: Successful pathogen detection is crucial for public health as the threat of infectious disease is dramatically increasing globally due to bacteria developing resistance to many anti-microbial drugs. The increase in bacterial infections has led to urgent de-mands for simpler, faster and more reliable detection methods to be developed, so that the most appropriate therapy can be provided. Surface enhanced Raman scattering (SERS) is an analytical technique which has gained a great deal of interest for biosensing due to its sensitivity, selectivity and multiplexing capabilities. A new bionanosensor has been developed for the isolation and detection of multiple bacterial pathogens via magnetic separation and SERS. This novel assay format involves using lectin functionalised magnetic nanopar-ticles for capture and isolation of bacteria from the sample matrix followed by specifically detecting bacterial pathogens using SERS active nanoparticles functionalised with antibodies which are strain specific. Therefore, the sample is captured using a ‘magnetic plug’ and interrogated with a laser allowing simple and fast optical detection. Three bacterial pathogens –Escherichia coli, Salmonella typhi-murium and methicillin-resistant Staphylococcus aureus– were successfully isolated and detected, with the lowest concentration for each of the strains detected at just 101 colony forming units per mL (CFU/mL). In addition to single pathogen detection, a mixture of all
three bacterial strains were isolated and identified within the same sample matrix using SERS with the triplex detection also being confirmed using principal component analysis. Herein, we demonstrate that this multiplexed bionanosensor is capable of providing rapid and sensitive discrimination of bacterial pathogens both individually, and within a multiplex system, offering opportunities for future point of care devices and advancements in bio-medical applications.
Successful pathogen detection is a critical step in ensuring food safety and the health of the general public.1 Over the years,
there have been many threats to human health from bacterial infections such as Escherichia coli and methicillin-resistant Staphy-lococcus aureus (MRSA) leading to a surge of ingenious strategies for isolating and detecting microorganisms in connection with food safety, medical diagnostics, water quality, and bioterror-ism.2,3 Commonly, pathogenic bacteria are detected using
con-ventional methods which rely on lengthy and laborious microbi-ological, morphological or biochemical identification. Generally these methods fall within three categories; culture-colony count-ing methods, polymerase chain reaction (PCR) and immunology based techniques such as enzyme-linked immunosorbent assays.1
These methods can provide sensitive, qualitative and quantita-tive data on the microorganisms being analysed, however, they can also be expensive, require specialised equipment with spe-cially trained staff and/or be time consuming as they often re-quire an initial enrichment step.4,5 In order to overcome these
deficiencies, biosensor technology has grown exponentially in the last 25 years as it has the capability of providing sensitive and reliable results which equate to conventional methods but with much shorter analysis times and the added benefit of analysis be-ing deployed directly on site. 4,6,7,8
Surface enhanced Raman scattering (SERS) is an ultra-sensi-tive and selecultra-sensi-tive analytical technique that can be used to detect
target molecules attached to or in close-proximity to the surface of noble metal nanoparticles, commonly silver and gold are used.9 The enhancements observed are orders of magnitude
greater than those reported for conventional Raman scattering, however, the enhancements vary widely depending on analyte and substrate.10,11 Additional enhancements, up to 1014 can be
achieved by tuning the laser frequency with an electronic transi-tion within the analyte hence using a chromophore to give rise to the phenomenon known as surface enhanced resonance Ra-man scattering (SERRS). The main advantage of RaRa-man based techniques are their ability to provide sharp, molecularly specific spectra making it possible to easily discriminate between individ-ual components in a sample mixture, therefore making it an ideal technique for the detection of multiple analytes.12,13
To date, there have been many SERS bionanosensors devel-oped which focus on bacterial pathogen detection.2,3,14-19 Zhang
et al. used aptamer functionalised gold nanoparticles to detect
Salmonella typhimurium and Staphylococcus aureus in pork at con-centrations of 15 and 35 CFU/mL respectively.20 Pazos-Perez et
Moreover, there has been an influx in papers recently which use a ‘magnetic separation’ approach. This involves using mag-netic nanoparticles plus a magnet to capture and isolate bacteria from a complex matrix volume, giving rise to increased SERS sig-nal.1,22-26 Najafi
et al. detected E. coli in apple juice at 102
CFU/mL;23 while Guven et al. reported detection limits of 8
CFU/mL in water within 70 min.22 Furthermore, Wang et al.
reported that S. typh and S. aureus could be detected simultane-ously in spiked spinach and peanut butter at concentrations of 103 CFU/mL, when SERS was combined with a magnetic
sepa-ration step.1 The bionanosensors which have been developed are
starting to address the issue of detecting multiple bacterial path-ogens simultaneously with 2-3 targets being identified in a sample matrix. They produce reproducible results in comparable times however, they lack the sensitivity, efficiency and ease of our ap-proach. Many of them, require complex separation steps or re-quire dropping the sample onto a surface before analysis, result-ing in extra handlresult-ing steps and increased preparation times. Es-sentially our approach is a sandwich SERS assay (Figure 1) in which we combine SERS active silver nanoparticles functional-ised with bacteria specific recognition molecules (antibodies) with lectin functionalised magnetic nanoparticles enabling the capture and isolation of bacteria through magnetic separation. It is the use of lectin functionalised magnetic nanoparticles, which makes this separation step novel and efficient in capturing and isolating bacteria from a sample matrix.
Lectins are carbohydrate binding proteins that bind specifi-cally to sugars. They have been reported to specifispecifi-cally recognise and bind to carbohydrate constituents expressed on the surface of bacteria.27,28 Concanvalin A (Con A) is a type of legume lectin
that binds specifically to terminal -D-mannosyl and -D-glucosyl groups present on the surface of all bacteria.29,30 In addition, our
group has previously reported its use with silver nanoparticles as a molecular imaging agent, investigating carbohydrate-lectin in-teractions occurring at the surface of mammalian cells using SERS.31 Furthermore, we have prior knowledge of combining
functionalised silver nanoparticles with silver-coated magnetic nanoparticles in a stable sandwich-type assay for SERS detection of DNA.32 Hence, by exploiting our previous knowledge and the
fact that lectins bind specifically to sugar moieties on the surface of bacteria, we have in the present study developed a sensitive bionanosensor which is capable of isolating and detecting multi-ple bacterial pathogens simultaneously. We believe our SERS bi-onanosensor can provide all the requirements (sensitivity, repro-ducibility, cost, ease of use and speed of analysis) which are re-quired for a point of care assay and offer opportunities for future advancements in healthcare applications.
Experimental
Silver nanoparticles and silver coated magnetic nanoparticles were synthesised using methods previously reported by Lee et al. and Kumar et al.33,34 The colloidal solutions had an average
par-ticle size of 80.9 nm and 253.3 nm respectively. The biomolecule-nanoparticle conjugates which were used in these studies were prepared using modified methods previously described by Simp-son et al. and Donnelly et al.17,32Detailed protocols for the
prep-aration and characterisation of these colloidal suspensions are provided in the experimental section of the ESI.
Bacterial Strains
Bacterial Strains: Escherichia coli ATCC 25922; Staphylococcus au-reus (methicillin resistant) ATCC BAA-1766 and Salmonella typhi-murium ATCC 14028 were used in this study. The growth con-ditions and protocol detailing the preparation of the bacterial slurries are provided in the ESI.
Detection Assay
Single pathogen detection: For each of the 3 bacterial pathogens the following procedure was carried out - SERS active antibody functionalised silver nanoparticles (200 µL; Ab-AgNP) were added together with lectin functionalised silver coated magnetic nanoparticles (200 µL; Con A-Ag@MNP) and a specific bacterial strain (50 µL, 104 CFU/mL). Note for the control sample, the
bacteria was replaced with d.H2O (50 L) only. The sample was
mixed thoroughly for 30 min before being placed in a magnetic rack for a further 30 min to allow the sample to collect. The clear supernatant was removed and the sample re-suspended in d.H2O
(450 L) ready for analysis. The same procedure was followed for the concentration studies except the bacteria concentration was varied from 104 to 101 CFU/mL. To confirm concentration
de-pendence, an extended concentration study was conducted for
E. coli bacteria only where the assay was performed over the range 107 to 101 CFU/mL. It should be noted that each sample was
prepared in triplicate.
Multiple pathogen detection: The three sets of antibody function-alised silver nanoparticles (100 µL of each conjugate) were added together with lectin functionalised silver coated magnetic nano-particles (200 µL) plus the three bacterial strains (50 µL of each pathogen; 103 CFU/mL). Note for the control sample, the
bac-teria was replaced with d.H2O (150 L) only. The same
proce-dure as described above (for the single pathogen detection) was employed, except the sample was re-suspended in 650 µL of d.H2O.
SERS and Multivariate Analysis
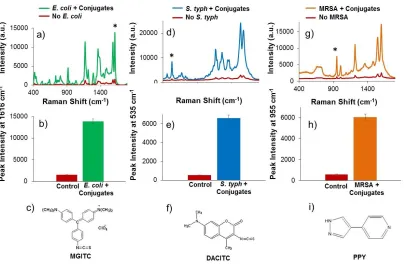
Raman reporters used were malachite green isothiocyanate (MGITC); 7-dimethylamino-4-methylcoumarin-3-isothiocyanate (DACITC) and 4-(1H-pyrazol-4-yl)-pyridine (PPY) and these were used to detect E. coli, S. typh and MRSA respectively.
The samples were analysed immediately after preparation us-ing a Renishaw InVia Raman microscope. Specifically, the Ra-man spectra were acquired using a 532 nm laser excitation with a 20x long working distance objective lens focused into a 96 well plate containing 300 µL of the bacteria-NP conjugate solution. The laser power was adjusted each time to ~0.8 mW and an ac-quisition time of 1 s with a static scan being centred at 1300 cm -1 was employed. For all Raman spectra, data handling was carried
out using GRAMS/AI software. The peak intensities were ob-tained by scanning 3 replicate samples 5 times and in all plots the error bars represent one standard deviation.
All multivariate statistical analysis was carried out in MATLAB software (The MathWorks, Natick, USA). Prior to conducting principal component analysis (PCA) the data was baseline cor-rected using asymmetric least-squares (AsLS).35 PCA was
and one data set obtained for the multiplex detection of the three pathogens.36
Results and Discussion
Characterisation of Biomolecule-NP Conjugates
The developed bionansosensor is based on a sandwich type SERS assay with the detection strategy provided in Figure 1. Initially, maghemite ( -Fe2O3) magnetic nanoparticles were
syn-thesised using a co-precipitation method, and then coated with a silver shell via a glucose reduction protocol previously de-scribed by Donnelly et al.32 The silver coated magnetic
nanopar-ticles were functionalised with a heterobifunctional thiol/car-boxy PEGylated linker and the legume lectin, Concanvilin A (Con A), via carbodiimide cross-coupling chemistry.17,32,37
Con-jugating Con A to the surface of silver coated magnetic nano-particles, in the presence of a magnet allowed for us to develop a unique and efficient way of capturing bacteria from a sample matrix.
Con A functionalised magnetic nanoparticles were prepared using modified methods previously described by Simpson et al.
and Donnelly et al.17,32 The magnetic nanoparticle conjugates
were optimised and characterised using extinction spectros-copy, dynamic light scattering and zeta potential analysis. The data obtained at each stage of the conjugation process (Figure S1) along with a detailed discussion of the results are provided in the ESI. In summary, a shift from 420 to 430 nm in the localised surface plasmon resonance (LSPR) plus broadening of the peak was observed after the addition of the Con A lectin (Figure S1 (a)). Furthermore, an increase in size and decrease in zeta potential (Figure S1 (c) and (d) respectively) were ob-served at each stage of the conjugation indicating that there was a change to the surface environment of the nanoparticle and thus confirming the successful attachment of both the PEGylated linker and the Con A lectin to the magnetic nano-particles.
It was also important to optimise and characterise each step of the conjugation process for the SERS active antibody func-tionalised silver nanoparticles. Silver nanoparticles were ini-tially synthesised using a modified Lee and Miesel method.33
Following this the SERS active conjugates were prepared by functionalising the silver nanoparticles with a Raman reporter, PEGylated linker and antibodies that were bacterial strain spe-cific. Again, carbodiimide cross-linking chemistry was used to immobilise the antibodies onto the nanoparticle surface and the conjugates characterised using the same techniques as those previously employed for the Con A functionalised magnetic na-noparticles. It should be noted that the three sets of antibody conjugates (E. coli, S. typh and MRSA) were optimised and char-acterised in the same way, with similar trends being observed in the data sets hence, only the data associated with the E. coli
antibody is shown in Figure S1 (ESI). A detailed discussion of the characterisation of the SERS active conjugates is provided in the ESI. Briefly, a LSPR shift from 407 to 413 nm plus broadening and dampening of the peak was observed upon conjugating with the E. coli antibody. In addition, a size in-crease and dein-crease in zeta potential (Figure S1 (c and d)) were observed at each stage of the conjugation confirming the suc-cessful attachment of the bio-molecule. Moreover, the SERS re-sults showed that with a 1 s accumulation time and 532 nm
laser an excellent signal could be obtained from the SERS ac-tive conjugates (Figure S1 (e)). For further clarification on the successful conjugation and to confirm the stability of the col-loidal solutions, gel electrophoresis was performed (Figure S1 (f)). These results along with those observed for the Con A func-tionalised magnetic nanoparticles suggested that the function-alisation conditions were optimal for use in the next stage of the studies which was developing the assay for single pathogen detection.17
Detection Assay
The detection assay is based on a sandwich-type SERS ap-proach, involving the use of Con A functionalised magnetic nanoparticles and SERS active nanoparticles functionalised with antibodies that are bacterial strain specific. It is important to note that the Raman reporter (highlighted as stars in the schematic in Figure 1) is only present on the bio-recognition nanoparticles and not on the magnetic nanoparticles. Hence, a SERS signal is only observed when the SERS active nanoparti-cle binds specifically to its bacterial target. As shown in Figure 1 (a-c), a SERS signal is only obtained (green spectrum) when both the bio-recognition nanoparticles and the magnetic nano-particles bind to the bacterial target. A magnet is then applied and magnetic separation is used to remove the SERS active complex from the matrix volume. In the case where there was no bacterial target present (control sample; red spectrum), the SERS active nanoparticles remain in the bulk solution and are washed away, leaving only the magnetic nanoparticles captured and bound to the magnet. These nanoparticles are non-Raman active, and hence only produce weak background signals. Fol-lowing the separation step, the SERS active complex and con-trol samples are re-suspended in d.H2O and analysed using a
532 nm laser. In terms of the multiplexing step (Figure 1d) the procedure described above was followed, except that three sep-arate sets of bio-recognition nanoparticles were prepared each specific for one strain of bacteria only and each with a unique Raman reporter. The Raman reporter produces a molecularly specific spectrum and each reporter contains a characteristic peak which can be used to identify and easily discriminate be-tween the individual components in a sample mixture.38 It can
be seen in the SERS spectra of Figure 1d, that 3 characteristic peaks have been highlighted (*), each one is unique to a Raman reporter and hence is used to identify which bacterial target is present.
due to residual SERS active biorecognition conjugates not be-ing completely washed away durbe-ing the separation step. How-ever, this signal is negligible as it is clear there is a large en-hancement in the signal observed from the SERS active bacte-ria complex over the control.
The enhancement in SERS signal from the sample over the control is due to the unique design of this assay. Firstly, the use of Con A functionalised magnetic nanoparticles, allows for multi-valent interactions to take place between the lectin and the sugar moieties on the bacteria surface.30 In addition to this,
the magnetic core of the nanoparticles enables the use of a mag-net in which magmag-netic separation can be employed to capture and isolate the bacteria-nanoparticle complex from the matrix volume. This allows for sample concentration and any un-bound material to be washed away, ultimately reducing the background signal and the chance of false positives. Secondly, the surface of bacteria also provides multiple binding sites for interacting with antibody functionalised nanoparticles.1 The
bi-orecognition event, which occurs between SERS active anti-body functionalised nanoparticles and antigens present on the surface of bacteria, results in enhanced SERS signals being ob-tained (as seen in Figure 2 (a)). The multi-valent interaction which occurs enables the nanoparticles to come in-close prox-imity to one another, resulting in areas of highly localised elec-tromagnetic fields known as SERS hot-spots and these give rise to increased Raman signals.39 Therefore, it can be confirmed
that the enhancement in SERS signal for the sample over the control was due to the SERS active nanoparticles binding spe-cifically to the bacterial target; with the help of the lectin func-tionalised magnetic nanoparticles capturing and isolating the bacteria complex from the sample matrix. Thus, the signal en-hancement was a result of both conjugates being present and binding to the E. coli bacteria.
When no bacteria were present however, the SERS active bi-orecognition nanoparticles were unable to bind and therefore could not be pulled down by the magnet during the separation step. Essentially they were washed away with the remaining un-bound matrix volume, leaving only the magnetic nanoparticles to be analysed, thus resulting in a very weak Raman signal being obtained. It is evident from Figure 2 (a) and further clarified in Figure 2 (b) that a signal enhancement of ~10 times is observed for the E. coli bacteria sample over the control. The characteris-tic peak at 1616 cm-1 which arises due to aromatic ring
stretch-ing within the MGITC molecule,40 was used to calculate the
peak intensity values. Peak intensities were obtained by scan-ning 3 replicate samples 5 times and the error bars represent one standard deviation. The total analysis time was ~1 h from mixing the sample to obtaining the SERS results. Therefore, in comparison to culture based methods where it can take up to 7 days for results to be obtained, a bionanosensor capable of rapidly isolating and simultaneously detecting E. coli bacteria has been demonstrated. We believe however, that this analysis time could be further improved with additional optimisation and automation of the wash steps.
The number of bacterial pathogens which could be detected was extended to S. typh, another Gram-negative bacterial strain, and MRSA, a Gram-positive bacterial strain, which were cho-sen to show the breadth and facile adaptability of the biona-nosensor. The results of the single pathogen tests for S. typh and MRSA can be observed in Figure 2 (d-f) and (g-i) respectively.
The Raman reporter DACITC (dimethylamino-4-methyl-coumarin-3-isothiocyanate) with a characteristic peak at 535 cm-1 was used to detect S. typh, whilst PPY
(4-(1H-pyrazol-4-yl)-pyridine) with a characteristic peak at 955 cm-1 was used to
de-tect the presence of MRSA. Similar results were observed for these two bacterial strains as those previously seen with the E. coli bacteria, such that intense SERS signals were obtained when the bacteria was present and very weak signals when they were not. In terms of the S. typh bacteria, a signal enhancement of ~13 times (blue spectrum) was observed for the SERS active bacteria complex over the control sample (red spectrum). Whilst the signal for the MRSAbacteria complex (orange spec-trum)over the control sample was ~11 times greater, thus fur-ther demonstrating the level of discrimination which can be achieved using this approach. Moreover, we have demonstrated that this bionanosensor is both speedy and versatile as it is ca-pable of isolating and detecting both positive and Gram-negative bacterial pathogens. Further, the discrimination which can be achieved between sample and control is undeni-able.
Single Pathogen Detection
For this approach to represent an advancement over current methodologies, it also has to be sensitive as well as fast. There-fore, concentration studies for each of the 3 bacterial pathogens were conducted to determine what the cell concentration limit would be, in terms of discriminating between the SERS active bacteria complex and the control. The assay was performed for each of the pathogens over the bacteria concentration range 104
to 101 CFU/mL. Figure 3, shows the SERS spectra obtained at
each of the concentrations plus a control spectrum for compar-ison, for (a) E. coli, (b) S. typh and c) MRSA. Additionally, asso-ciated bar charts detailing the SERS peak intensities for each of the bacteria concentrations are also provided. For ease and visual clarification each of the bar chart contains a dashed line, this is used to highlight the peak intensity of the control. Fur-thermore, an extended concentration study was conducted for
E. coli bacteria where the assay was performed over the range 107 to 101 CFU/mL. The results from this can be seen in Figure
S2 (ESI) but it was obvious that at bacteria concentrations greater than 104 CFU/mL, too many bacteria were present in
the sample causing the binding of large numbers of nanoparti-cles followed by concentration into a small volume by magnetic capture. This resulted in dampening of the SERS signal due to self-absorbance of the Raman scattered light. There was a clear concentration dependence at 104 CFU/mL and below, and as
such the sensitivity was only conducted from 104 to 101
CFU/mL. As previously mentioned, the concentration studies produced similar results with the greatest SERS signals being obtained when cell concentrations of 104 CFU/mL were
em-ployed. The weakest SERS responses were observed from the controls therefore, even at low bacteria concentrations of 101
CFU/mL, using this approach we were able to discriminate be-tween the SERS active bacteria complexes and the controls.
In terms of the assay’s sensitivity, it is obvious from Figure 3 that detection can confidently be made with cell concentra-tions between 104 and 102 CFU/mL for all three bacterial
For the E. coli bacteria, the SERS active bacteria complex pro-duced a SERS signal twice that of the control, confirming that we were able to discriminate between the two samples and thus able to detect E. coli bacteria at a concentration of 101
CFU/mL. Additionally, it was possible to detect S. typh and MRSA at this concentration also, with signal enhancements of ~1.5 and 1.7 being observed for the SERS active bacteria com-plexes over the control samples respectively. It should be noted however, 50 uL of bacteria was used in these assays hence the detection limit is actually lower than 101 CFU/ml, as the
num-ber of bacteria present in these samples is less than if 1 mL of bacteria had been added. Moreover, we have successfully demonstrated that this SERS bionanosensor is not only rapid and versatile but also sensitive in detecting bacterial pathogens. In addition, the bionanosensor is capable of detecting concen-trations which are clinically relevant, with current methodolo-gies typically detecting 103 CFU/mL.41,42
Multiple Pathogen Detection
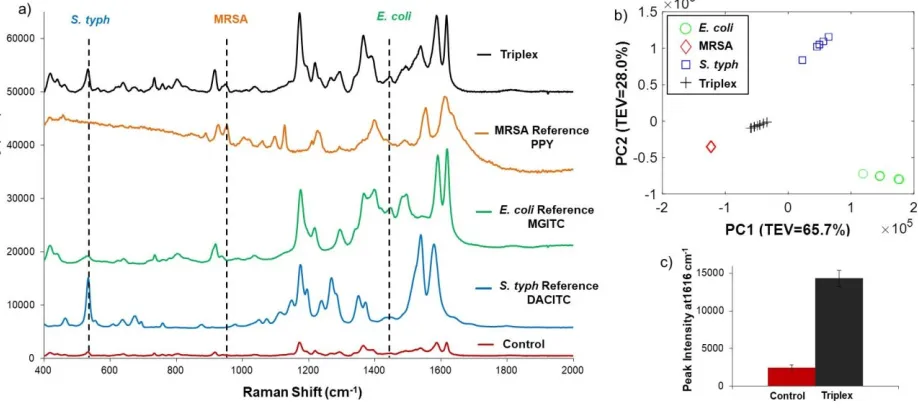
Food contamination is a threat to public health and it can occur at any stage between preparation and consumption; af-fecting 500,000 people in the UK alone each year.Our biona-nosensor is capable of detecting multiple bacterial pathogens simultaneously and in the case of food pathogens where co-in-fection is plausible we demonstrate the successful detection of both E. coli and S. typh simultaneously (Figure S3). However to demonstrate the diversity and adaptability of this bionanosen-sor we have chosen to detect food pathogens and MRSA which also has a huge impact on human health. For the multiplex de-tection assay, the same procedure described previously was fol-lowed except three separate sets of bio-recognition nanoparti-cles were prepared each specific for one strain of bacteria only and each with a unique Raman reporter. Figure 4 (a) shows the SERS spectrum obtained when all three bacterial pathogens (E. coli, S. typh andMRSA) were present in the sample. This multi-plex spectrum (black) was compared to the SERS spectra ob-tained when each of the pathogens were detected individually and a control sample for when no bacteria was present (red).
The DACITC spectrum (blue) represents S. typh; MGITC spectrum (green) represents E. coli; PPY spectrum (orange) rep-resents MRSA. It can be seen in Figure 4 (a) that the black dot-ted line highlights three peaks at 535, 955 and 1445 cm-1 which
are unique to each of the Raman reporters (DACITC, PPY and MGITC) and hence used to identify the presence of each of the bacterial targets (S. typh, MRSA and E. coli) respectively. The peak at 1616 cm-1 used previously to detect E. coli, occurs close
to a peak in the MRSA (PPY peak at 1610 cm-1) spectrum,
there-fore to confirm the presence of E. coli the peak at 1445 cm-1 was
chosen instead. This bionanosensor provides a ‘one pot’ detec-tion system for multiple bacterial pathogens but more im-portant than that, it is capable of isolating and discriminating between the bacterial strains being analysed. As the multiplex spectrum is multivariate in nature, it is not always reliable to analyse the spectrum by eye alone, thus multivariate analysis in the form of principal component analysis (PCA) was performed on the multiplex spectrum along with the three single pathogen spectra. Figure 4 (b) shows the PCA scores plot showing the relationship between the multiplex spectra and each of the three single pathogen spectra. PCA is a common method for the analysis of spectroscopic data,7,36 and the resulting principal
component (PC) scores plot (Figure 4 (b)) clearly illustrates how strong the relationship was between the multiplex spectra and the pathogen spectra with four unique groupings being identi-fied. It can be seen that the single bacterial pathogen samples form the edges of a triangle with the triplex sample clustering in the middle. The black crosses represent the triplex spectra; green circles are E. coli; blue squares are S. typh and red dia-monds are MRSA. Five scans of 3 replicate samples are shown in the PCA plot and each group is tightly clustered illustrating the excellent reproducibility of the SERS spectra and hence the whole analytical approach including bacterial isolation as well as detection. The SERS spectra from the triplex sample are also clustered tightly together and are clearly separated from the sin-gle bacterial samples. Thus, the PCA supports the previous findings in which successful identification and discrimination between the bacterial pathogens in the multiplex can be made. Moreover, it is not only important to be able to discriminate between the bacterial pathogens within the multiplex but it is vital that the bionanosensor is capable of discriminating be-tween the SERS active bacteria complex and the control sample (when no bacteria are added).
The difference in signal intensity between the triplex sample and control is clearly observed in Figure 4 (a), however for fur-ther clarification, Figure 4 (c) provides the associated peak in-tensity values with error bars for the 1616 cm-1 peak. It can be
seen that when the bacterial targets were present, an intense SERS spectrum was obtained (black spectrum) and as explained previously this was due to a biorecognition interaction occur-ring between the nanoparticle conjugates and the three bacte-rial strains. However, when no bacteria were present, then only a weak Raman signal was observed (red spectrum). The SERS signal for the triplex sample was ~6 times greater than that ob-served for the control, demonstrating the effectiveness of this approach. Again, the total analysis time was ~1 h. This is com-parable with other bionanosensors which have been developed but where this approach is unprecedented is that it can detect multiple pathogens simultaneously in this time, whereas previ-ous methods are for single pathogen detection only.2,3
Further-more, this bionanosensor is easy to use and can be adapted for use with portable Raman instruments, making it ideal for use with point of care devices. The sensitivity which can be achieved by this bionanosensor is also below the recommended limits currently required for clinical diagnosis (which is ≥103
CFU/mL).41,42 Therefore; it offers significant advancements
over existing methods and offers the opportunity for advance-ments in healthcare applications.
Conclusions
A SERS bionanosensor which is rapid, sensitive and capable of isolating and detecting multiple bacterial pathogens simulta-neously has been demonstrated. This novel approach involves combining a sandwich type assay with magnetic separation in which a magnet is used to capture a SERS active bacteria com-plex and isolate it from a matrix volume. Using this detection assay, cell concentrations as low as 101 CFU/mL were readily
bionanosensor has been demonstrated with bacterial concen-trations below the requirements for clinical diagnosis being made. This multiplexed bionanosensor is capable of providing fast and sensitive discrimination of bacterial pathogens both individually and within a multiplex system offering opportuni-ties for future advancements in clinical diagnosis and bio-med-ical applications.
ASSOCIATED CONTENT
Supporting Information
Experimental details for NP synthesis, preparation of biomolecule-NP conjugates, bacterial strain and growth conditions plus bacte-rial sample preparation; experimental and instrumental conditions for characterising biomolecule-NP conjugates, SERS analysis and chemometrics; figures for optimisation and characterisation of NP-biomolecule conjugates plus detailed discussion of the characteri-sation; figure of the E. coli assay conducted over the bacteria con-centration range 107 to 10 1 CFU/mL and figure demonstrating
duplex detection. The Supporting Information is available free of charge on the ACS Publications website.
AUTHOR INFORMATION
Corresponding Author
*Professor Karen Faulds; Email: [email protected]
Author Contributions
The manuscript was written through contributions of all authors and all authors have given approval to the final version of the manuscript.
ACKNOWLEDGMENT
KF, HK and RG wish to thank BBSRC for funding; (BB/M018652/1). RG is also grateful to BBSRC for funding Ra-man spectroscopy (BB/L014823/1).
The research data associated with this paper will become available at the following link: http://dx.doi.org/10.15129/2ab280ed-d846-464b-b5d4-1222feb0ac77
REFERENCES
(1) Wang, Y.; Ravindranath, S.; Irudayaraj, J. Anal. Bioanal. Chem., 2011, 399, 1271-1278.
(2) Jarvis, R. M.; Goodacre, R. Chem. Soc. Rev.,2008, 37, 931-936. (3) Premasiri, W.; Moir, D.; Klempner, M.; Krieger, N.; Jones, G.; Ziegler, L. J. Phys. Chem. B,2005, 109, 312-320.
(4) Velusamy, V.; Arshak, K.; Korostynska, O.; Oliwa, K.; Adley, C. Biotechnol. Adv., 2010, 28, 232-254.
(5) Leonard, P.; Hearty, S.; Brennan, J.; Dunne, L.; Quinn, J.;
Chakraborty, T.; O’Kennedy, R. Enzyme Microb. Technol.,2003, 32, 3-13.
(6) Lazcka, O.; Del Campo, F. J.; Munoz, F. X. Biosens Bioelectron.,
2007, 22, 1205-1217.
(7) Ellis, D. I.; Brewster, V. L.; Dunn, W. B.; Allwood, J. W.; Golovanov, A. P.; Chem. Soc. Rev., 2012, 41, 5706-5727.
(8) Vigneshvar, S.; Sudhakumari, C.; Senthilkumaran, B.; Prakash, H. Front Bioeng Biotechnol.,2016, 4, Article 11, 1-9.
(9) Laing, S.; Gracie, K.; Faulds, K. Chem. Soc. Rev.,2016, 45, 1901-1918.
(10) Oldenburg, S. J.; Westcott, S. L.; Averitt, R. D.; Halas, N. J. J. Chem. Phys., 1999, 111, 4729-4735.
(11) Wang, Y.; Schlücker, S. Analyst,2013, 138, 2224-2238.
(12) Harper, M. M.; McKeating, K. S.; Faulds, K. Phys. Chem. Chem. Phys., 2013, 15, 5312-5328.
(13) Dougan, J. A.; Faulds, K. Analyst,2012, 137, 545-554.
(14) Lan, L.; Yao, Y.; Ping, J.; Ying, Y. Biosens Bioelectron.,2017, 91, 504-514.
(15) Li, H.; Chen, Q.; Hassan, M. M.; Chen, X.; Ouyang, Q.; Guo, Z.; Zhao, J. Biosens Bioelectron., 2017, 92, 192-199.
(16) Gracie, K.; Correa, E.; Mabbott, S.; Dougan, J. A.; Graham, D.; Goodacre, R.; Faulds, K. Chem. Sci.,2014, 5, 1030-1040.
(17) Simpson, J.; Craig, D.; Faulds, K.; Graham, D. Nanoscale Horiz.,
2016, 1, 60-63.
(18) Ravindranath, S. P.; Wang, Y.; Irudayaraj, J. Sens Actuators B Chem.,2011, 152, 183-190.
(19) Stephen, K. E.; Homrighausen, D.; DePalma, G.; Nakatsu, C. H.; Irudayaraj, J. Analyst,2012, 137, 4280-4286.
(20) Zhang, H.; Ma, X.; Liu, Y.; Duan, N.; Wu, S.; Wang, Z.; Xu, B. Biosens Bioelectron.,2015, 74, 872-877.
(21) Pazos-Perez, N.; Pazos, E.; Catala, C.; Mir-Simon, B.; Gómez-de Pedro, S.; Sagales, J.; Villanueva, C.; Vila, J.; Soriano, A.; De Abajo, F. J. G.; Alvarez-Puebla, R. A. Sci. Rep.,2016, 6, 29014 -29024. (22) Guven, B.; Basaran-Akgul, N.; Temur, E.; Tamer, U.; Boyacı, İ. H. Analyst,2011, 136, 740-748.
(23) Najafi, R.; Mukherjee, S.; Hudson, J.; Sharma, A.; Banerjee, P. Int J Food Microbiol., 2014, 189, 89-97.
(24) Gu, H.; Ho, P.-L.; Tsang, K. W.; Wang, L.; Xu, B. J. Am. Chem. Soc.,2003, 125, 15702-15703.
(25) Gu, H.; Xu, K.; Xu, C.; Xu, B. Chem. Commun.,2006, 0, 941-949. (26) Zhang, L.; Xu, J.; Mi, L.; Gong, H.; Jiang, S.; Yu, Q. Biosens Bioelectron.,2012, 31, 130-136.
(27) Hirabayashi, J. J. Biochem., 2008, 144, 139-147.
(28) Gao, J.; Liu, D.; Wang, Z. Anal. Chem.,2010, 82, 9240-9247. (29) Shen, Z.; Huang, M.; Xiao, C.; Zhang, Y.; Zeng, X.; Wang, P. G. Anal. Chem.,2007, 79, 2312.
(30) Firon, N.; Ofek, I.; Sharon, N. Infect. Immun.,1984, 43, 1088-1090.
(31) Craig, D.; McAughtrie, S.; Simpson, J.; McCraw, C.; Faulds, K.; Graham, D. Anal. Chem., 2014, 86, 4775-5782.
(32) Donnelly, T.; Smith, W. E.; Faulds, K.; Graham, D. Chem. Commun.,2014, 50, 12907-12910.
(33) Lee, P.; Meisel, D. J. Phys. Chem.,1982, 86, 3391-3395.
(34) Kumar, G. P.; Rangarajan, N.; Sonia, B.; Deepika, P.; Bull. Mater. Sci.,2011, 34, 207-216.
(35) Eilers, P. H. Anal. Chem.,2004, 76, 404-411.
(36) Kim, D. H.; Jarvis, R. M.; Xu, Y.; Oliver, A. W.; Allwood, J. W.; Hampson, L.; Hampson, I. N.; Goodacre, R. Analyst,2010, 135, 1235-1244.
(37) Zheng, M.; Davidson, F.; Huang, X. J. Am. Chem. Soc., 2003, 125, 7790-7791.
(38) Faulds, K.; Jarvis, R.; Smith, W. E.; Graham, D.; Goodacre, R. Analyst,2008, 133, 1505-1512.
(39) Kleinman, S. L.; Frontiera, R. R.; Henry, A.-I.; Dieringer, J. A.; Van Duyne, R. P. Phys. Chem. Chem. Phys.,2013, 15, 21-36.
(40) Smith, E.; Dent, G.; Wiley, J.: Modern Raman spectroscopy: a practical approach; Wiley Online Library, Chichester, 2005.
(41) Goldman, E.; Green, L. H.: Practical handbook of microbiology; CRC Press, London, 2015.
7
Figure 1. Schematic illustrating the single-plex and multiplex detection assay. Assay format: a) lectin (Con A) functionalised silver coated magnetic nanoparticles (Ag@MNPs) will bind to bacteria and the presence of the magnet will allow for magnetic separation of the bacteria from the sample matrix b) SERS active silver nanoparticles (AgNPs) functionalised with a biorecognition molecule (antibody; Ab) and a unique SERS reporter are added. The mixture is shaken for 30 min before applying a magnet for a further 30 min and allowing the sample to collect. Any unbound matrix is gently removed and the sample subsequently re-suspended in d.H2O c) The sample is then interrogatedwith a 532 nm laser beam and SERS signal obtained (green spectrum). When no target is present the functionalised AgNPs will be washed away, thus they will not bind to bacteria so a minimum SERS signal obtained (red spectrum). d) Multiplexing step: 3x AgNP conjugates each functionalised with a different Raman reporter and an antibody (which is specific for a bacterial pathogen) are added together with 3 bacterial pathogens and Con A (which binds to all three bacteria) functionalised Ag@MNPs. In the same way as the single-plex systems magnetic separation allows for the samples to be concentrated and analysed via a 532 nm laser. A SERS spectrum is obtained which contains characteristic peaks from the three Raman reporters and thus can be used to confirm the targets are present.
Figure 2. SERS spectra obtained from single pathogen detection using the SERS assay. a) SERS spectrum of MGITC observed when de-tecting E. coli (green) and the control spectrum representing when no bacteria was present (red); b) SERS peak intensities at 1616 cm-1 for
assay and control when detecting E. coli; c) Chemical structure for the Raman reporter, MGITC; d) SERS spectrum of DACITC observed when detecting S. typh (blue) and the control spectrum (red); e) SERS peak intensities at 535 cm-1 for assay and control when detecting S.
typh; f) Chemical structure for DACITC; g) SERS spectrum of PPY observed when detecting MRSA (orange) and the control spectrum (red); h) SERS peak intensities at 955 cm-1 for assay and control when detecting MRSA; i) Chemical structure for PPY. The bacteria
[image:8.612.60.465.396.660.2]8
intensities were obtained by scanning 3 replicate samples 5 times and the error bars represent one standard deviation. The (*) highlights a characteristic peak which is used to identify the Raman reporter hence the bacterial pathogen present but it also used to calculate the peak intensities throughout.Figure 3. The assay was performed for each of the pathogens over the bacteria concentration range 104 to 101 CFU/mL. Comparison SERS
spectra showing changes in signal for a) MGITC detecting E. coli, b) DACITC detecting S. typh and c) PPY detecting MRSA. The associated bar charts show the SERS peak intensities at each of the bacteria concentrations and these are compared to a control sample (no bacteria present). The characteristic peaks 1616, 535 and 955 cm-1 were used to calculate the peak intensities for E. coli, S. typh andMRSA
respec-tively. SERS spectra were recorded using a 532 nm laser excitation with an accumulation time of 1s. Peak intensities were obtained by scanning 3 replicate samples 5 times and the error bars represent one standard deviation. The dashed line gives visual clarification of the SERS peak intensity of the control.
Figure 4. SERS spectra obtained from multiple pathogen detection using the SERS assay. a) Stacked SERS spectra showing the raw spectra obtained from the detection of all three bacterial pathogens simultaneously using the detection assay and a control sample for comparison when no bacteria was present plus the SERS spectra obtained from the detection of each pathogen separately. Control spectrum is red, DACITC spectrum (blue) represents S. typh; MGITC spectrum (green) represents E. coli; PPY spectrum (orange) represents MRSA and the black spectrum is the multiplex containing all three bacterial pathogens. The black dotted lines show peaks that are unique to each Raman reporter and hence used to identify the presence of the bacterial targets. The bacteria concentration used was 103 CFU/mL. b) PCA scores
plot showing the relationship between the multiplex spectra and each of the three single pathogen spectra. The black crosses represent the triplex spectra; green circles are E. coli; blue squares are S. typh and red diamonds are MRSA. c) Comparative peak intensities at 1616 cm-1
[image:9.612.64.523.404.608.2]