Return to Their Natal Reef
Henrik Mouritsen1,2*, Jelle Atema3*, Michael J. Kingsford4, Gabriele Gerlach1*
1Institut fu¨r Biologie und Umweltwissenschaften, Carl-von-Ossietzky Universita¨t Oldenburg, Oldenburg, Germany,2Forschungszentrum Neurosensorik, University of Oldenburg, Oldenburg, Germany,3Boston University Marine Program, Boston, Massachusetts, United States of America,4School of Marine and Tropical Biology and ARC Centre of Excellence for Coral Reef Studies, James Cook University, Townsville, Queensland, Australia
Abstract
Reef fish sustain populations on isolated reefs and show genetic diversity between nearby reefs even though larvae of many species are swept away from the natal site during pelagic dispersal. Retention or recruitment to natal reefs requires orientation capabilities that enable larvae to find their way. Although olfactory and acoustically based orientation has been implicated in homing when larvae are in the reef’s vicinity, it is still unclear how they cope with greater distances. Here we show evidence for a sun compass mechanism that can bring the larvae to the vicinity of their natal reef. In a circular arena, pre-settlement larvae and early settlers (,24 hours) of the cardinal fish,Ostorhinchus doederleini, showed a strong SSE directional swimming response, which most likely has evolved to compensate for the locally prevailing large scale NNW current drift. When fish were clock-shifted 6 hours, they changed their orientation by ca. 180uas predicted by the tropical sun curve at One Tree Island, i.e. they used a time-compensated sun compass. Furthermore, the fish oriented most consistently at times of the day when the sun azimuth is easy to determine. Microsatellite markers showed that the larvae that had just arrived at One Tree Island genetically belonged to either the local reef population or to Fitzroy Reef located 12 kilometers to the SSE. The use of a sun compass adds a missing long-distance link to the hierarchy of other sensory abilities that can direct larvae to the region of origin, including their natal reef. Predominant local recruitment, in turn, can contribute to genetic isolation and potential speciation.
Citation:Mouritsen H, Atema J, Kingsford MJ, Gerlach G (2013) Sun Compass Orientation Helps Coral Reef Fish Larvae Return to Their Natal Reef. PLoS ONE 8(6): e66039. doi:10.1371/journal.pone.0066039
Editor:Eric James Warrant, Lund University, Sweden
ReceivedFebruary 22, 2013;AcceptedMay 1, 2013;PublishedJune 26, 2013
Copyright:ß2013 Mouritsen et al. This is an open-access article distributed under the terms of the Creative Commons Attribution License, which permits unrestricted use, distribution, and reproduction in any medium, provided the original author and source are credited.
Funding:This work was funded by a Lichtenberg professorship from the Volkswagen Stiftung to HM; DFG Ge842/6-1 to GG; Grant no. 7236-02, ARC grants, and funding from the ARC Centre of Excellence for Coral Reef Studies to MJK. The funders had no role in study design, data collection and analysis, decision to publish, or preparation of the manuscript.
Competing Interests:The authors have declared that no competing interests exist.
* E-mail: [email protected] (HM); [email protected] (GG); [email protected] (JA)
Introduction
The persistence of reef fish populations on isolated oceanic islands demonstrates that a significant number of their larvae return to their natal reef after their pelagic dispersal phase [1,2,3,4]. Such ‘‘self-recruitment’’ has been shown using transge-nerational otolith tagging [5,6] and genetic markers e.g. [1,2]. Failure to recruit to a suitable reef is fatal and the only reef any larva can know initially –by smell, sound, and direction– is its natal reef. This suggests selection for natal homing abilities and there are several arguments that support this idea. Dispersal models better predict the observed recruitment when they include a behavioral component [7,8], i.e. sustained swimming in an appropriate direction. Swimming capabilities of larval reef fishes are surpris-ingly strong, particularly late in the pre-settlement period [9,10]; and sensory guidance based on acoustic [11,12,13] and olfactory [14,15] mechanisms have been suggested. However, both odor halos [14] and acoustic cues [16] become fainter with distance and are unlikely to provide useful directional information beyond a few kilometers. Genetic assignment (e.g. [2,17]) shows that a significant proportion of larvae end up ten kilometers or more away from their natal reef. Therefore, selection should strongly favor animals that can actively compensate for long distance drift. However, thus far, no plausible mechanism has been demonstrated that could
allow pelagic larvae to locate the natal reef from distances beyond a few kilometers after their initial period of passive dispersal during which they are not capable of sustained directional swimming. For longer distance directional movements, animals typically use an innate or acquired compass [18,19,20,21,22,23,24]. Thus, the aim of the present paper is to investigate whether reef fish larvae have a compass mechanism that could be helpful for long-distance homing.
Results
tests were performed under non-clock-shifted conditions (a complete raw data summary of these experiments can be found in the supplementary materials, Table S1–S4 in File S1).
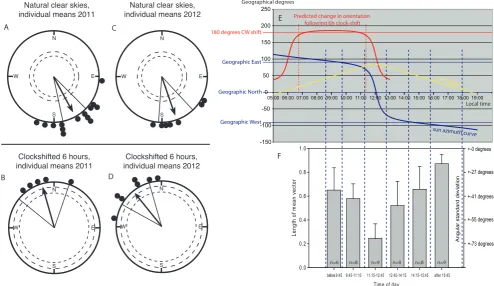
The non-clock-shifted, just-settling fish tested in 2011 sponta-neously and highly significantly oriented towards the SSE (Rayleigh Test: mean direction 152u, n = 14, r = 0.88, p,0.001; Figure 2A). This direction is opposite to the persistent NNW drift of the water masses around One Tree Island [2,25]. An internal replication using pre-settlement fish tested in 2012 showed the
same directional preference (Rayleigh Test: mean direction 161u, n = 7, r = 0.91, p,0.001; Figure 2C).
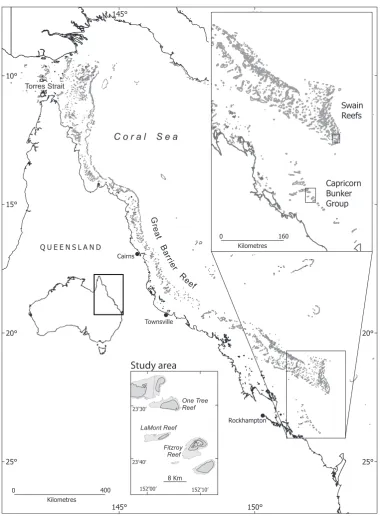
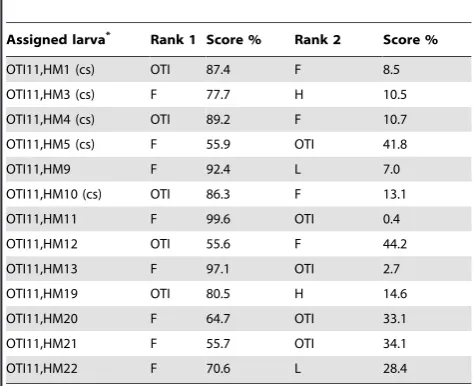
[image:2.612.60.441.54.571.2]We have direct evidence that long distance NNW dispersal occurs at the testing site. Using DNA microsatellite markers, we could assign the individual larvae, which we had shown to swim SSE in 2011, to adult populations of OTI and to Fitzroy reef located 12 kilometers from OTI in the same SSE direction (Figure 1). None of the larvae were assigned to Heron or Lamont reef populations located to the NW or SW of OTI. Five (31%) larvae were assigned to the OTI population with a mean
probability of 78%; the other eight (69%) larvae were assigned to the Fitzroy population with a mean probability of 77% (Table 1). Thus, NNW larval dispersal beyond 10 kilometers (i.e. from Fitzroy) occurs regularly. Therefore, the SSE swimming direction could be an adaptation to counter large-scale dispersal away from the fishes’ natal reef. This begs the question of how they know and maintain this SSE heading.
[image:3.612.58.553.62.348.2]During orientation tests at different times of day (the time ranges are indicated by the dashed blue lines in Figure 2E–F and detailed information on each individual test is given in Table S1 in File S1) we noticed that the fish appeared very poorly oriented when tested around noon (Figure 2F). One Tree Island (23u300S, 152u050 E) is part of the Capricorn group of islands, named so because these islands are located on the ‘‘Tropic of Capricorn’’, where the sun passes directly overhead on 21stof December. In
Figure 2. Settling stageOstorhinchus doederleiniuse a time-compensated sun compass to orient towards SSE. A: Fourteen just-settled O. doederleinitested under natural sunny skies in 2011 showed a clear orientation towards SSE (mean direction: 152u, r = 0.88, n = 14, p,0.001).B: When five of these fish were clock-shifted 6 hours backwards, they turned their orientation by ca. 180u(mean direction: 344u, r = 0.94, n = 5, p,0.01).
C, D: In January 2012, we repeated the experiments with pre-settlement fish and got very similar results. Seven pre-settlementO. doederleinitested under natural sunny skies showed a clear orientation towards SSE (C: mean direction: 161u, r = 0.91, n = 7, p,0.001). When all 7 fish were clock-shifted 6 hours backwards, they turned their orientation by ca. 180u(D: mean direction: 321u, r = 0.92, n = 7, p,0.001). Each dot at the circle periphery indicates the mean orientation chosen by each individual fish based on the second order average of all tests made with a given fish in the given condition. Arrows indicate the group mean vectors. Inner and outer dashed circles indicate the radius of the group mean vector needed for significance according to the Rayleigh Test (p,0.05 and p,0.01, respectively). Lines flanking the group mean vector indicate the 95% confidence intervals for the group mean direction.E: We performed all orientation tests between 20/Jan and 01/Feb. The yellow curve inEshows the height of the sun above the horizon at One Tree Island calculated for 25 January 2012 (90umeans directly overhead, 0umeans that the sun is at the horizon). The blue curve inEis the sun azimuth curve at One Tree Island calculated for 25 January 2012. Notice that in the morning until about 11:15, the sun azimuth is very consistently in the East (117u–77u). Likewise, in the afternoon from 12:45 onwards, the sun azimuth is very consistently in the West (293u–243u). In contrast, at noon between 11:15 and 12:45, the sun is more or less directly overhead (the sun is 78–86 degrees above the horizon, see yellow curve) and the sun azimuth changes by 139 degrees in just 90 minutes.Fis showing how strongly oriented the individual fish were during tests in the different time intervals. The left y-axis is indicating the length of the mean vector, ‘‘r’’, calculated by vector addition of the 40 observed directions during a single test of a given individual. The greater the r, the more consistently the fish oriented. The mean vector length is inversely proportional to the angular standard deviation (s = (-ln(r))K) which is indicated on the right y-axis. FigureFis aligned exactly under FigureEso that
the blue dashed lines identify the time range and sun azimuth positions that contributed data to each of the six time blocks. Notice that the fish oriented very poorly during the 11:15–12:45 time block, when a sun compass would be very difficult to use because the sun is almost directly overhead and shows an exceptionally rapid change in azimuth (139 degrees in just 90 minutes, i.e. 1.5 degrees/minute). Accurate orientation during this time would require a very precise synchronization of the animals’ internal clock to the specific sun curve. In contrast, late in the afternoon when a sun compass would be particularly easy to use because the sun azimuth changes very slowly and because the sun is close to the horizon, the fish showed extremely directed orientation. The unusual sun curve also means that a 6 hour clock-shift where the animals wake up around midnight and are tested before noon, when they think it is afternoon, leads to an extremely consistent predicted change in orientation of 180 degrees. This is documented by the red curve in Fig.E, which shows the predicted clockwise shift in orientation following a 6 hour clock-shift as a function of the time of day during which the fish are tested after being clock-shifted 6 hours. The red curve was calculated as follows: the Sun azimuth at testing time - the sun azimuth 6 hours later. We tested our clock-shifted fish between 06:45 and 11:02 (as indicated by the dashed vertical red lines) when the expected orientation of the 6 hrs time shifted larvae predicts a 180 degree shift for this entire 4:17-hr observation window.
late January on One Tree Island, the sun still passes from very consistent easterly positions before noon, to being almost directly overhead at noon, and to very consistent westerly positions in the afternoon. This leads to a very unusual local sun azimuth curve (see Figure 2E), which is ideally suited to test for sun compass orientation. In the morning from 07:00 to 11:00, the sun azimuth is in the East moving only 25 degrees in 4 hours. Likewise, in the afternoon from 13:00 to 17:00, the sun azimuth is in the West moving only 28 degrees in 4 hours. In contrast, around noon, between 11:15 and 12:45, the sun is more or less directly overhead (78–86 degrees above the horizon) and the sun azimuth changes by 139 degrees in just 90 minutes. This causes problems for the use of a sun compass because the sun azimuth is difficult to determine: the sun is almost directly overhead and the exceptionally rapid change in azimuth would require very precise synchronization of the animals’ internal clock to the local sun curve. The observed lack of orientation around noon suggests that the fish might use a sun compass at other times.
We therefore systematically investigated the consistency of the fish’s directional choices as a function of time of day in 2011 (Figure 2F, a summary table listing the time and orientation result of each individual test contributing to Figure 2F is provided in supplementary materials, Table S2 in File S1). The fish’s directedness, quantified as the length of the mean vector (r) of the 40 recorded headings in each single test, showed a clear dependence on time of day (One-way ANOVA; df = 47, F = 16.1, p,0.001, Figure 2F). In fact, the fish were randomly oriented around noon during the period when a sun compass would be very difficult to determine (11:15–12:45, mean r = 0.25; the average length of the mean vector was significantly smaller than in any other time interval, p,0.01 (One-way ANOVA followed by All Pairwise Multiple Comparison Procedures using the Student-Newman-Keuls Method). In contrast, the fish were exceptionally clearly oriented in the late afternoon when the sun is close to the
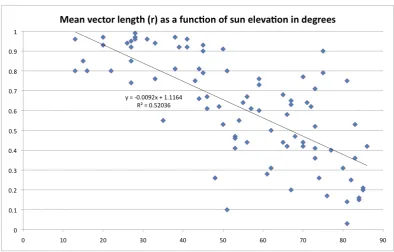
horizon and the sun azimuth is therefore particularly easy to determine (after 15:45, mean r = 0.87; the average length of the mean vector was significantly larger than in any other time interval, p,0.01). This is also reflected in the negative correlation between directedness of the fish and sun elevation (see Figure S2 in File S1). I.e. the lower the sun, the more directed the individual fish were during each single 20 min test session.
To sum up this section, the striking change in the fish’s directedness as a function of time of day indicates that they use a sun compass (e.g. [22,26,27]), since the easier the sun azimuth angle could be determined, the better the fish were able to orient. Sun compass orientation has been considered in fish [28], particularly in mosquitofish [29] and migrating salmon [30], and even though it has been suggested as a potential mechanism [31,32], there has been no direct experimental demonstration for any reef fish larvae.
Since sun position can only be used as a compass cue if time of day is taken into consideration [22,26,27], the key experiment needed to prove whether an animal uses a sun compass to determine its orientation direction, is a clock-shift experiment. One Tree Island is ideally suited for such an experiment. When fish are clock-shifted 6 hour backward (light on at 23:15, light out at 13:15) and then tested between 06:45 and 11:15 in the morning (see red curve and red dashed lines in Figure 2E), the summer tropical sun azimuth curve means that the sun azimuth is consistently 180610u different six hours later in the day. Thus, if our fish used a time-compensated sun compass to orient SSE, they should shift their orientation by 180u when clock-shifted 6 hours backward and should thus orient to the NNW.
We therefore clock-shifted five of the 2011 just-settling fish and all the 2012 pre-settlement fish 6 hours backwards (light on at 23:15, light out at 13:15). After being clock-shifted for 6 days, we re-tested their orientation under sunny skies before noon (06:45– 11:02) when the sun was in the East. However, since their shifted inner clock told them it was afternoon, the fish should expect the sun to be towards the West. If the fish use a time-compensated sun compass, they should therefore make a ,180u orientation ‘‘mistake’’ (red curve in Figure 2E). We conducted 44 individual tests with the 12 clock-shifted fish (for detailed information about each single test, see supplementary Table S3 in File S1).
Indeed, the 6 hours clock-shifted, just-settling fish tested in 2011 oriented significantly towards the NNW (Rayleigh Test: mean direction 344u, n = 5, r = 0.94, p,0.01; Figure 2B), while the nine non-clock-shifted fish continued to orient to the SSE, (Results shown in Figure 2A include data from non-shifted control fish tested at the same post-capture time as the clock-shifted fish, for full details see Table S1 and Table S3 in File S1). The same switch of orientation from SSE to NNW in the clock-shifted condition was observed when we replicated the experiment with pre-settlement fish in 2012 (Rayleigh Test: mean direction 321u, n = 7, r = 0.92, p,0.001; Figure 2D). When the mean directions chosen by each individual fish tested both before and after the clock-shift were compared, it was clear that all individuals strongly shifted their mean orientation in response to the clock-shift (Figure 3). The tests with the clock-shifted fish demonstrate that the fish have an internal clock (‘‘zeitgeber’’) that they use as part of a time-compensated sun compass to maintain their SSE heading.
Discussion
[image:4.612.61.299.90.283.2]Although it is not known how farO. doederleinilarvae disperse from the reef during their pre-settlement phase, genetic data presented here and in [2] indicate that distances beyond 10 kilometers occur regularly. Thus, we consider two likely situations:
Table 1.Genetic assignment of recently settled larvalO.
doederleinito adult reef populations.
Assigned larva* Rank 1 Score % Rank 2 Score %
OTI11,HM1 (cs) OTI 87.4 F 8.5
OTI11,HM3 (cs) F 77.7 H 10.5
OTI11,HM4 (cs) OTI 89.2 F 10.7
OTI11,HM5 (cs) F 55.9 OTI 41.8
OTI11,HM9 F 92.4 L 7.0
OTI11,HM10 (cs) OTI 86.3 F 13.1
OTI11,HM11 F 99.6 OTI 0.4
OTI11,HM12 OTI 55.6 F 44.2
OTI11,HM13 F 97.1 OTI 2.7
OTI11,HM19 OTI 80.5 H 14.6
OTI11,HM20 F 64.7 OTI 33.1
OTI11,HM21 F 55.7 OTI 34.1
OTI11,HM22 F 70.6 L 28.4
*One sample (OTI11, HM2) could not be used for genetics. ‘‘(cs)’’ means that this individual was clock-shifted after being tested under non-clock-shifted conditions. Genetic assignment of thirteen post-settlement larvae caught at the One Tree reef (OTI) tested for orientation in the sun compass using five microsatellite markers; the first two ranks (i.e. the two most likely origins of the larvae) and their probability score are shown. Statistical analysis was performed following the Bayesian approach by Rannala [52]. L (Lamont), H (Heron) F (Fitzroy).
(1) some larvae remain close to the reef, and (2) others drift further away on prevailing currents and may or may not return to the natal reef (see also Figure 4).
In the first case, OTI larvae would be retained in the reef vicinity within lee side eddies resulting from oscillating tidal currents [25,33] mostly north of the One Tree reef. For such larvae the sun compass might not be crucial, but it could still be useful to cross the reef crest and settle. In the second case, OTI larvae would be transported away from the tidal eddies by the weak but persistent and unidirectional NNW current resulting from the dominant SE trade winds. The observed SSE directional swimming would be an adaptation to counter long distance NNW drift. It is important to note that the much stronger tidal currents are oscillating East-West around the reef and thus contribute little to long-term, large-scale drift.
For larvae that drift farther away from their natal reef, such as our identified Fitzroy larvae, we suggest the following orientation-relevant chain of events: (I) a passive dispersal phase leading to drift away from the home reef; (II) an actively swimming, sun-compass guided phase to compensate for the drift; and (III) a multi-sensory settlement phase similar to the larvae that were retained near the reef.
We suggest the following pelagic dispersal and settlement scenario. Hatching, O. doederleini larvae leave the reef by tidal currents [34]. At the beginning of this passive dispersal phase, the larvae are immersed in natal reef water making imprinting on various home reef cues such as odor and sound possible. A dispersal model based on field-release of neutrally buoyant particles in the currents around the One Tree Reef [2] shows that the centre of the particle distribution on post-release day 8 has drifted to a location of ca. 20 kilometers NW of the One Tree Reef during flood tide and ca. 13 kilometers NNW during ebb tide, i.e. the drift current speed is ca. 13 km/8 days = 1.9 cm/s (Figure 4). Even though large-scale currents will vary with ocean basin
phenomena such as ENSO, this drift current is consistent with prevailing trade winds, which are remarkably stable around the study site; South-South Easterly 90% of the time. This predict-ability would facilitate the emergence of an innate mechanism for sun compass guided directionality by selection, year after year, in favor of the larvae that swim SSE. Since the time-compensation required for a sun compass needs to be learned (because the exact movement of the sun varies greatly with season and latitude), it is likely that this learning takes place during the early dispersal phase.
After about a week of dispersal, the larval swimming capabilities may now be sufficiently effective to start moving in a sun compass-based direction. In young birds, this direction is innate [35,36], and hatchling sea turtles show adaptive innate reactions to specific magnetic fields [23,37]). It is likely that the observed SSE swimming direction is innate in OTIO. doederleinilarvae, but this has not yet been demonstrated.
Could these reef fish larvae realistically compensate for the drift current? Although this species has not been tested for swimming speed, other cardinal fish can maintain speeds of 2 cm/s at hatching and 10 cm/s at settlement [9], which is faster than the slow NNW drift current of ca. 1.9 cm/s observed around OTI [2]. Over a two-week period of perfectly directed sustained swimming the larvae could theoretically cover up to 100 kilometers. However, the larvae are certainly not swimming perfectly SSE and they do not swim all the time. It is nevertheless plausible that sun-compass directed swimming could, in principle, help them return from the 13–20 kilometer drift distance calculated for their early larval period back to the general vicinity of their natal reef. Homing may be facilitated further if the larvae choose favorable currents at different water depths and tidal periods [38,39]. The constant tidal oscillations generate a permanent odor halo extending several kilometers around each reef, which would further increase the chances of larvae detecting the vicinity of the natal reef. The suggested sun compass guided swimming response is likely to continue until the larvae recognize the odor halo and/ or sound of their natal reef, which present a much larger homing target for returning larvae than the reef itself. A larger target allows for greater variance in large-scale currents and homing precision. Surely, the majority of larvae get lost or perish otherwise, but their sun compass directed swimming behavior observed here would increase the likelihood of relocating the area of origin including the natal reef and thus be of evolutionary advantage compared to fish not performing this behavior (Figure 4).
Finally, once the larvae are in the vicinity of their natal reef, we expect them to start using other more local homing cues such as sound [11,13,40] and/or odor [14]. The succession of orientation mechanisms suggested here for reef fish larvae is similar to the innate mechanisms used by birds and monarch butterflies during migration: first a compass mechanism based on global cues for the long-distance navigation phase followed by a homing process based on more local cues (e.g. [22,24,35,36]).
In conclusion, here we provide data documenting that reef fish larvae possess and can use a time-compensated sun compass. Our experiments include the critical clock-shifted condition and an internal replication performed in two different years. Our data show that both pre-settlement and recently settled larvae of O. doederleini can use a time-compensated sun compass to keep a consistent direction. This direction seems adapted to compensate for drift away from the natal reef and its surroundings. This orientation mechanism, well-known in various terrestrial animals, is well-suited to explain how dispersing fish larvae can avoid
[image:5.612.60.195.58.202.2]distance drift into unsuitable habitat and relocate their natal region from a greater distance.
The use of a time-compensated sun compass would be particularly valuable to species on isolated islands in steady ocean currents, where loss of sensory contact with the home reef is lethal and an innate swimming direction could easily evolve. We predict that fish tested at different locations with differently directed drift currents will show time-compensated, sun compass directed swimming in correspondingly different directions. We might even suggest that the combination of sun-compass-based directed swimming and natal reef recognition could be a significant factor in explaining the extraordinary biodiversity of coral reef fish species. Innate orientation supports homing, which can lead to
genetic isolation and potential speciation as observed in migratory birds [41].
Materials and Methods
Ethics Statement
[image:6.612.60.431.59.478.2]Fish collection permits were obtained from the Great Barrier Reef Marine Park Authority (G10/33239.1) and Queensland Department of Primary Industries and Fisheries (103256). The research was carried out in accordance with the Australian Code of Practice for the care and use of animals for scientific purposes. The protocol was approved by the Ethics Review Committee of
Figure 4. Model illustrating how a time-compensated sun compass could help passively drifted reef fish larvae to relocate their natal OTI reef.Red dots indicate the locations at ebb tide of passively dispersed particles 8 days after release from One Tree Reef according to the dispersal experiments and model calculations (Red dots drawn after Fig. 1C in reference [2]). At flood tide the dots will be displaced 5–7 km WNW. Notice that most larvae considered as passive particles for their first 8 days would be transported significantly to the NNW beyond the odor halo of OTI (idealized odor halos in decreasing intensity blue) and even beyond neighboring reefs to the NNW before they gain sustained swimming capabilities. The polar diagram shows the time-compensated sun compass orientation of just-settled (
N
) and pre-settlement (o) larvae (Figure 2A and 2C combined: mean direction 155u, n = 21, r = 0.89, p,0.001). One-week oldO. doederleinilarvae (symbolized by the dispersed cloud of red dots) would be more likely to relocate the OTI reef if they used a sun compass to swim actively toward SSE, than if they would swim in random directions. Picture shows settling stageOstorhinchus doederleini.James Cook University (Permit Number: A1614). All efforts were made to minimize suffering.
Experimental Animals
The experiments were performed at the Field Station on One Tree Island (23.30900 S, 152.05900 E), a reef in the Capricorn-Bunker group of Islands in the southern Great Barrier Reef, Australia (Figure 1). In 2011, we collected newly settledOstorhinchus doederleinion ‘‘patch-reefs’’ that were constructed from small coral rubble piles equivalent to natural substrates for settlingO. doederleini
[42]. The patch reefs (dimensions ,1 m61 m60.5 m) were located on sand areas in one of the main entrances into the lagoon, 10 to 80 m from a main reef in 4–5 m water depth. Since settlement takes place at night [34] and we cleared the patch reefs early each day, the collected fish would only have been post-settlement for a few hours. They had pelagic (no-stripe) pigmentation. Using the otolith daily aging technique, we determined that the mean age of settlers that had arrived at the same time as the tested fish was 20.5 days, ranging from 16 to 35 days (n = 30). This overlaps with the youngest age of newly settled fish found at patch reefs in the lagoon [42].
In 2012, true pre-settlement O. doederleini were caught with channel nets that were set to fish on the flood tides only at night on 20thand 21stof January 2012; current speeds were 35 cm/sec or more. The nets (n = 2) were square mouthed (0.7560.75 m), the mesh was 500mm, organized as a box/pyramid with an efficiency of 1:12 (mouth area: open sifting surface; full procedures see [43]). Pre-settlementO. doederleiniwere easily identified by morphology and a black dot on the caudal peduncle.
The collected fish measured 10–13 mm at the beginning of the experiments and 11–15 mm at the end of the experiments. The fish were kept in individual tanks made of plastic or glass. Each tank contained one piece of dead coral and fresh OTI Reef water, which was oxygenated with a bubble stone and partly changed once every 24 hours. The fish tanks were kept in a wet lab with an opening pointing towards N and translucent plastic ‘‘windows’’ on parts of the east and west sides allowing light to come in but through which no clear contours could be observed. The fish never had access to direct views of the sun from within their holding tanks but the non-clock-shifted fish will in some cases have been able to see parts of blue sky towards the North. Once per day, the fish were fed plankton caught during night-time plankton tows.
Orientation Tests
Orientation tests with these,12 mm larvae were performed in a clear plastic circular bowl (17 cm [diameter]612 cm [depth]) allowing the fish a good view of the sky all the way down to the horizon. This bowl was placed on a leveled wooden platform on which a sundial of black lines was drawn in 22.5 degree segments relative to magnetic North. A finer angular resolution for recording fish position does not make sense given the size of the fish and the size of the bowl, but with 40 directions recorded, this resolution is more than sufficient to record the fish’s preferred direction. Each fish was tested separately. A given test was performed as follows: The fish was transferred from its home aquarium in the wet lab to the testing bowl on the beach with a small glass jar. It was carefully released into the middle of the bowl. After ca. 60 sec of acclimation, its geographic position relative to the centre of the bowl was recorded in 30 sec intervals for the next 20 min. The observer simply noted down, which of the black lines in the sun dial was closest to the head of the fish.
The fish spent the vast majority of their time hovering somewhere near the edge of the bowl. The fish position relative to the centre of the bowl was used as the directional measure
rather than their heading, since they can move no further in any given direction once it reaches the edge of the bowl. Most of our fish clearly showed a preferred direction by either hovering fairly stationary or by slowly swimming back-and-fourth along the edge of the bowl around their preferred direction, or by moving away and quickly returning to the edge near the preferred direction. This behavior confirms that position in the bowl relative to the centre of the bowl is the most relevant orientation measure.
The observer sat on a stool next to the bowl. The observer systematically rotated position relative to the bowl (N, E, S, or W) between tests, so that the observer sat north of the bowl during 25% of the tests, south of the bowl in 25% of the tests, east of the bowl in 25% of the tests, and west of the bowl in 25% of the tests. The consistency of the fish’s orientation (Figure 2A–D and Figure S1 in File S1) shows that the position of the observer had no significant effect on the directional choices of the fish (see Figure S3 in File S1). If a strong observer bias would have existed, the distributions in Figure 2A–D should have been random or quadrimodal since the observer position was balanced between N, S, E, and W. In sum, observer bias could never haveimproved
the clarity of the results. In contrast, any slight observer bias would have added a symmetrical distribution component to the results and therefore reduced the clarity of the observed directional responses.
At the end of the test, the fish was transferred back to its holding tank. Between tests, the water in the test bowl was replaced by fresh OTI reef sea water.
Individual fish were tested at least three times (3–5 times) in each condition (for details see supplementary information, Tables S1–S4 in File S1). It is known from the vast literature on orientation tests with migratory birds that repeated tests are needed to determine the intended mean orientation direction of an individual with reasonable accuracy (e.g. [44,45,46,47,48]). By using average directions based on repeated tests of the same individuals, the number of experimental animals can also be significantly reduced, which is an important ethical consideration in modern biology.
Clock-shifting
were not affected by local landmarks visible through the sides of the bowl.
Evaluation of Results and Circular Statistics
The evaluation of the orientation data was done using the standard methods applied in animal orientation studies [49]. The circular statistics program Oriana was used to calculate the mean and concentration of the 40 observed directions. All orientation directions recorded were corrected for the declination at One Tree Island (by turning the results 10 degrees counter-clockwise; e.g. an orientation towards 167 degrees relative to magnetic North is equivalent to 157 degrees relative to geographic North at One Tree Island) so that North in all figures and calculations refers to geographical North, not magnetic North, as geographical North is the relevant reference for a sun compass.
Since we cannot completely exclude that each individual observation may be somewhat dependent on the previous location of the fish, for the circular diagrams, we only included the results of single tests where the orientation of the fish was very clearly directed (very clearly directed = tests where the directionality was significant at the p,0.001 level according to the Rayleigh test; [49]). This criterion was reached in 114 out of 132 individual tests (86%, see Table S1 and Table S3 in File S1). Of the 18 tests that did not reach this very conservative significance level, 10 were performed between 11:15 and 12:45, when the sun is so high in the sky and the sun azimuth changes so fast that it is unlikely that a sun compass would work, see Figure 2E). Thus, only 8 individual tests (6% of the 132 tests), done when the sun azimuth was likely to have provided useful information, resulted in disoriented behavior. To give the reader the clearest impression of the variability in the test results, in the supplementary materials (File S1), we depict the data in two different ways. In Figure S1A, S1C, S1E and S1G in File S1, we include the results of all individual tests. In this kind of illustration, several separate tests of the same fish are included and thus the stated ‘‘n’’ is pseudo-replicated. However, it is known from orientation experiments with birds that the inter- and intra-individual variation in orientation are similar [45]. The fact that the 95% confidence intervals in our experiments remained almost identical regardless whether all tests or individual means are depicted (compare Figure S1A with S1B, S1C with S1D, S1E with S1F, and S1G with S1H, all in File S1) shows that intra- and inter-individual variation are also similar for our fish. Even though some readers may find this additional graph superfluous, we find it important to also present the results of all individual tests in a circular diagram, since it gives the reader a good impression of the spread in orientation observed between tests.
The second order mean directions of 3–5 tests per individual (Figure 2A–D, and Fig. S1B, S1D, S1F, and S1H in File S1) were calculated by vector addition of unit vectors in each of the mean directions from the individual tests (see Table S4 in File S1). This is the standard procedure used in the literature on migratory birds tested in orientation cages for the last four decades (e.g. [44,46,47,48,49]).
Time-of-day effects (Figure 2F) on the directedness of the individual tests were evaluated post hoc resulting in slightly different sample sizes. As a measure for directedness we use the length of the mean vector, ‘‘r’’, for each individual test. The r-value is a measure of how consistently a given fish oriented in its chosen mean direction during a single 20-minute test session. This analysis is based on the logic that if a fish has access to good orientation cues, it should orient more consistently in whatever direction it chooses than if a fish has access to poor orientation relevant information, e.g. because the azimuth angle is difficult to determine due to the sun being very close to the zenith. To avoid any concern about pseudoreplication in this post hoc analysis, the average r-value of the two tests was entered into the calculations if a given fish had been tested twice during the same time-period. The data leading to Figure 2F are provided in supplementary materials (Table S2 in File S1).
Genetic Analysis
Tissue of test animals was stored in 99% ethanol until DNA extraction. DNA was isolated from the samples using Chelex chelating resin (BioRad Chelex 100 Resin). We used five previously described polymorphic DNA microsatellite markers: Ad65.2, Ad67 Ad70 Ad86.2, Ad94 Table 1 [50]. PCR was carried out using approximately 100 ng of template DNA and the following cycle treatment; initial step of 5 min at 94uC, followed by 35 cycles of 30 s at 94uC, 30 s at 44–46uC, and 1 min at 72uC, with a final extension step of 5 min at 72uC. Total reaction volume was 10mL and contained 2.5mL 10 X RED Taq Polymerase Buffer (Sigma, 10 mM Tris-HCl, pH 8.3, 50 mM KCl, 1.1 mM MgCl2 and 0.01% gelatin), 100mM of each dNTP (Promega), 0.5mM of both forward and reverse primer, and 0.5 U Taq polymerase (Sigma) 0.25 U RED Taq DNA Polymerase (Sigma). PCR fragments were separated and scored on a Beckman-Coulter CEQTM 2000XL DNA analysis system.
Sun compass tested juveniles were statistically assigned to adult populations of adjacent reefs (OTI, Lamont, heron, Fitzroy reefs) using Geneclass2 [51].
Supporting Information
File S1 Supporting Figures S1, S2, S3, and Supporting Tables S1, S2, S3, and S4.
(PDF)
Acknowledgments
We thank Mark O’Callaghan and John Majoris for assistance with sample collection; Andreas Bally for help with the experiments and figures.
Author Contributions
Conceived and designed the experiments: HM GG. Performed the experiments: HM GG. Analyzed the data: HM GG JA MJK. Contributed reagents/materials/analysis tools: HM GG JA MJK. Wrote the paper: HM GG JA MJK.
References
1. Planes S, Parroni M, Chauvet C (1997) Evidence of limited gene flow in three species of coral reef fishes in the lagoon of New Caledonia. Mar Biol 130: 361– 368.
2. Gerlach G, Atema J, Kingsford MJ, Black KP, Miller-Sims V (2007) Smelling home can prevent dispersal of reef fish larvae. Proc Natl Acad Sci USA 104: 858–863.
3. Jones GP, Almany GR, Russ GR, Sale PF, Steneck RS, et al. (2009) Larval retention and connectivity among populations of corals and reef fishes: history, advances and challenges. Coral Reefs 28: 307–325.
4. Barber PH, Moosa MK, Palumbi SR (2002) Rapid recovery of genetic populations on Krakatau: diversity of stomatopod temporal and spatial scales of marine larval dispersal. Proc R Soc Lond B 269: 1591–1597.
5. Almany GR, Berumen ML, Thorrold SR, Planes S, Jones GP (2007) Local replenishment of coral reef fish populations in a marine reserve. Science 316: 742–744.
7. Armsworth PR (2000) Modelling the swimming response of late stage larval reef fish to different stimuli. Mar Ecol Prog Ser 195: 231–247.
8. Cowen RK, Paris CB, Srinivasan A (2006) Scaling of connectivity in marine populations. Science 311: 522–527.
9. Fisher R, Bellwood DR, Job SD (2000) Development of swimming abilities in reef fish larvae. Mar Ecol Prog Ser 202: 163–173.
10. Stobutzki I, Bellwood DR (1997) Sustained swimming abilities of the late pelagic stages of coral reef fishes. Mar Ecol Prog Ser 149: 35–41.
11. Leis JM, Carson-Ewart BM, Cato DH (2002) Sound detection in situ by the larvae of a coral-reef damselfish (Pomacentridae). Mar Ecol Prog Ser 232: 259– 268.
12. Tolimieri N, Jeffs A, Montgomery JC (2000) Ambient sound as a cue for navigation by the pelagic larvae of reef fishes. Mar Ecol Prog Ser 207: 219–224. 13. Radford CA, Stanley JA, Simpson SD, Jeffs AG (2011) Juvenile coral reef fish
use sound to locate habitats. Coral Reefs 30: 295–305.
14. Atema J, Kingsford M, Gerlach G (2002) Larval reef fish could use odour for detection, retention and orientation to reefs. Mar Ecol Prog Ser 241: 151–160. 15. Dixson DL, Jones GP, Munday PL, Planes S, Pratchett MS, et al. (2008) Coral reef fish smell leaves to find island homes. Proc Roy Soc Lond B 275: 2831– 2839.
16. Mann DA, Casper BM, Boyle KS, Tricas TC (2007) On the attraction of larval fishes to reef sounds. Mar Ecol Prog Ser 338: 307–310.
17. Hogan JD, Thiessen RJ, Sale PF, Heath DD (2012) Local retention, dispersal and fluctuating connectivity among populations of a coral reef fish. Oecologia 168: 61–71.
18. Chapman JW, Reynolds DR, Mouritsen H, Hill JK, Riley JR, et al. (2008) Wind selection and drift compensation optimize migratory pathways in a high-flying moth. Curr Biol 18: 514–518.
19. Mouritsen H, Mouritsen O (2000) A mathematical expectation model for bird navigation based on the clock-and-compass strategy. J Theor Biol 207: 283–291. 20. Alerstam T (1996) The geographical scale factor in orientation of migrating
birds. J Exp Biol 199: 9–19.
21. Helbig AJ, Berthold P, Wiltschko W (1989) Migratory orientation of blackcaps (Sylvia atricapilla) - population-specific shifts of direction during the autumn. Ethology 82: 307–315.
22. Mouritsen H, Frost BJ (2002) Virtual migration in tethered flying monarch butterflies reveals their orientation mechanisms. Proc Nat Acad Sci USA 99: 10162–10166.
23. Fuxjager MJ, Eastwood BS, Lohmann KJ (2011) Orientation of hatchling loggerhead sea turtles to regional magnetic fields along a transoceanic migratory pathway. J Exp Biol 214: 2504–2508.
24. Mouritsen H, Derbyshire R, Stalleicken J, Mouritsen OØ, Frost BJ, et al. (2013) An experimental displacement and over 50 years of tag-recoveries show that monarch butterflies are not true navigators. Proc Nat Acad Sci USA 110: 7348– 7353.
25. Burgess SC, Kingsford MJ, Black KP (2007) Influence of tidal eddies and wind on the distribution of presettlement fishes around One Tree Island, Great Barrier Reef. Mar Ecol Prog Ser 341: 233–242.
26. Kramer G (1952) Experiments on bird orientation. Ibis 94: 265–285. 27. Wehner R (1998) Navigation in context: grand theories and basic mechanisms.
J Avian Biol 29: 370–386.
28. Hasler AD, Horrall RM, Wisby WJ, Braemer W (1958) Sun-orientation and homing in fishes. Limnol Ocean 3: 353–361.
29. Goodyear CP, Ferguson DE (1969) Sun-compass orientation in mosquitofish, Gambusia affinis. Anim Behav 17: 636–640.
30. Quinn TP (1980) Evidence for Celestial and Magnetic Compass Orientation in Lake Migrating Sockeye Salmon Fry. J Comp Physiol 137: 243–248. 31. Leis JM, Siebeck U, Dixson DL (2011) How Nemo finds home: The
neuroecology of dispersal and of population connectivity in larvae of marine fishes. Integ Comp Biol 51: 826–843.
32. Leis JM, Carson-Ewart BM (2003) Orientation of pelagic larvae of coral-reef fishes in the ocean. Mar Ecol Prog Ser 252: 239–253.
33. Paris CB, Cowen RK (2004) Direct evidence of a biophysical retention mechanism for coral reef fish larvae. Limnol Ocean 49: 1964–1979. 34. Kingsford MJ (2001) Diel patterns of abundance of presettlement reef fishes and
pelagic larvae on a coral reef. Mar Biol 138: 853–867.
35. Berthold P, Helbig A, Mohr G, Querner U (1992) Rapid microevolution of migratory behavior in a wild bird species. Nature 360: 668–670.
36. Mouritsen H (2003) Spatiotemporal orientation strategies of long-distance migrants. In: Berthold P, Gwinner E, Sonnenschein E, editors. Avian Migration. Berlin: Springer Verlag 493–513.
37. Lohmann KJ, Cain SD, Dodge SA, Lohmann CMF (2001) Regional magnetic fields as navigational markers for sea turtles. Science 294: 364–366. 38. Fiksen O, Jorgensen C, Kristiansen T, Vikebo F, Huse G (2007) Linking
behavioural ecology and oceanography: larval behaviour determines growth, mortality and dispersal. Mar Ecol-Prog Ser 347: 195–205.
39. Chapman JW, Klaassen RHG, Drake VA, Fossette S, Hays GC, et al. (2011) Animal Orientation Strategies for Movement in Flows. Curr Biol 21: R861– R870.
40. Kingsford MJ, Leis JM, Shanks A, Lindeman KC, Morgan SG, et al. (2002) Sensory environments, larval abilities and local self- recruitment. Bull Mar Sci 70: 309–340.
41. Bearhop S, Fiedler W, Furness RW, Votier SC, Waldron S, et al. (2005) Assortative mating as a mechanism for rapid evolution of a migratory divide. Science 310: 502–504.
42. Finn MD, Kingsford MJ (1996) Two-phase recruitment of apogonids (Pisces) on the Great Barrier Reef. Mar Freshw Res 47: 423–432.
43. Kingsford M, Finn M (1997) The influence of phase of the moon and physical processes on the input of presettlement fishes to coral reefs. J Fish Biol 51: 176– 205.
44. Zapka M, Heyers D, Hein CM, Engels S, Schneider NL, et al. (2009) Visual but not trigeminal mediation of magnetic compass information in a migratory bird. Nature 461: 1274–U1108.
45. Wiltschko R, Wiltschko W (1978) Relative importance of stars and the magnetic field for the accuracy of orientation in night-migrating birds. Oikos 30: 195–206. 46. Wiltschko W, Munro U, Ford H, Wiltschko R (1993) Red light disrupts
magnetic orientation of migratory birds. Nature 364: 525–527.
47. Hein CM, Engels S, Kishkinev D, Mouritsen H (2011) Robins have a magnetic compass in both eyes. Nature 471: E11–E12.
48. Hein CM, Zapka M, Heyers D, Kutzschbauch S, Schneider NL, et al. (2010) Night-migratory garden warblers can orient with their magnetic compass using the left, the right or both eyes. J Roy Soc Interface 7: S227–S233.
49. Batschelet E (1981) Circular Statistics in Biology. London: Academic Press. 50. Miller-Sims V, Atema J, Kingsford MJ, Gerlach G (2004) Characterization and
isolation of DNA microsatellite primers in the cardinalfish (Apogon doederleini). Mol Ecol Notes 4: 336–338.
51. Piry S, Alapetite A, Cornuet JM, Paetkau D, Baudouin L, et al. (2004) GENECLASS2: A software for genetic assignment and first-generation migrant detection. J Heredity 95: 536–539.
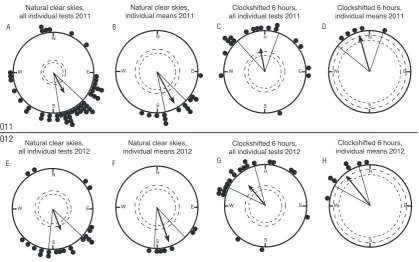
Figure S1. Inter-‐ and intra-‐individual variation in orientation is similar in our settling stage
Ostorhinchus doederleini
. A: Forty-‐nine single tests under natural sunny skies with 14 just-‐
settled
O. doederleini
tested in 2011 showed a clear orientation towards SSE, both when all
the individual tests were considered (A: mean direction: 162°, r=0.56, n=49, p<0.001) and
when only the second order means of each of the tested individuals were considered (B:
mean direction: 162°, r=0.88, n=14, p<0.001). When five fish were clock-‐shifted 6 hours
backwards, they turned their orientation by ca. 180° (C: all individual tests, mean direction:
359°, r=0.58, n=19, p<0.001; D: individual second order means, mean direction: 354°, r=0.94,
n=5, p<0.01). Twenty-‐two single tests under natural sunny skies with 7 pre-‐settlement
O.
doederleini
tested in 2012 also showed a clear orientation towards SSE, both when all the
individual tests were considered (E: mean direction: 169°, r=0.57, n=22, p<0.001) and when
only the second order means of each of the tested individuals were considered (F: mean
direction: 171°, r=0.91, n=7, p<0.001). When all 7 fish were clock-‐shifted 6 hours backwards,
they turned their orientation by ca. 180° (G: all individual tests, mean direction: 330°, r=0.62,
n=21, p<0.001; H: individual second order means, mean direction: 331°, r=0.92, n=7,
p<0.001). Notice that the 95% confidence intervals (lines flanking the group mean vector) in
our experiments remained almost identical regardless whether all tests or individual means
are depicted (compare Fig. S1A with S1B, S1C with S1D, S1E with S1F, and S1G with S1H).
This is only to be expected if the intra-‐ and inter-‐individual variation in orientation is very
similar for our fish. Each dot at the circle periphery indicates the mean orientations observed
in each of the individual tests done under the given condition (A, C, E, G) or the mean
orientation chosen by each individual fish based on the second order average of all tests of
the given fish in the given condition (B, D, F, H). Arrows indicate the group mean vectors.
Inner and outer dashed circles indicate the radius of the group mean vector needed for
significance according to the Rayleigh Test (p<0.05 and p<0.01, respectively).
N
E
S W
Natural clear skies, all individual tests 2011 A
N
E
S W
Natural clear skies, individual means 2011
N
E
S W
Natural clear skies, individual means 2012
N
E
S W
Clockshifted 6 hours, all individual tests 2011
N
E
S W
Clockshifted 6 hours, individual means 2011 C
B D
N
E
S W
Natural clear skies, all individual tests 2012
E
N
E
S W
Clockshifted 6 hours, all individual tests 2012
N
E
S W
Clockshifted 6 hours, individual means 2012
G H
F
[image:10.595.78.498.96.358.2]Figure S2. The lower the sun elevation, the better the fish were able to keep their
chosen heading. The y-‐axis indicates the r-‐value for each individual test (the length of
the mean vector of the 40 recorded single direction in a given single test). The x-‐axis
indicates the sun elevation in degrees. There is a highly significant negative correlation
between the r-‐value and the sun elevation, which means that the higher the sun
elevation is, the poorer the fish are able to keep a chosen direction.
Figure S3. Evidence for no significant observer bias. The observer’s position is
defined as 0 degrees and the orientation of each individual fish in the non-‐clock-‐shifted
condition is indicated by the dots at the circle periphery (2011 and 2012 fish combined).
Thus, a point in 0 degrees would mean that the fish oriented towards the observer and a
point in 180 degrees would mean that the fish oriented away from the observer. The
distribution is random (mean direction 169°, r=0.12, n=87, n.s.). For description of the
circular diagram, see legend to Figure S1.
0
90
180 -90
[image:11.595.72.467.66.318.2] [image:11.595.78.250.482.656.2]start of the given 20 minute test. “r” is the length of the mean vector calculated from the 40
individual directions recorded during the individual test. “p” is the p-value resulting from a
Rayleigh Test. However, since each individually recorded direction is unlikely to be
completely independent, to be conservative, we demanded a p<0.001 for inclusion of the
direction in the circular diagrams (Figure 1A-D and Figure S1).
[image:12.595.80.479.180.771.2]
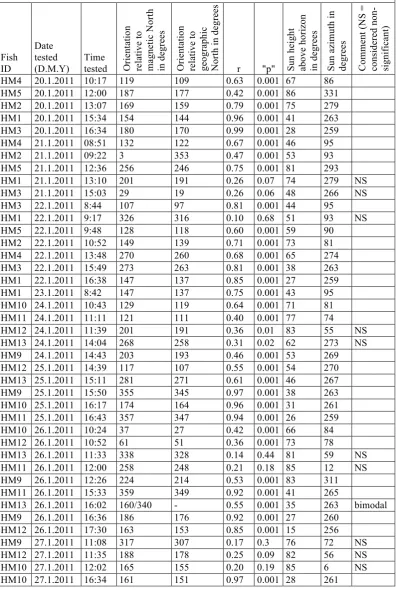
Table S1.
Fish ID Date tested (D.M.Y) Time tested Orientat io n re la ti ve to ma gn et ic N or th in d eg re es Or ie nt at io n re la ti ve to ge ogr aphi c No rt h in d eg re es
r "p" Sun
he ig ht ab ov e ho ri zo n in de gr ee s Su n az im ut h in de gr ee s Co m m en t ( N S = co ns id er ed n on -si gn if ic an t)
HM4 20.1.2011 10:17 119 109 0.63 0.001 67 86
HM5 20.1.2011 12:00 187 177 0.42 0.001 86 331
HM2 20.1.2011 13:07 169 159 0.79 0.001 75 279
HM1 20.1.2011 15:34 154 144 0.96 0.001 41 263
HM3 20.1.2011 16:34 180 170 0.99 0.001 28 259
HM4 21.1.2011 08:51 132 122 0.67 0.001 46 95
HM2 21.1.2011 09:22 3 353 0.47 0.001 53 93
HM5 21.1.2011 12:36 256 246 0.75 0.001 81 293
HM1 21.1.2011 13:10 201 191 0.26 0.07 74 279 NS
HM3 21.1.2011 15:03 29 19 0.26 0.06 48 266 NS
HM3 22.1.2011 8:44 107 97 0.81 0.001 44 95
HM1 22.1.2011 9:17 326 316 0.10 0.68 51 93 NS
HM5 22.1.2011 9:48 128 118 0.60 0.001 59 90
HM2 22.1.2011 10:52 149 139 0.71 0.001 73 81
HM4 22.1.2011 13:48 270 260 0.68 0.001 65 274
HM3 22.1.2011 15:49 273 263 0.81 0.001 38 263
HM1 22.1.2011 16:38 147 137 0.85 0.001 27 259
HM1 23.1.2011 8:42 147 137 0.75 0.001 43 95
HM10 24.1.2011 10:43 129 119 0.64 0.001 71 81
HM11 24.1.2011 11:11 121 111 0.40 0.001 77 74
HM12 24.1.2011 11:39 201 191 0.36 0.01 83 55 NS
HM13 24.1.2011 14:04 268 258 0.31 0.02 62 273 NS
HM9 24.1.2011 14:43 203 193 0.46 0.001 53 269
HM12 25.1.2011 14:39 117 107 0.55 0.001 54 270
HM13 25.1.2011 15:11 281 271 0.61 0.001 46 267
HM9 25.1.2011 15:50 355 345 0.97 0.001 38 263
HM10 25.1.2011 16:17 174 164 0.96 0.001 31 261
HM11 25.1.2011 16:43 357 347 0.94 0.001 26 259
HM10 26.1.2011 10:24 37 27 0.42 0.001 66 84
HM12 26.1.2011 10:52 61 51 0.36 0.001 73 78
HM13 26.1.2011 11:33 338 328 0.14 0.44 81 59 NS
HM11 26.1.2011 12:00 258 248 0.21 0.18 85 12 NS
HM9 26.1.2011 12:26 224 214 0.53 0.001 83 311
HM11 26.1.2011 15:33 359 349 0.92 0.001 41 265
HM13 26.1.2011 16:02 160/340 - 0.55 0.001 35 263 bimodal
HM9 26.1.2011 16:36 186 176 0.92 0.001 27 260
HM12 26.1.2011 17:30 163 153 0.85 0.001 15 256
HM9 27.1.2011 11:08 317 307 0.17 0.3 76 72 NS
HM12 27.1.2011 11:35 188 178 0.25 0.09 82 56 NS
HM10 27.1.2011 12:02 165 155 0.20 0.19 85 6 NS
HM20 28.1.2011 16:58 207 197 0.80 0.001 22 259
HM19 28.1.2011 17:26 171 161 0.80 0.001 16 257
HM19 29.1.2011 11:31 193 183 0.31 0.02 80 57 NS
HM20 29.1.2011 11:55 97 87 0.15 0.42 84 23 NS
HM13 29.1.2011 12:18 307 297 0.16 0.37 84 330 NS
HM19 29.1.2011 13:16 224 214 0.52 0.001 73 285
HM20 29.1.2011 13:45 241 231 0.58 0.001 66 278
HM9 29.1.2011 14:55 194 184 0.91 0.001 50 270
HM11 29.1.2011 15:18 174 164 0.93 0.001 45 268
HM12 30.1.2011 9:12 160 150 0.62 0.001 49 90
HM19 30.1.2011 9:45 147 137 0.61 0.001 57 87
HM13 30.1.2011 10:33 124 114 0.47 0.001 68 80
HM22 31.1.2011 11:56 18 8 0.03 0.96 81 50 NS
HM21 31.1.2011 13:11 169 159 0.41 0.001 73 288
HM20 31.1.2011 13:40 121 111 0.20 0.22 67 281 NS
HM22 31.1.2011 14:28 177 167 0.67 0.001 56 273
HM12 31.1.2011 14:51 147 137 0.80 0.001 51 271
HM20 31.1.2011 15:22 153 143 0.66 0.001 44 268
HM11 1.2.2011 8:55 148 138 0.90 0.001 45 91
HM22 1.2.2011 9:54 152 142 0.73 0.001 59 85
HM21 1.2.2011 14:02 109 99 0.50 0.001 62 278
HM22 1.2.2011 14:32 121 111 0.64 0.001 55 273
HM21 1.2.2011 15:15 195 185 0.79 0.001 45 269
OTI20 20.1.2012 10:37 193 183 0.77 0.001 70 85
OTI21 20.1.2012 11:01 138 128 0.90 0.001 75 80
OTI22 20.1.2012 13:17 203 193 0.62 0.001 72 277
OTI23 20.1.2012 13:42 333 323 0.65 0.001 67 273
OTI24 20.1.2012 14:05 180 170 0.28 0.04 61 271 NS
OTI20 20.1.2012 14:30 71 61 0.44 0.001 56 268
OTI21 20.1.2012 14:53 180 170 0.53 0.001 50 266
OTI22 20.1.2012 15:18 194 184 0.79 0.001 45 264
OTI23 20.1.2012 15:42 213 203 0.92 0.001 39 262
OTI24 20.1.2012 16:08 142 132 0.94 0.001 33 261
OTI20 20.1.2012 16:08 129 119 0.76 0.001 33 261
OTI21 20.1.2012 16:37 237 227 0.95 0.001 27 258
OTI22 20.1.2012 16:37 60 50 0.74 0.001 27 258
OTI24 20.1.2012 17:09 126 116 0.93 0.001 20 256
OTI23 20.1.2012 17:09 173 163 0.97 0.001 20 256
OTI23 20.1.2012 17:38 147 137 0.80 0.001 13 254
OTI24 20.1.2012 17:38 138 128 0.96 0.001 13 254
OTI26 21.1.2012 9:23 166 156 0.47 0.001 53 93
OTI25 21.1.2012 9:23 164 154 0.41 0.001 53 93
OTI26 21.1.2012 9:50 206 196 0.76 0.001 59 90
OTI25 21.1.2012 10:14 184 174 0.44 0.001 65 88
OTI26 21.1.2012 10:38 225 215 0.42 0.001 70 84
OTI25 21.1.2012 10:38 346 336 0.44 0.001 70 84
different time of day intervals for the
non-clock-shifted larvae tested in 2011.
Data
originates from Table S1 (column 6). The mean time for any given 20 min test (i.e. “Time
tested” + 10 min) decided in which time interval the test was considered. The third column in
this table gives the mean r-value for each individual fish that was tested in a given time
interval, and these values were used in the calculations of the means and standard deviations
as indicated on Figure 1F and for the subsequent ANOVA.
[image:14.595.322.530.191.684.2]
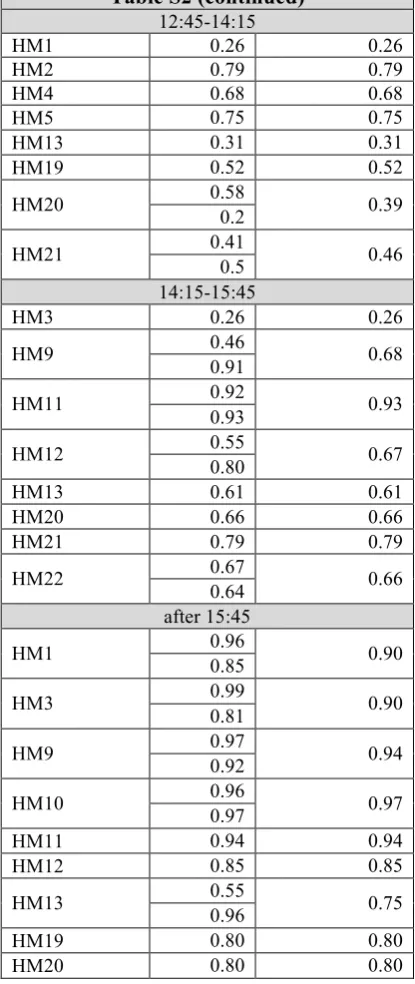
Table S2
Fish ID
r-value
in single
tests
Mean
r-value used
for Figure 1F
8:00-9:45 0.10 HM1
0.75 0.43
HM2 0.47 0.47
HM3 0.81 0.81
HM4 0.67 0.67
HM11 0.90 0.90
HM12 0.62 0.62
9:45-11:15
HM2 0.71 0.71
HM4 0.63 0.63
HM5 0.60 0.60
0.64 HM10
0.42 0.53
HM12 0.36 0.36
HM13 0.47 0.47
HM19 0.61 0.61
HM22 0.73 0.73
11:15-12:45
HM5 0.42 0.42
0.53 HM9
0.17 0.35
HM10 0.20 0.20
0.40 HM11
0.21 0.31
0.36 HM12
0.25 0.30
0.14 HM13
0.16 0.15
HM19 0.31 0.31
HM20 0.15 0.15
HM22 0.03 0.03
Table S2 (continued)
12:45-14:15
HM1 0.26 0.26
HM2 0.79 0.79
HM4 0.68 0.68
HM5 0.75 0.75
HM13 0.31 0.31
HM19 0.52 0.52
0.58 HM20
0.2 0.39
0.41 HM21
0.5 0.46
14:15-15:45
HM3 0.26 0.26
0.46 HM9
0.91 0.68
0.92 HM11
0.93 0.93
0.55 HM12
0.80 0.67
HM13 0.61 0.61
HM20 0.66 0.66
HM21 0.79 0.79
0.67 HM22
0.64 0.66
after 15:45 0.96 HM1
0.85 0.90
0.99 HM3
0.81 0.90
0.97 HM9
0.92 0.94
0.96 HM10
0.97 0.97
HM11 0.94 0.94
HM12 0.85 0.85
0.55 HM13
0.96 0.75
HM19 0.80 0.80
the given 20 minute test. “r” is the length of the mean vector calculated from the 40 individual
directions recorded during the individual test. “p” is the p-value resulting from a Rayleigh
Test. However, since each individually recorded direction is unlikely to be completely
independent, to be conservative, we demanded a p<0.001 for inclusion of the direction in the
circular diagrams (Figure 1A-D and Figure S1).
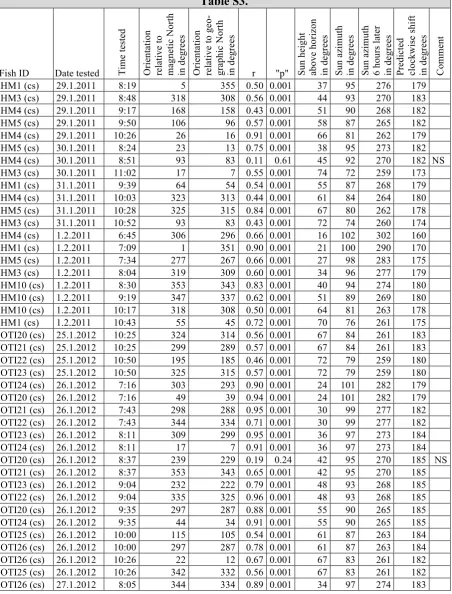
Table S3.
Fish ID Date tested Tim
e te st ed Or ie nt at io n re la ti ve to ma gn et ic N or th in d eg re es Or ie nt at io n re la ti ve to g eo -gr aphi c No rt h in de gr ee s
r "p" Sun
he ig ht ab ov e ho ri zo n in de gr ee s Su n az im ut h in d eg re es Su n az im ut h 6 hour s la te r in d eg re es Pr edi ct ed cl ock wi se s hi ft in d eg re es Co m m en t
HM1 (cs) 29.1.2011 8:19 5 355 0.50 0.001 37 95 276 179
HM3 (cs) 29.1.2011 8:48 318 308 0.56 0.001 44 93 270 183
HM4 (cs) 29.1.2011 9:17 168 158 0.43 0.001 51 90 268 182
HM5 (cs) 29.1.2011 9:50 106 96 0.57 0.001 58 87 265 182
HM4 (cs) 29.1.2011 10:26 26 16 0.91 0.001 66 81 262 179
HM5 (cs) 30.1.2011 8:24 23 13 0.75 0.001 38 95 273 182
HM4 (cs) 30.1.2011 8:51 93 83 0.11 0.61 45 92 270 182 NS
HM3 (cs) 30.1.2011 11:02 17 7 0.55 0.001 74 72 259 173
HM1 (cs) 31.1.2011 9:39 64 54 0.54 0.001 55 87 268 179
HM4 (cs) 31.1.2011 10:03 323 313 0.44 0.001 61 84 264 180
HM5 (cs) 31.1.2011 10:28 325 315 0.84 0.001 67 80 262 178
HM3 (cs) 31.1.2011 10:52 93 83 0.43 0.001 72 74 260 174
HM4 (cs) 1.2.2011 6:45 306 296 0.66 0.001 16 102 302 160
HM1 (cs) 1.2.2011 7:09 1 351 0.90 0.001 21 100 290 170
HM5 (cs) 1.2.2011 7:34 277 267 0.66 0.001 27 98 283 175
HM3 (cs) 1.2.2011 8:04 319 309 0.60 0.001 34 96 277 179
HM10 (cs) 1.2.2011 8:30 353 343 0.83 0.001 40 94 274 180
HM10 (cs) 1.2.2011 9:19 347 337 0.62 0.001 51 89 269 180
HM10 (cs) 1.2.2011 10:17 318 308 0.50 0.001 64 81 263 178
HM1 (cs) 1.2.2011 10:43 55 45 0.72 0.001 70 76 261 175
OTI20 (cs) 25.1.2012 10:25 324 314 0.56 0.001 67 84 261 183
OTI21 (cs) 25.1.2012 10:25 299 289 0.57 0.001 67 84 261 183
OTI22 (cs) 25.1.2012 10:50 195 185 0.46 0.001 72 79 259 180
OTI23 (cs) 25.1.2012 10:50 325 315 0.57 0.001 72 79 259 180
OTI24 (cs) 26.1.2012 7:16 303 293 0.90 0.001 24 101 282 179
OTI20 (cs) 26.1.2012 7:16 49 39 0.94 0.001 24 101 282 179
OTI21 (cs) 26.1.2012 7:43 298 288 0.95 0.001 30 99 277 182
OTI22 (cs) 26.1.2012 7:43 344 334 0.71 0.001 30 99 277 182
OTI23 (cs) 26.1.2012 8:11 309 299 0.95 0.001 36 97 273 184
OTI24 (cs) 26.1.2012 8:11 17 7 0.91 0.001 36 97 273 184
OTI20 (cs) 26.1.2012 8:37 239 229 0.19 0.24 42 95 270 185 NS
OTI21 (cs) 26.1.2012 8:37 353 343 0.65 0.001 42 95 270 185
OTI23 (cs) 26.1.2012 9:04 232 222 0.79 0.001 48 93 268 185
OTI22 (cs) 26.1.2012 9:04 335 325 0.96 0.001 48 93 268 185
OTI20 (cs) 26.1.2012 9:35 297 287 0.88 0.001 55 90 265 185
OTI24 (cs) 26.1.2012 9:35 44 34 0.91 0.001 55 90 265 185
OTI25 (cs) 26.1.2012 10:00 115 105 0.54 0.001 61 87 263 184
OTI26 (cs) 26.1.2012 10:00 297 287 0.78 0.001 61 87 263 184
OTI26 (cs) 26.1.2012 10:26 22 12 0.67 0.001 67 83 261 182
OTI25 (cs) 26.1.2012 10:26 342 332 0.56 0.001 67 83 261 182
OTI25 (cs) 27.1.2012 10:05 354 344 0.71 0.001 62 86 263 183
OTI26 (cs) 27.1.2012 10:05 339 329 0.77 0.001 62 86 263 183
Mean 180, r=1.00(!), P<0.001
Table S4: Summary table for calculations of individual mean orientation before
and after clock-shift. The individual mean directions were calculated by vector
addition of unit vectors in each of the mean directions shown in the individual tests of
the given individual (Batchelet 1981).
[image:16.595.62.523.69.144.2]
Table S4.
Fish ID
Means orientation of individual non-clock-shifted tests
Mean orientation of the individual in the non- clock-shifted tests
Clock-shifted from date (D.M.Y)
Mean orientation of individual clock-shifted tests
Mean orientation of the individual in the clock-shifted tests
Clockwise deviation in the clock-shifted condition compared to the orientation of the same individual in the non-clock-shifted condition
HM1 144, 137, 137 139 23.1.2011 355, 54, 351, 45 21 200
HM2 159, 353, 139 128 22.1.2011
Died during
clock-shifting - -
HM3 170, 97, 263 172 22.1.2011 308, 7, 83, 309 349 177
HM4 109, 122, 260 142 22.1.2011 158, 16, 313, 296 320 178
HM5 177, 246, 118 179 22.1.2011 96, 13, 315, 267 342 163
HM9 193, 345, 214, 176, 184 200 - Not clock-shifted - -
HM10 119, 164, 27, 151 124 27.1.2011 343, 337, 308 329 205
HM11 111, 347, 349, 164, 138 94 - Not clock-shifted - -
HM12 107, 51, 153, 150, 137 123 - Not clock-shifted - -
HM13 271, 161, 114 170 - Not clock-shifted - -
HM19 161, 214, 137 170 - Not clock-shifted - -
HM20 197, 231, 143 191 - Not clock-shifted - -
HM21 159, 99, 185 149 - Not clock-shifted - -
HM22 167, 142, 111 140 - Not clock-shifted - -
OTI20 183, 61, 119 120 21.1.2012 314, 39, 287 329 209
OTI21 128, 170, 227 174 21.1.2012 289, 288, 343 306 132
OTI22 193, 184, 50 160 21.1.2012 185, 334, 325 303 143
OTI23 323, 203, 163, 137 181 21.1.2012 315, 299, 222 281 100
OTI24 132, 116, 128 125 21.1.2012 293, 7, 34 354 229
OTI25 154, 174, 336 172 21.1.2012 105, 332, 304, 344 344 172
OTI26 156, 196, 215 189 21.1.2012 287, 12, 334, 329 331 142
[image:16.595.67.535.253.684.2]