International Journal of Innovative Technology and Exploring Engineering (IJITEE) ISSN: 2278-3075, Volume-8 Issue-12, October 2019
Contingency Ranking method using Fuzzy
Controller
Christy Priscilla.D, Ananthi Christy
ABSTRACT-- The electrical power system is a combination of electric devices developed for distribution and transmission of power supply. In spite of the common components being used in power system, they differ only in their operation and design. Contingency Analysis (CA) is a method to check for and calculate the faults in the power system and to give importance for the problem occurring in power system. Contingency analysis is an application in computer that uses a simulated block diagram model of the fault area in power system to specify the effects in that power system and to check for the overloads from any of the outsourcings. The outsourcing complete ranking of the contingency severity is being obtained. The fuzzy system approach is being used to solve the power flow problem for different contingency conditions when loading.
Keywords—Power system, Contingency analysis, Ranking, Fuzzy Logic, Bus Voltage magnitude, Voltage angle.
I. INTRODUCTION
An electric power system is combination of network of generation, transmission and distribution system. In this system different forms of energy are being converted to obtain the electrical form of energy. The power system also consists of different devices like motor, generator, transformer, circuit breakers, relays, conductors, etc. The power being obtained from the power plants is being step-up or step-down using transformers for transmission. The transmission line then transfers the required power to the substations. From substations it is transferred to the distribution transformers for step-down process in accordance with the requirement of customers. Since this network involves enormous number of system, the fault occurred in a particular system will be difficult to identify and eradicate it manually. So Power system security assessment is very much essential for proper maintenance. The main reason for system overloads are due to the line outages which gives requirement for power system security. Contingency analysis using different artificial intelligence techniques is being compared and given with the efficient usage [7]. Fuzzy logic is found to be more realistic when compared to other systems in contingency ranking, it is found to be more efficient in anyways [10]. Overall ranking, performance indices and masking effect is being performed for severity of the contingency analysis [5]. Fuzzy load flow method has a very accurate computational time which is used in real time applications for large-scale and small-scale power systems [2]. Fuzzy logic control which is enhanced by closed-loop system is used to maintain stability of power system [4]. Stability of voltage has been the critical issue in power system. Instability in voltage and collapses in system have caused major system failures [1].
Revised Manuscript Received on October 05, 2019.
Christy Priscilla.D, PG student, Department of EEE, Saveetha School of Engineering, SIMATS, Chennai
Dr.Ananthi Christy, Associate Professor, Department of EEE, Saveetha School of Engineering, SIMATS, Chennai
Load-frequency control using Fuzzy logic is ensured to give stable and reliable operation of the power system. The approach for fuzzification is given in a simple steps in this [3]. Online power system security and screening methods are being carried out using neural networks, two types of approach being used MFFN and RBFN. This helps in online assessment [6]. It is predicted that RBF neural network yields faster result than expected in the case of performance indices [8]. When compared to other controllers like PID controller the fuzzy controller is proved to be more efficient and can be used in large scale systems [9].
II. METHODOLGIES
A. Methods of contingency analysis
There are different types of methods used in contingency analysis. When compared to that of DC power flow methods, AC power flow calculations are much more accurate. By Deterministic method, simulation of line outages are not done by regular modelling but instead by removal of lines. AC power flow methods are more accurate but when practically considered it is very much expensive and computational time is also high. Contingency analysis is the tool for finding overload conditions which require the study power system condition according to the computational speed. A brief description of these methods is given below.
B. Load flow method of contingency analysis
The DC Load Flow method of Contingency analysis depends on DC power flow equation to map single or multiple contingencies. These equations are M-1 in number, where M is the number of buses. In this method, Line resistance is being neglected but only the real power flows are being used for modelling and reactive power flows are being ignored
All transmission line is represented by its susceptance Aij.
Impedance Z = r + jx …….. (1) Inverse of impedance Y = G + jA…….. (2)
In this method, Q which is considered as reactive power is being neglected and the real part is being considered in power flow equations and all the bus voltages are considered to be 1 p.u. the matrix A' is being computed considering that all the resistances are zero.
C. Z-Matrix method of contingency analysis
This method makes use of bus impedance matrix related with both base system and the system which is modified by either removal of line or the addition of line. Z-matrix is the inverse of bus admittance matrix, so it can be obtained this way also or by constructing algorithms related to it. The basic approach for z-matrix method of contingency analysis is introductory of the imaginary current into any one of the bus which is linked with the affected part which is to be removed. During this
values are being set to zero. This method is more accurate compared to DC load flow method and the results are comparable to those obtained using AC power flow.
D. Voltage stability index (L-Index) computation This method is also based on load flow analysis and used for determining the voltage collapse proximity. There is a range being indicated for the L-index value which varies from 0 to 1 in which 0 is given as no load condition and 1 is indicated as Voltage collapse. This indication helps in finding the vulnerability, if L-index value is found to be high it is identified as the most vulnerable bus in the system.
E. Decoupled load flow
The important characteristic for an electric power transmission system to operate in a steady state is to have the strong mutual-dependence between actual powers and bus voltage angles and also between reactive powers and voltage magnitudes. The injected actual power and the bus voltage angle have a stronger mutual dependence which is denoted as a relationship between P and δ variables and as well the injected reactive power and bus voltage magnitude have a stronger mutual dependence which is being denoted as Q and |V|. When the coupling is being inversed between the variables that is (Q and δ) and (P and |V|) will become weak.
F. Fast decoupled load flow
The basic property of FDLF is that the change in real power because of the impact in the Voltage angle. In Jacobian matrix, H and L which are the elements of matrix will be calculated at each iteration. So in decoupled method computational time is much higher.
G. Drawback of load flow method
1. These qualities together denotes there have been a high degree of severity.
2. Contingency selection makes use of the neural network for the voltage ranking but incase to rank the contingencies post contingent quantities are being used.
H. Conventional neural network approach
The concept of Artificial Neural Networks (ANN) is one of the greatest developments of this century. These networks resemble the functioning of human brain like intelligent guessing and pattern recognition. ANNs use large number of interconnected processors which operates to process the information in a combined condition. Neurons are the basic building blocks and the input output relationship solely depends on the interconnection of the nodes and layers. Artificial neural networks are best suitable for nonlinear function approximation, estimation and prediction.
A conventional neural network uses real numbers as inputs, weights and thresholds. To solve a power system problem with complex numbers, each complex input has to be split in to two parts (real part and imaginary part) to present as input to the network. Therefore the number of input and output nodes or neurons increases. To evaluate the performance of this network a 7 X 15 X 6 neural network (including bias) has been developed. The three layered neural network has the following architecture.
Input layer--It has 6 neurons representing real and reactive powers at the three load buses.
Hidden layer-- It consists of 15 neurons. Hidden layer neurons areselected by trial and error method.
Output layer-- It has 6 neurons. Voltage magnitdes and angles ateach load bus are taken as outputs.
I. ANN Methodology for performance indices
The ANN model selected for on-line security assessment is a multilayer layer feed forward neural network (MFFN) and Radial Basis Function Neural Network (RBFN) trained with Resilient back propagation algorithm.To avoid misclassification, separate ranking is obtained for PIVQ and PIMVA using two MFFNs and RBFN. For each contingency, the performance indexes are calculated by off-line Newton Raphson method.
Multi-Layer Feed Forward Network (MFFN): In this, input to the MFFN are being chosen from real and reactive power generation at diverse generator buses and also from the reactive power demand which is considered from the load buses. The network is trained with “Resilient” back propagation algorithm due to its good convergence properties.
Radial Basis Function Neural Networks (RBFN):The RBFN network consists of single hidden layer feed forward structure. The input nodes gives the input variables to the hidden layer without any connection weights, this input variable is given directly.
J. Drawbacks of using neural network method
i. Main drawback of using neural network is that time required to fetch feed forward network with back propagation algorithm, particularly when dimension of the power network goes high.
ii. Main drawback of genetic algorithm is difficulty to define the fitness function, find the several sub-optimum solutions without guaranty that this solution isn't locally and longer search time.
iii. There are few major challenge to be handled using NNs for power system: training time, selection of training vector, upgrading of trained neural nets and integration of technologies.
III. PROPOSED METHODOLOGY
[image:2.595.322.536.537.682.2]A. Block diagram:
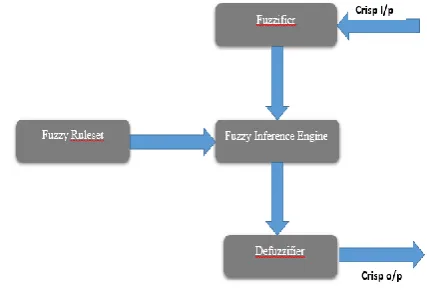
Fig. 1. Fuzzy Logic System Block Diagram. Fuzzy ruleset: It contains fuzzy IF-THEN rule set, it gives the membership functions of fuzzy sets used in fuzzy rules. Fuzzifier: This module converts the crisp input into fuzzy input, supports the application
International Journal of Innovative Technology and Exploring Engineering (IJITEE) ISSN: 2278-3075, Volume-8 Issue-12, October 2019
Defuzzifier: This module finally converts fuzzy input into crisp output.
Fuzzy inference engine: The inputs of the system are made fuzzy and the fuzzy operators must be applied to get the output.
B. Regular power flow method
The fast-decoupled power flow method (FDPF) is being given by the following equations
𝛥𝑃
𝑉 = 𝐵
′. 𝛥𝛳 …… (3)
𝛥𝑄
𝑉 = 𝐵′
′. 𝛥𝑉 …… (4)
In equation (3), the state vectors are being updated and fixed where θ is updated in this condition and V is fixed. But in the case of equation (4), the state vector V is updated and the state vector θ is fixed.
C. Fuzzy power flow
The Fuzzy power flow equations is derived from the Fast Decoupled Power Flow set of equation and this can be expressed as
∆G = B.∆Y ……. (5)
In equation (5), ∆Y is directly proportional to ∆G and it is defined as the correction of state vector is directly proportional to the vector G. In this method fuzzy power flow which is the proposed method is based on the previous equations of fast decoupled power flow and the state vectors of the system will be updated repeatedly to perform the functions using fuzzy logic control but instead of the conventional approaches being used.
∆Y = fuz(∆G) …… (6)
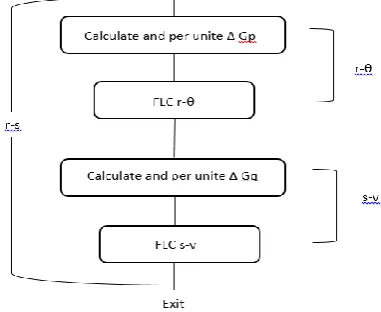
[image:3.595.78.269.534.690.2]Here fuz is the representation of fuzzy logic function. The Fuzzy Logic Power Flow (FLPF) algorithm is shown in Fig. 2. In this algorithm, ∆Gp and ∆Gq are the parameters they are calculated per unite and ∆Gp is being introduced into the fuzzy logic controller r-θ which is denoted as FLC r-θ, ∆Gq is being introduced into the fuzzy logic controller s-v which is denoted as FLC s-v. The FLCs are being used for the generation of the correction of state vector ∆Y, for r-θ cycle the correction of voltage angle is ∆θ and for s-v cycle the correction of voltage magnitude ∆V.
Fig. 2. Fuzzy Logic Power Flow algorithm. D. Fuzzy power flow controller structure
The structure of the proposed Fuzzy Power Flow Controller structure is shown. It is made up of four main components: a fuzzifier interface, a fuzzy rule set, process logic system and a de-fuzzifier interface. In each iteration, the fuzzifier interface are calculated per-unit at each node of
the system of the power parameters ∆Gp and ∆Gq. As these parameters ∆Gp and ∆Gq are being considered as the crisp input signals, the maximum (or worst) power parameters (∆Gpmax or ∆Gqmax ) are used for determining that at every iteration mapping value for the transformation from input signal into its corresponding signal.
The input signals are fuzzified into respective fuzzy signal ∆Gr fuz or ∆Gs fuz with seven linguistic variables; large negative (LN), medium negative (MN), small negative (SN), zero (ZR), small positive (SP), medium positive (MP), large positive (LP). They are represented in Gaussian function. The Linguistic variables are designed accordingly with the width and centre of the points which is considered as main function in this.
LN : [∆Gmax/14, -3∆Gmax/4], MN : [∆Gmax/14, -∆Gmax/2], SN : [∆Gmax/14, -∆Gmax/4], ZR : [∆Gmax/7, 0],
SP : [∆Gmax/14, ∆Gmax/4] MP : [∆Gmax/14, ∆Gmax/2] LP : [∆Gmax/14, 3∆Gmax/4].
The rule baseset includes seven rules in addition with seven linguistic variables:
Rule 1 : if ∆Gfuz is LN then ∆Yfuz is LN Rule 2 : if ∆Gfuz is MN then ∆Yfuz is MN Rule 3 : if ∆Gfuz is SN then ∆Yfuz is SN Rule 4 : if ∆Gfuz is ZR then ∆Yfuz is ZR Rule 5 : if ∆Gfuz is SP then ∆Yfuz is SP Rule 6 : if ∆Gfuz is MP then ∆Yfuz is MP Rule 7 : if ∆Gfuz is LP then ∆Yfuz is LP
At every iteration, state vector is directly proportional to power vector which is being denoted as ∆Y and ∆G. So when the observation is considered fuzzy rules are being maintained consistent. ∆Gfuz which is the fuzzy input signal is being given as an input to the interface engine which is considered as process logic, this engine generates the fuzzy output signal which is denoted as the ∆Yfuz. This function is completed by using the rule base set which is being represented by linguistic variables brought out in similar to the input signal. Then ∆Yfuz which is the output signal is being passed on to de-fuzzifier interface which will perform the following function.
The maximum corrective action ∆Ymax, of state variables is used to determine the range for scale mapping which tends to move the output signal into the respective signal at each iteration. The ∆Ymax of these variables are being calculated by using,
∆𝐺𝑚𝑎𝑥 ,𝐼
∆𝑌𝑚𝑎𝑥 =
𝑑𝐺𝐼
𝑑𝑌𝐼 ….…… (7)
∆𝑌𝑚𝑎𝑥 = 𝑑𝐺𝐼
𝑑𝑌𝐼 −1
∆𝐺𝑚𝑎𝑥, 𝐼 ….…… (8)
where G and I express the real and reactive power equation at node-I which indicates the mismatch in the maximum real or reactive power of the system, Y and I represents the voltage angle and the voltage magnitude at node-I. Hence, two points (width and centre) of the Gaussian membership functions of ∆Yfuz are formed and is being expessed as below:
LN : [∆Ymax/14, -3∆Ymax/4]
MN : [∆Ymax/14, -∆Ymax/2]
SN : [∆Ymax/14, -∆Ymax/4]
ZR : [∆Ymax/7, 0]
SP : [∆Ymax/14,
∆Ymax/4]
∆Ymax/2]
LP : [∆Ymax/14, 3∆Ymax/4].
Finally the defuzzfier will convert every fuzzy output signal ∆Yfuz into crisp value ∆Y for each node of the network.
IV. SOFTWARE IMPLEMENTATION
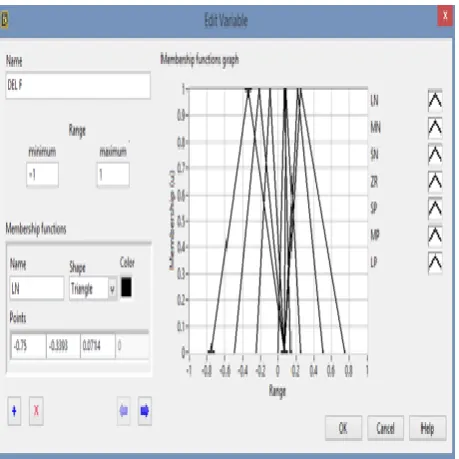
[image:4.595.56.286.174.404.2]A. Fuzzy logic controller membership function graph input signal
Fig. 3.Membership function graph Input Signal. A membership function graph is defined as that which is a curve which denotes membership value represented by the input space at each point. This figure shows the fuzzy logic controller membership function graph input signal which is being adjusted according to the range given as an input, this functional graph shows the negative and positive value according to the input given. The fuzziness is well denoted by its own membership function.
B. Fuzzy logic controller membership function graph output signal
Fig. 4. Membership function graph Output Signal. This figure shows the fuzzy logic controller membership function graph output signal which is being got according to
the given input signal and the value ranges also varies accordingly with the positive and negative value variances. These variances can also be got according membership variances. The function of fuzzy logic is to show an input space to an output space.
C. Rule set for the corresponding output value
[image:4.595.310.548.246.471.2]Rules are being set for the corresponding output value with „IF-THEN‟ conditions setting the ΔG values for both negative and positive magnitudes according to which the input of the de-fuzzification is also being given. So, according to the input variable given the output variable is being obtained eventually. Illuminating an if-then rule is nothing but the evaluation of the already existing that is fuzzifying the given inputs and applying any necessary operators wherever required. Next is the implication, this is to shape the output fuzzy set. This entire fuzzy set is being assigned by fuzzy rule.
Fig. 5. Rule set for graph.
Test system for output values based on input values given
[image:4.595.307.549.516.725.2]Set 1:
International Journal of Innovative Technology and Exploring Engineering (IJITEE) ISSN: 2278-3075, Volume-8 Issue-12, October 2019
In this above figure, the input/output relationship is being obtained according to the input value given for the input variable ΔG accordingly the output value is obtained for the output variable ΔY. The output obtained is not a continuous curve but a spike
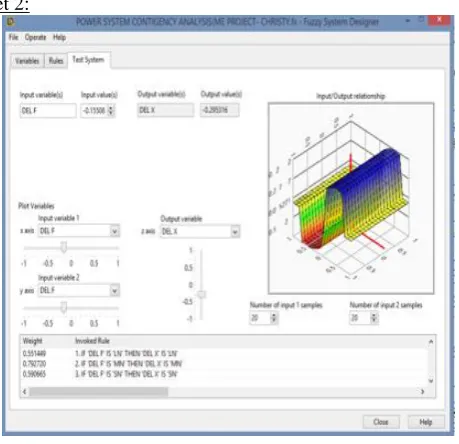
[image:5.595.55.285.112.334.2]Set 2:
Fig. 7. Test system Input/ Output relationship. In this figure, input/output relationship is being configured according to the input value and variables and these variables are being plotted and the output graph is obtained.
V. CONCLUSION & FUTURE ENHANCEMENT Fuzzy logic system approach gives the best output for power flow problems under different loading conditions in contingency analysis. In this proposed method fuzzy logic based power flow method is implemented to get the values of voltage magnitude and the voltage angles at a criteria of using different buses under different loading conditions. Time consumed is less when compared to other methods and so the number of iterations also was reduced by using the triangular membership functions. Since the proposed method is more faster with expected accuracy, so it can be implemented for the stability of online energy power system.
REFERENCES
1. A.Y. Abdelaziz et al.,"Fuzzy Logic Based Power System Contingency Ranking", I.J. Intelligent Systems and Applications, 2013, 03, 1-12
Published Online February 2013 in MECS DOI:
10.5815/ijisa.2013.03.01.
2. Dr. Hassan Abdullah Kubba and Yasser Falah Hassan, "A Real-Time Fuzzy Load Flow and Contingency Analysis Based on Gaussian Distribution System", Number 8 Volume 21 August 2015 Journal of Engineering.
3. Ismail H. Altas and Jelle Neyens, "A Fuzzy Logic Load-Frequency Controller for Power Systems", International Symposium on Mathematical Methods in engineering, MME-06, Cankaya University\ Ankara, Turkey, April 27 - 29 , 2006.
4. Jenica Ileana Corcau and Eleonor Stoenescu, "Fuzzy logic controller as a power system stabilizer", International journal of circuits, systems and signal processing.
5. B.Krishnakumar et al., "Power flow based Contingency analysis using fuzzy logic", International conference on Modelling Optimization and Computing-(ICMOC-12), Procedia Engineering 38(2012)3603-3613. 6. Kuldeep Saini and Akash Saxena, "Online Power System
Contingency screening and ranking methods using radial basis Neural Networks", International Journal of Electrical and Electronics
Engineering Research (IJEEER) ISSN(P): 2250-155X; ISSN(E): 2278-943X Vol. 6, Issue 3, Jun 2016, 9-16.
7. Lekshmi M and Dr.M.S.Nagaraj, "A Review on Electrical Power System Contingency Ranking Using Artificial Intelligence Techniques", IOSR Journal of Electrical and Electronics Engineering (IOSR-JEEE) e-ISSN: 2278-1676,p-ISSN: 2320-3331, Volume 12, Issue 4 Ver. II (Jul. – Aug. 2017), PP 06-10.
8. R.K.Misra and S.P. Singh, "RBF Neural Network for Adaptive Contingency Screening", Indian Institute of Technology, Kharagpur, December 27-29, 2002.
9. Dr. A. Taifour Ali et al., "A Multi-Machine Power System Stabilizer Using Fuzzy Logic Controller", International Journal of Computational Engineering Research (ijceronline.com) Vol. 2 Issue. 6.
10. Usman Aliyu Magaji, "Contingency Analysis using Fuzzy logic", University of Delhi(DU), conference centre, New Delhi(India), 27 september 2015.
AUTHORS PROFILE
Christy Priscilla D received the B. E degree in Electrical and Electronics Engineering in 2017 from St. Joseph institute of Technology, OMR, Chennai and currently pursuing M. E degree with Power Systems specialization from Saveetha School of Engineering, SIMATS, Chennai.