International Journal of Innovative Technology and Exploring Engineering (IJITEE) ISSN: 2278-3075, Volume-8, Issue-6S4, April 2019
Abstract:Machine learning has become one of the top most emerging technologies in this era of digital revolution. The machine learning algorithms are being used in various fields and applications such as image recognition, speech recognition, classification, prediction, medical diagnosis etc. In medical domain, machine learning techniques have been successfully implemented to improve the accuracy of medical diagnosis and also to improve the efficiency and quality of health care. In this paper, we have analyzed the existing health care practice system and have proposed how machine learning techniques can be used for differential diagnosis of Tuberculosis and Pneumonia which are often misdiagnosed due to similar symptoms at early stages.
Keywords:Machine Learning, Tuberculosis, Pneumonia, Differential diagnosis, ID3, Naïve Bayes, Random Forest
I. INTRODUCTION
Today, Machine learning in healthcare has become one of the most popular ML applications. Some of the recent applications of ML in healthcare industry include disease identification, medical imaging diagnosis, drug discovery, robotic surgical tools etc. Mostly, the algorithms are used in medical diagnosis for early detection of rare and fatal diseases to assist the physicians in making intelligent clinical decisions.
This paper mainly focusses on differential diagnosis of respiratory infectious diseases such as Tuberculosis and Pneumonia which are most fatal contagious diseases spread worldwide. These diseases have similar classical symptoms such as cough, fatigue, weight loss, fever etc. and therefore at initial stages, can be misdiagnosed. Often due to misdiagnosis of these diseases a large number of patients are unnecessarily treated for TB with anti TB drugs which have numerous unpleasant side effects and these consequences of misdiagnosis results in high risk and harm to patients. So, to mitigate this problem and also to reduce the number of clinical tests we have proposed the use of ML algorithms to accurately predict these diseases at early stages and hence reduce the medical errors and ensure patients’ safety.
Revised Manuscript Received on April 12, 2019.
AiyeshaSadiya,Department of Information Science Engineering, Vidyavardhaka College of Engineering, Mysuru, Karnataka, India (Email: [email protected])
Anusha V Illur,Department of Information Science Engineering, Vidyavardhaka College of Engineering, Mysuru, Karnataka, India (Email: [email protected])
Aekhata Nanda,Department of Information Science Engineering, Vidyavardhaka College of Engineering, Mysuru, Karnataka, India (Email; [email protected])
EshwarRao,Department of Information Science Engineering, Vidyavardhaka College of Engineering, Mysuru, Karnataka, India (Email: [email protected])
Vidyashree K P,Department of Information Science Engineering, Vidyavardhaka College of Engineering, Mysuru,Karnataka India (Email: [email protected])
Mansoor Ahmed,Mysuru Medical College, Mysuru, Karnataka, India (Email: [email protected])
Tuberculosis
TB is a contagious airborne infectious disease that usually affects the lungs and is the second most fatal disease that affects everybody irrespective of their age. It is caused by Mycobacterium Tuberculosis bacterium. The signs and symptoms of active TB include:
• Cough that lasts two or more weeks • Coughing up blood
• Chest pain • Fatigue • Fever • Night sweats • Chills
• Loss of appetite • Loss of weight
Some of the most commonly used Diagnostic tests for TB include chest x-ray, sputum smears and sputum cultures. However, these tests have poor specificity and sensitivity and also are slow and expensive.
Pneumonia
Pneumonia is an infection of the lungs and is one of the leading cause of death in children below five years of age. Pneumonia is a contagious disease and can cause mild to severe illness in all age groups. It is caused by bacteria and viruses and the common symptoms include:
• Cough • Fever • Chills • Fatigue
• Shortness of breath • Headache
• Chest pain
The diagnostic tests for Pneumonia include non-laboratory tests such as chest x-ray, CT, Bronchoscopy and laboratory tests such as CBC (complete blood count), blood gases and serum electrolytes.
Hence the diagnosis of Tuberculosis and Pneumonia accurately can be difficult as symptoms, clinical and radiological patterns of TB and Pneumonia are quite similar.
II. RELATED WORK
There are not much related works done on differential diagnosis of diseases. However, studies have been conducted using machine learning and data mining techniques to predict and classify diseases accurately.
The authors in [1] have proposed a data mining approach by combining clustering and classification to effectively
Differential Diagnosis of Tuberculosis and
Pneumonia using Machine Learning
diagnose Tuberculosis. The proposed model was a combination of various algorithms such as K-means, C4.5 decision tree, K-NN, Naïve Bayes and SVM and it produced an accuracy of 98.7%. It was observed that SVM algorithm had the highest accuracy in predicting Tuberculosis when compared to other classifiers.
In [2], the authors Amani, Orhan and Nejathave done a study and developed a system that diagnoses whether a patient has Tuberculosis or not using SVM algorithm. It has been seen that SVM methods bring a significant performance to reach 96.68% of accuracy. The dataset in this paper includes 38 properties present in patient discharge reports.
Paula, Robert, James and Richard in [3]have done a study to predict Pneumonia prior to chest X-ray observation with only patient’s histories and clinical findings such as cough, pain in chest, alcohol consumption, blood sample values and sputum culture. And, they have also done a study to determine quantitative relationships between the various symptoms and signs in patients presenting with acute cough.They used statistical methods like t or chi- square test, Fisher’s exact test for finding the associations.
In [4], the authors OrhanEr, NejatYumusak and FezyullahTemutras perform a chest diseasesdiagnosis such as pulmonary pneumonia, tuberculosis and asthma. They used multilayer, probabilistic, learningvector quantization and generalized regression neural networks. The patient’s reports from a hospital databasewere used to prepare the dataset.
III. EXISTING HEALTH PRACTICE SYSTEM As mentioned earlier, differential diagnosis of Tuberculosis and Pneumonia has always been a challenge to even the most experienced doctors. This is because both of these conditions share similar symptoms like cough, intermittent fever, dyspnea, etc. This makes it difficult and challenging in terms of clinical diagnosis of tuberculosis and Pneumonia of any form.
The most common approach practiced by health practitioners is outlined here. When a patient comes with the symptoms, firstly he is subjected to a blood test because the presence of tuberculosis or Pneumonia causing bacteria/virus cause changes in the blood cells count and electrolyte level. But these alone are not a clear indication of the presence of disease. So, patients are then subjected to various definitive diagnosis tests which confirm the presence of the disease. As mentioned earlier, these tests are very expensive and time consuming. By the time the results are out, the disease if present, would have advanced in patient’s body. To avoid this, doctors often prescribe antibiotics right away. But these come with side effects. And, these are worse if the patient actually does not have the disease.
As it can be seen in our literature survey, ample amount of research has been done in prediction of individual diseases using machine learning techniques, but not on the differential diagnosis of diseases with similar classical symptoms.
IV. PROPOSED PREDICTION SYSTEM We propose a machine learning approach for the differential diagnosis of Tuberculosis and Pneumonia. The various attributes to be considered include categorical attributes like the symptoms and the numerical(continuous) attributes like the counts or levels of blood cells and electrolytes.
A comparative experiment is to be carried out on the same dataset using three different algorithms- ID3, Naive Bayes and Random Forest.
The aim is to find the best algorithm that fits the dataset which provides the highest accuracy.
Proposed prediction model
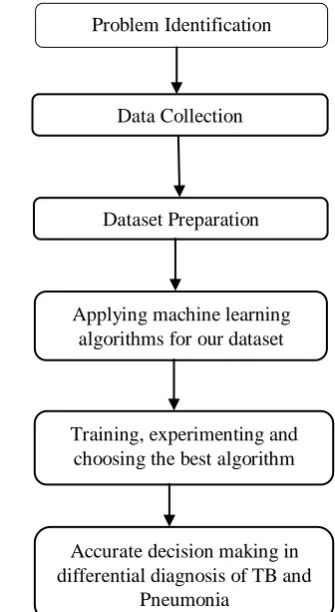
The proposed model includes the following steps and is shown in the Fig 1.
Step1: Problem Identification in differential diagnosis of TB and Pneumonia
Step 2: Collection of data (symptoms and clinical test reports) which helps in the diagnosis of TB and Pneumonia
Step3: Dataset preparation using different data processing and data mining techniques
Step 4:Applyingmachine learning algorithms for the processed data
Step 5: Training and experimenting on the dataset to choose the best algorithm based on accuracy
[image:2.595.335.503.411.717.2]Step 6: Deployment and analysis on real life scenario for making effective and accurate decisions in predicting TB and Pneumonia
Fig 1: Flow chart for the proposed prediction model Training, experimenting and
choosing the best algorithm
Accurate decision making in differential diagnosis of TB and
Pneumonia Applying machine learning
algorithms for our dataset Dataset Preparation
International Journal of Innovative Technology and Exploring Engineering (IJITEE) ISSN: 2278-3075, Volume-8, Issue-6S4, April 2019 V. DATA PREPROCESSING
In machine learning projects, the dataset should be transformed before applying any algorithm to achieve better results. The models need the dataset to be formatted in a specified format so that multiple Machine Learning algorithms can be applied to the dataset and eventually choose the best algorithm for a specified problem. Hence, data preprocessing is a technique of transforming the raw data collected from different sources to a required format. In our project, the raw data collected from a private hospital was transformed to a required format by using the following techniques.
Handling Missing Values
There might be many tuples with missing attribute values in the raw data collected from different sources which should be taken care of before applying the algorithms by using methods like ignoring the tuple, by using a constant, mean or the most probable value.
As mentioned earlier, we have collected the data for our project from a local hospital manually. While converting it to comma separated values, we observed that a lot of tuples had missing attribute values which had to be preprocessed. Therefore, we filled in the missing values with the mean attribute value as this was the feasible method for the numerical attribute values of our dataset.
Handling useless attributes
The raw data might contain certain attributes which do not vary much and thus do not contribute to the classification task. As they do not contribute for decision making, the best way is to remove them and optimize the dataset. In our dataset it was observed that the attribute ‘basophils’ did not vary much and hence it was removed before applying the further preprocessing techniques.
Discretization
Discretization or binning is a method of converting numerical or continuous values into categorical counterparts. The purpose of discretization is to decrease the number of values assumed by a continuous attribute, by grouping them into ‘n’ bins or intervals.
The biomedical data that we collected contained many continuous attributes whose values ranged from a few tens to hundreds and thus there was a need to rescale these values and to make them fall into specified categorical bins by using custom ranges. After applying discretization to our dataset it was observed that the performance of our algorithms improved which proved that it was an essential step in data preprocessing.
Encoding
Encoding is the transformation of categorical variables to binary or numerical counterparts. This is an essential step in data preprocessing as the algorithms or the models like Gaussian Naïve Bayes require the dataset to be provided in numerical format.
Label Encoding
Label encoding is the process of labelling the different categories of a categorical attribute using numbers so that they can be used by the algorithms. Here we have label
encoded the target variable and few attributes which contained yes/no values as ‘1’ and ‘2’ and the remaining attributes which contained multiple discrete values have been label encoded accordingly.
VI. DATA DESCRIPTION TABLES Table 1: Dataset overview Number of
instances
Number of attributes
Number of classes
[image:3.595.306.549.196.768.2]705 32 2
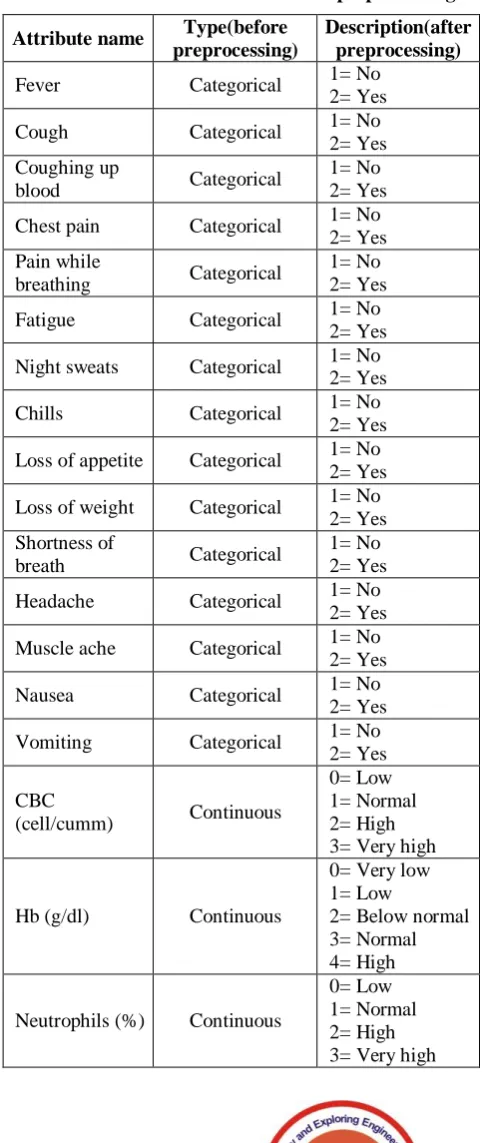
Table 2: Attributes before and after preprocessing Attribute name Type(before
preprocessing)
Description(after preprocessing) Fever Categorical 1= No
2= Yes Cough Categorical 1= No
2= Yes Coughing up
blood Categorical
1= No 2= Yes Chest pain Categorical 1= No
2= Yes Pain while
breathing Categorical
1= No 2= Yes Fatigue Categorical 1= No
2= Yes Night sweats Categorical 1= No
2= Yes Chills Categorical 1= No
2= Yes Loss of appetite Categorical 1= No
2= Yes Loss of weight Categorical 1= No
2= Yes Shortness of
breath Categorical
1= No 2= Yes Headache Categorical 1= No
2= Yes Muscle ache Categorical 1= No
2= Yes Nausea Categorical 1= No
2= Yes Vomiting Categorical 1= No
2= Yes CBC
(cell/cumm) Continuous
0= Low 1= Normal 2= High 3= Very high
Hb (g/dl) Continuous
0= Very low 1= Low
2= Below normal 3= Normal 4= High
Neutrophils (%) Continuous
Lymphocytes
(%) Continuous
0= Low 1= Normal 2= High 3= Very high Eosinophil (%) Continuous 1= Normal
2= High Monocytes (%) Continuous 1= Normal
2= High
Basophils (%) Continuous Attribute removed (useless)
ESR (mm/1sthr) Continuous
0= Normal 1= above normal 2= High
3= Very high Hematocrit (%) Continuous
0= Low 1= Normal 2= High O2 (mmHg) Continuous
0= Low 1= Normal 2= High Co2 (mmHg) Continuous
0= Low 1= Normal 2= High
So2 (%) Continuous
0= Very low 1= Low 2= Normal
HCo3 (mmol/L) Continuous
0= Low 1= Normal 2= High 3= Very high Na (mEq/L) Continuous 1= Low
2= High K (mEq/L) Continuous
0= Low 1= Normal 2= High
Cl (mmol/L) Continuous
0= Low 1= Normal 2= High
The above table shows the various attributes of our dataset, their types before data preprocessing and their description after preprocessing.
VII. DATA VISUALIZATION
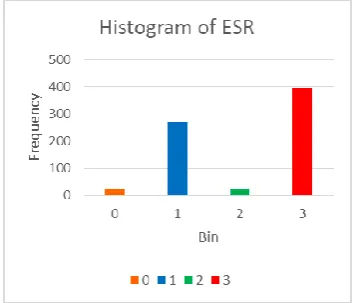
[image:4.595.49.289.46.498.2]To understand and analyze the distribution of values of each attribute of our dataset we have plotted histograms. Below are the examples of a few attributes as shown in fig 2.
[image:4.595.340.510.46.523.2]Fig 2a. Histogram of ESR
Fig 2b. Histogram of Night sweats
Fig 2c. Histogram of Hb
Fig 2d. Histogram of K
In the above histogram of chills attribute, it can be seen that around 400 instances have the label 1 and around 300 instances have the label 2 for its value. In the same way, the distribution can be seen for the remaining attributes as well.
VIII. IMPLEMENTING THE MODEL The model was built by using three different machine learning algorithms viz., Gaussian Naïve Bayes, Decision Tree and Random Forest. These algorithms were chosen because it was seen that they had better accuracy in medical diagnosis. Here is a brief description about these algorithms.
Gaussian Naïve Bayes
[image:4.595.80.259.624.775.2]International Journal of Innovative Technology and Exploring Engineering (IJITEE) ISSN: 2278-3075, Volume-8, Issue-6S4, April 2019 distribution of a continuous attribute v, given a class C is
given by the following equation. P (v | C) = 1
2𝜋𝜎2𝑒
− 𝑣−𝜇 2
2𝜎 2
Where, 𝜇 is the mean of values in v and 𝜎 is the variance of the values v associated with class C.
Decision Trees
Decision Trees are supervised learning method used for regression and classification. It learns the simple decision rules after inferring the data features and hence predicts target variable value.
There are various decision tree algorithms like ID3, C4.5, C5.0 and CART. CART is the most recent and enhanced version and hence the same has been used in our model.
a) Gini impurity
It is used by the CART algorithm for classification trees. It is a measure of how often a randomly chosen element from the set would be incorrectly labelled if it was randomly labelled according to the distribution of labels in the subset.
b) Information gain
It is used by the ID3, C4.5 and C5.0 tree generation algorithms. It is based on the concept of entropy and information content from information theory. It is used to decide which feature to split on at each step in building the tree.
Random Forest
Random forest is a meta-estimator that fits a number of decision tree classifiers on various subsamples of the dataset. To control overfitting and to improve the predictive accuracy it makes use of averaging.
In random forests, each tree in the ensemble is built from a sample drawn with replacement from the training set. While splitting a node during the construction of the tree, the split that is chosen is the best split among a random subset of the features. Due to this randomness, the bias of the forest slightly increases and due to averaging its variance decreases. Hence yielding an overall better model.
IX. EVALUATING THE MODEL& RESULTS The results obtained from our model are summarized in the following table.
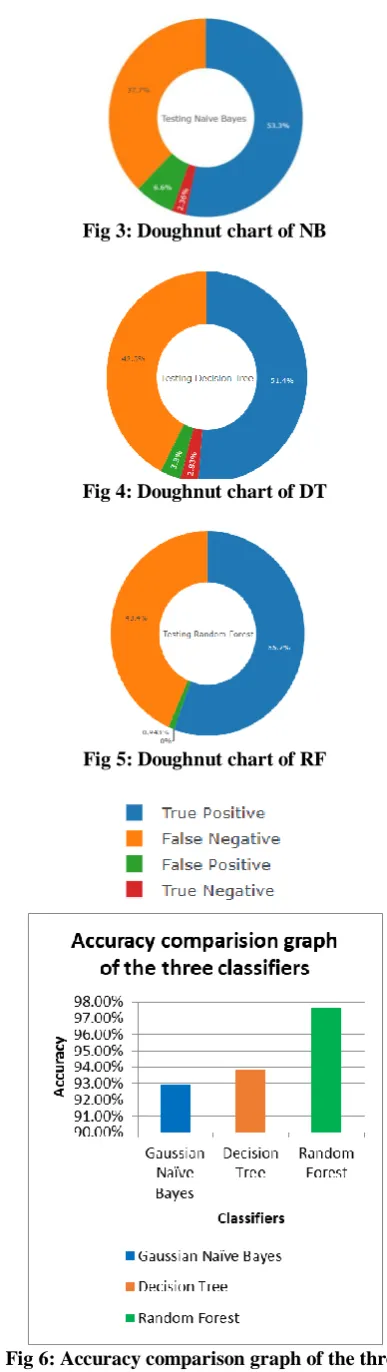
Table 3: Accuracy comparison table of the three algorithms
Algorithm Accuracy before preprocessing
Accuracy after preprocessing Gaussian
Naïve Bayes 88.08% 92.9%
Decision Tree 90.12% 93.85% Random
Forest 95.28% 97.64%
It can be observed that the preprocessing technique, discretization has improved the performance of all the three algorithms. Though Naïve Bayes saw significant increase in accuracy due to discretization, Random Forest gave the highest accuracy for our dataset.
[image:5.595.324.518.42.729.2]Below are the doughnut charts representing the results of all the three algorithms:
Fig 3: Doughnut chart of NB
Fig 4: Doughnut chart of DT
Fig 5: Doughnut chart of RF
The above bar chart shows that the Random Forest classifier outperforms the other two classifiers and hence is best suited for our dataset.
X. CONCLUSION
In this paper, we have presented a study on the application of machine learning techniques in differential diagnosis of Tuberculosis and Pneumonia. It can be seen that there are prediction systems which predict the presence or absence of one particular disease by using its symptoms as its attributes, with fairly high accuracy. But, not much research has been done in applying machine learning techniques for the differential diagnosis of diseases like Tuberculosis and Pneumonia which have similar classical symptoms. Hence, we have proposed the same in this paper by developing a classification model using three different algorithms- Naïve Bayes, Decision Tree and Random Forest. Our results indicate that the classification performance slightly increases with discretization technique. And, the largest gain in accuracy was seen with Naïve Bayes and overall Random Forest gave high classification performance.
In the future work, the model can be trained for other similar diseases using relevant data so that the model can be efficient in predicting multiple diseases with similar classical symptoms and also increase the accuracy of the model by applying different preprocessing and discretization techniques.
XI. ACKNOWLEDGEMENTS
The manuscript is prepared by taking assistance from Accendere Knowledge Management Services Pvt. Ltd, we are thankful to them. We also express our gratitude to our teachers and mentors for guiding us throughout the work.
REFERENCES
1. T, A., Natarajan, S., & Murthy, K. N. B. (2011). A Data
Mining Approach to the Diagnosis of Tuberculosis by
Cascading Clustering and Classification. Journal of
Computing, 3(4).
2. Yahiaoui, A., Er, O., &Yumusak, N. (2017). A new method of
automatic recognition for tuberculosis disease diagnosis using
support vector machines. Biomedical Research, 28(9), 4208–
4212.
3. Diehr, P., Wood, R. W., Bushyhead, J., Krueger, L., Wolcott,
B., & Tompkins, R. K. (1984). Prediction of pneumonia in
outpatients with acute cough--a statistical approach. Journal
of Chronic Diseases, 37(3), 215–225.
4. Er, O., Yumusak, N., &Temurtas, F. (2010). Chest diseases
diagnosis using artificial neural networks. Expert Systems with
Applications, 37(12), 7648–7655.
5. Influenza (flu) - Diagnosis and treatment - Mayo Clinic.
(2019). Retrieved May 3, 2019, from
https://www.mayoclinic.org/diseases-conditions/flu/diagnosis-treatment/drc-20351725
6. Tuberculosis - Symptoms and causes - Mayo Clinic. (2019).
Retrieved May 3, 2019, from
https://www.mayoclinic.org/diseases-conditions/tuberculosis/symptoms-causes/syc-20351250
7. Pneumonia - Symptoms and causes - Mayo Clinic. (2019).
Retrieved May 3, 2019, from
https://www.mayoclinic.org/diseases-conditions/pneumonia/symptoms-causes/syc-20354204
8. Naive Bayes classifier. (2019). Retrieved May 3, 2019, from
https://en.wikipedia.org/wiki/Naive_Bayes_classifier
9. Decision Trees — scikit-learn 0.20.3 documentation. (2018).
Retrieved May 3, 2019, from
https://scikit-learn.org/stable/modules/tree.html
10. sklearn Ensemble RandomForest Classifier. (2019). Retrieved
May 3, 2019, from
https://scikitlearn.org/stable/modules/generated/sklearn.ensem ble.RandomForestClassifier.html
11. Lustgarten, J. L., Gopalakrishnan, V., Grover, H.,
&Visweswaran, S. (2008). Improving classification
performance with discretization on biomedical datasets. AMIA
... Annual Symposium Proceedings. AMIA Symposium, 2008,
445–449. Retrieved from
http://www.ncbi.nlm.nih.gov/pubmed/18999186
12. Symptom Checker from WebMD. Check Your Medical
Symptoms. (2017). Retrieved May 3, 2019, from
https://symptoms.webmd.com/default.htm#/info
13. Mitchell, T. M. (2017). Machine learning. McGraw Hill.
14. Syed Danish. (2016). Practical Guide on Data Preprocessing
in Python using Scikit Learn. Retrieved May 3, 2019, from https://www.analyticsvidhya.com/blog/2016/07/practical-guide-data-preprocessing-python-scikit-learn/
15. Bhardwaj, A. (n.d.). Data Preprocessing Techniques for Data
Mining. Retrieved from