Abstract— Purpose: The key to every economic and social development lies in its solid infrastructure and this plays a paramount importance in the case of developing countries like India. Although policies related to website and physical accessibility exists; however, there is a dire need to bring about its awareness to the stakeholders (employers and visually challenged employees) who are going to need it to build in an all-inclusive robust infrastructure that will result in diversity-inclusion and enhanced empowerment
The purpose of this research is not just to highlight this gap existing in the system but to suggest the companies to imbibe an empathetic perspective for ensuring the accessibility infra for all its stakeholders so that the government’s accessibility audit checklist justify its purpose.
Methodology: Full time 60 visually impaired from the service sector (namely banking, IT, hospitals, call centers, NGO and school staff) in India were considered for the study through the mixed methods research where quantitative analysis has been done through purposive sampling. Further Public awareness indicator measured by means of a public opinion survey has been undertaken. In this case ‘public’ means the visually impaired employees.
In addition, Qualitative analysis through Phenomenology method has been undertaken from the Indian government approved ‘Accessibility Auditors’ regarding their experiences about the accessibility audit checklist (Department of Empowerment of Persons with Disabilities; government of India) in various Indian organizations.
And secondly through verbatim, the authors have gauged the awareness amongst the visually disabled employees about the above mentioned audit checklist that includes both Website accessibility as well as Physical Accessibility related to Infrastructure
Findings: There exists a significant gap between the knowledge about such important policies amongst the visually impaired employees
Supporting this is their verbatim that highlights the need for the companies to introduce such policy awareness amongst its employees through including this in their Induction program
Practical Implications: The knowledge of such policies amongst the employees; especially the visually impaired will help them to raise their grievances and thereby help organizations in expanding vision of the Indian government of the universal accessibility under the Inclusiveness and Accessibility Index
Social Implications: The visually impaired will be better equipped to work if their companies take due diligence and care for their special accessibility needs to make the working environment and culture a Disability-Inclusive
Originality/Value: The paper attempts to know the awareness amongst the employees especially the visually challenged; about the Accessibility Audit checklist and to decipher from the
Revised Manuscript Received on September 10, 2019.
Dr. Neha Patvardhan, Asst. Professor, Finance, Symbiosis Institute of International Business, Pune, Maharashtra, India.
(Email: [email protected])
Dr. Smita Santoki, Asst. Professor, International Business, Symbiosis Institute of International Business, Pune, Maharashtra, India.
(Email: [email protected])
Accessibility auditors about the probable solutions to bridge the gap between the existing infra policy and this lack of knowledge amongst the stakeholders to make the working environment disability integrated.
Keywords: Accessibility Audit, visually impaired, policy awareness, socially smart infrastructure, Inclusiveness and Accessibility Index.
I. INTRODUCTION
India sadly has one of the major number of blind people in the world. With roughly about 30 percent of blind population of the world residing in India; it becomes imperative for the government and its citizens to not only be empathetic towards this segment of people but to realize their needs in making them a part of the wide diversity that India is known for.
The most common aspect to link anyone to the common platform is through a conducive environment that works on a solid robust infrastructure and therefore this paper is focused on finding not just the knowledge gap that exists between the government’s accessibility policies for the blind and the awareness of the visually challenged citizen about them; but to suggest ways in which the government and the companies can reach out to these often neglected people of our society to help them equip to the facilities provided by the government.
As this will not only uplift the motivation and spirit of these people to work with dignity; but will also directly help all of us in the country to have an all-inclusive smart social infrastructure.
II. LITERATURE REVIEW & RESEARCH GAP
A. Literature review
“Visually challenged individuals are a growing segment of our population (N.Paisios, 2012) and the social constructs are not always designed keeping them in mind.” It is therefore imperative for the respective governments of all countries; especially developing like ours that also unfortunately houses; one of the major blind population of the world- to focus on the needs and requirements of this segment of the population to carry out their daily routine with ease.
Past research carried out in the Indian context is based on the causes and effects of blindness, ‘current estimates of blindness in India’ (Murthy et all, 2005), psychological well-being of the visually
Connecting Governments’ Accessibility Policy
to Its Visually Challenged Stakeholders for An
reference to website accessibility, physical accessibility and most importantly; it would not be a tall claim but a matter of fact that there is negligible work done with reference to their own rights with references to any benefits- be it the physical accessibility, website accessibility or even the fact that they have policies for them that are audited at regular time intervals and gaps identified. Most of the companies many times are completely unaware of this policy that is made available for their visually impaired employees.
“Accessibility is an issue for everyone to overcome” (Sat N, 2010) and as government is mainly responsible for providing its citizens with all the necessary things for a suitable living, more care and efforts are expected from them towards the specially abled groups.
Repertory Grid technique has wonderfully been able to bring out the results for customers’ needs. (Baxter. D et al, 2014) “use of the repertory grid technique (RGT), a method adopted from psychology that has been used in new product development to help uncover customers' hidden needs.” And if this can be true to find the hidden needs, then we also adopted this technique to find out the visually impairer’s hidden untold needs.
B. Research Gap
Most of the research in the past focuses on the blind with reference to their numbers and estimates of blindness, causes of blindness, eye-care policy, adolescent blind and their issues etc.; but none of the research is carried out in finding whether the current available infrastructure policy curated so well by the Indian government has actually reached the knowledge of its stakeholders i.e. the visually challenged people and whether the audit checklist that is so clearly stated known to this disabled group. All of this is not yet done in the past research in the Indian context. Our research paper has identified this gap and attempted to work for the same.
III. OBJECTIVES
To find out the level of awareness amongst the visually challenged employees about the government’s accessibility policy
To know the various problems the visually challenged is confronted with, while accessing the public infrastructure and how accessibility can be improved further for them in line with the government’s accessibility audit checklist.
IV. HYPOTHESIS
H0:
All emergent constructs are not properly implemented
H1:
All emergent constructs are properly implemented
V. RESEARCH METHODOLOGY
In this study, Phenomenology technique has been undertaken for the content analysis, in which verbatim were collected from respondents, comprising of visually challenged employees and the accessibility Auditors. To
impaired subjects in accessing the infrastructure and to improvise the same as to become socially inclusive and to make it accessible for independent mobility, a Repertory Grid technique by Kelly (1955) has been used by the researchers.
In this technique, elements are the objects of study, for this research, elements are some of the common infrastructure units (such as working organizations, shopping malls, Government buildings, etc.), which has been accessed by the visually impaired respondents.
To maintain the homogeneity of the mix of elements; they have been categorized in three groups. This categorization is based on the accessibility satisfaction of the visually impaired participants for the different infrastructure units, as to high, average and low satisfaction. According to (Stewart & Stewart, 1981), elements should be discrete and homogenous. Total 9 elements in equal ratios, commonly known to the participants (homogenous) and belonging to the three different categories (discrete), were identified and supplied by the participants.
To avoid any biasness, the participants were not informed about the selection Criteria implemented for the nine elements. For developing the accessibility constructs, 12 visually impaired participants (5 females and 7 males) were interviewed using the “triading” technique (Kelly, 1955), who are having an average of 5 years of work experience and also use smartphones for navigation support.
The participants were interviewed for two main questions “what are the various problems they are confronted with, while accessing a specific infrastructure unit” and “how accessibility can be improvised further in line with the Government’s accessibility audit checklist”. Nine cards were prepared and labelled as “A, B, C, D, E, F, G, H, I”, and the respondents were asked to pick any three of them randomly. They were requested to describe that how the two elements are similar to and the other one is differently contrast from the former two.
To maintain the rationale and to keep the focus of the interview process, the participants were made to adhere to the three main sections of the accessibility audit checklist as follows:-
Information and communication relating to the service being provided in the building
Evaluation of Services - Looks at how services are provided in the building
Audit of the physical aspects of the building- Two further sections - External environment and Internal Environment
laddering technique was undertaken, to ensure the same meaning of the construct or by giving synonyms for the same construct. This process was repeated a number of times with different set of cards, until a saturation point was reached, when no new construct is being evolved. This whole process took about an hour and a half for each participant
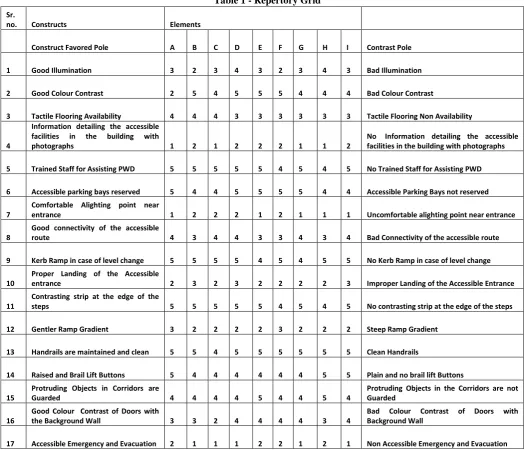
All the constructs, along with their respective contrast poles have been recorded in a repertory grid. The constructs are rated on a 5 point likert scale as 1 for high satisfaction and 5 for low satisfaction with respect to the different
accessibility constructs of the different elements. The Repertory Grid is shown in Table 1
[image:3.595.35.560.189.639.2]Qualitatively, interview technique is implemented for getting viewpoints, suggestions and experience sharing from a few of the lead auditors (active in 2018) who were a part of the ‘Accessibility Audit’ for the year 2018 and had a rich experience in audit spanning from 8-15 years. 5 such lead auditors representing NGOs and social initiatives were interviewed. Their verbatim is recorded and slice of this output is shared in the findings.
Table 1 - Repertory Grid
Qualitatively, interview technique is implemented for getting viewpoints, suggestions and experience sharing from a few of the lead auditors (active in 2018) who were a part of the ‘Accessibility Audit’ for the year 2018 and had a rich experience in audit spanning from 8-15 years. 5 such lead auditors representing NGOs and social initiatives were interviewed. Their verbatim is recorded and slice of this output is shared in the findings.
VI. DATA ANALYSIS & INTERPRETATION RESULTS
To the above repertory grid method, analysis is carried out using the Idiogrid 2.4 software version where the analysis is done through two different formats. One being the text output of singular value decomposition (as shown in representation 1 below) and the other being the graphical output plotted elements on
different quadrants where we Sr.
no. Constructs Elements
Construct Favored Pole A B C D E F G H I Contrast Pole
1 Good Illumination 3 2 3 4 3 2 3 4 3 Bad Illumination
2 Good Colour Contrast 2 5 4 5 5 5 4 4 4 Bad Colour Contrast
3 Tactile Flooring Availability 4 4 4 3 3 3 3 3 3 Tactile Flooring Non Availability
4
Information detailing the accessible facilities in the building with
photographs 1 2 1 2 2 2 1 1 2
No Information detailing the accessible facilities in the building with photographs
5 Trained Staff for Assisting PWD 5 5 5 5 5 4 5 4 5 No Trained Staff for Assisting PWD
6 Accessible parking bays reserved 5 4 4 5 5 5 5 4 4 Accessible Parking Bays not reserved
7
Comfortable Alighting point near
entrance 1 2 2 2 1 2 1 1 1 Uncomfortable alighting point near entrance
8
Good connectivity of the accessible
route 4 3 4 4 3 3 4 3 4 Bad Connectivity of the accessible route
9 Kerb Ramp in case of level change 5 5 5 5 4 5 4 5 5 No Kerb Ramp in case of level change
10
Proper Landing of the Accessible
entrance 2 3 2 3 2 2 2 2 3 Improper Landing of the Accessible Entrance
11
Contrasting strip at the edge of the
steps 5 5 5 5 5 4 5 4 5 No contrasting strip at the edge of the steps
12 Gentler Ramp Gradient 3 2 2 2 2 3 2 2 2 Steep Ramp Gradient
13 Handrails are maintained and clean 5 5 4 5 5 5 5 5 5 Clean Handrails
14 Raised and Brail Lift Buttons 5 4 4 4 4 4 4 5 5 Plain and no brail lift Buttons
15
Protruding Objects in Corridors are
Guarded 4 4 4 4 5 4 4 5 4
Protruding Objects in the Corridors are not Guarded
16
Good Colour Contrast of Doors with
the Background Wall 3 3 2 4 4 4 4 3 4
Bad Colour Contrast of Doors with Background Wall
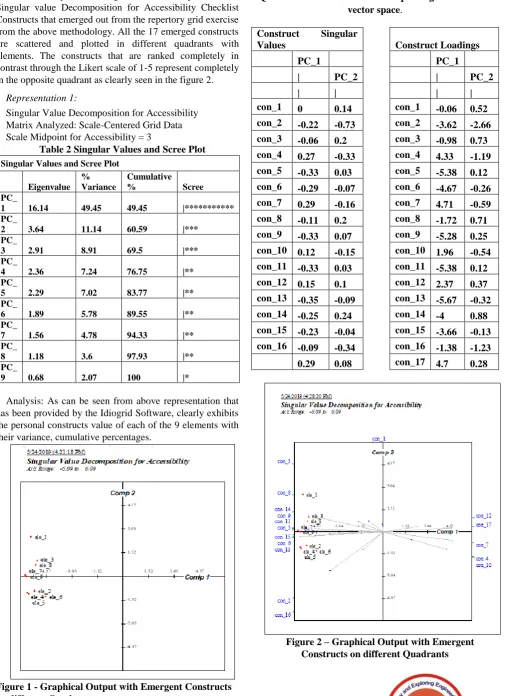
can group up the elements under each quadrant and contrast it with other quadrants. Figure 1 and 2 represents the Singular value Decomposition for Accessibility Checklist Constructs that emerged out from the repertory grid exercise from the above methodology. All the 17 emerged constructs are scattered and plotted in different quadrants with elements. The constructs that are ranked completely in contrast through the Likert scale of 1-5 represent completely in the opposite quadrant as clearly seen in the figure 2.
Representation 1:
Singular Value Decomposition for Accessibility Matrix Analyzed: Scale-Centered Grid Data Scale Midpoint for Accessibility = 3
Table 2 Singular Values and Scree Plot Singular Values and Scree Plot
Eigenvalue % Variance
Cumulative
% Scree
PC_
1 16.14 49.45 49.45 |***********
PC_
2 3.64 11.14 60.59 |***
PC_
3 2.91 8.91 69.5 |***
PC_
4 2.36 7.24 76.75 |**
PC_
5 2.29 7.02 83.77 |**
PC_
6 1.89 5.78 89.55 |**
PC_
7 1.56 4.78 94.33 |**
PC_
8 1.18 3.6 97.93 |**
PC_
9 0.68 2.07 100 |*
[image:4.595.51.559.73.769.2]Analysis: As can be seen from above representation that has been provided by the Idiogrid Software, clearly exhibits the personal constructs value of each of the 9 elements with their variance, cumulative percentages.
Figure 1 - Graphical Output with Emergent Constructs on different Quadrant
Table 3 Graphical Output plotted Elements on different Quadrants Note. Values used for plotting constructs in
vector space.
Construct Singular
Values Construct Loadings
PC_1 PC_1
| PC_2 | PC_2
| | | |
con_1 0 0.14 con_1 -0.06 0.52
con_2 -0.22 -0.73 con_2 -3.62 -2.66
con_3 -0.06 0.2 con_3 -0.98 0.73
con_4 0.27 -0.33 con_4 4.33 -1.19 con_5 -0.33 0.03 con_5 -5.38 0.12 con_6 -0.29 -0.07 con_6 -4.67 -0.26 con_7 0.29 -0.16 con_7 4.71 -0.59
con_8 -0.11 0.2 con_8 -1.72 0.71
con_9 -0.33 0.07 con_9 -5.28 0.25 con_10 0.12 -0.15 con_10 1.96 -0.54 con_11 -0.33 0.03 con_11 -5.38 0.12
con_12 0.15 0.1 con_12 2.37 0.37
con_13 -0.35 -0.09 con_13 -5.67 -0.32
con_14 -0.25 0.24 con_14 -4 0.88
con_15 -0.23 -0.04 con_15 -3.66 -0.13 con_16 -0.09 -0.34 con_16 -1.38 -1.23
0.29 0.08 con_17 4.7 0.28
[image:4.595.58.287.514.751.2]As clearly seen figure 2; all the contradicting constructs that emerged from the elements’ ranking on the likert scale of 1-5 (1 being high satisfaction and 5 being the least satisfied) are in fully opposite quadrants to each other. For example, Construct 3 that emerged from elements ranking- Tactile flooring availability on the top left quadrant is completely opposite to emerged construct number 10- Proper landing of the accessible entrance; that is on the extremely right hand bottom quadrant. This means that the visually impaired are poorly satisfied with the tactile flooring in the infrastructure than the construct number 10 that is about the proper landing of the accessible entrance which has scored better averaged ranking by the elements in terms of the visually challenged’s better satisfaction.
Therefore, Hypothesis H1 gets rejected
VII. FINDINGS & SUGGESTIONS
Our research findings are derived from two sources. One from the interviews and verbatim from the lead auditors of the accessibility audit and the other from the research methodology repertory grid which is taken from the visually challenged on the 17 constructs that emerged from the grid technique.
There exists a significant gap between the knowledge about such important policies amongst the visually impaired employees as per the lead auditors. Also, many of them do not want to confront their companies about their rights, in the fear of losing their jobs. And they also go through lack of confidence in most of the cases due to suffering from a lack of convenience in their day to day lives.
Supporting this is the repertory grid that highlights the need for the companies to introduce such policy awareness amongst its employees through including this in their Induction program
The knowledge of such policies amongst the employees; especially the visually impaired will help them to raise their grievances and thereby help organizations in expanding vision of the Indian government of the universal accessibility under the Inclusiveness and Accessibility Index
The researchers would like to suggest the following to the Indian government and the Indian companies for the benefit of our visually impaired segment of the society so that they are diversely integrated with the main stream:
A. For the Indian Government
Increase the marketing and advertising of their enriched ‘Accessibility Policy’ to their visually challenged citizens by way of approaching the NGOs, social camps and visually disabled centers.
To make it mandatory for each company in India to have ‘Accessibility Audit’ get done in their respective company annually
Accessibility is one of the major concerns of the working blind segment in India as it emerged out from our research findings. Lack of awareness along with lack of guidance may make things extremely worse for them and therefore the government through its accessibility policy and the accessibility audit checklist must go on a major awareness drive campaign, across the country.
B. For the Indian Companies
To introduce Accessibility (both physical and web) in their Induction and Orientation program for all (especially the visually challenged employees)
To sensitize others towards their visually challenged counterparts through trainings and live workshops
To get ‘Accessibility Audits’ done regularly at their place through the government approved auditors
To collect regular feedback from their visually challenged employees for their convenience to accessibility
VIII. RESEARCH LIMITATIONS & FUTURE SCOPE
The research is limited specifically to the needs, usage and limitations for the Indian visually challenged persons. The researchers also had limitations to the subjects involved as they have limited it to the number as 60.
Limitations however pave the way for the future scope of research in a way and so this research work can be extended to a larger group of data. This can be extended to the other disabled groups as well. And if this works for them in the Indian context, this research can be extended to the other similar neighboring countries having similar cultures and contexts.
IX. CONCLUSION
Amidst a lot of research work done for the blind in various categories like the one by Murthy G, Gupta S, Bachani D et al. that covers the current estimates of blindness in India where they have mentioned that “evidence based planning has been the hallmark of the blindness control program in India;” and same can be said about the accessibility checklist planned and prepared by the government where if they can add evidences of making their blind stakeholders aware about their policy would be of paramount success not just to the policy drafted so well but will do apt justice to the visually challenged employees and citizens of India in spearheading the task of accessing the available infrastructure and thereby result in an overall integration of the societal construct for a successfully smart social infrastructure
With the findings of this research work, it is clearly evident that if the visually challenged are provided with proper awareness about their own rights, opportunities and benefits; they can go to work in a hassle-free environment and turn out to be more confident and productive; thereby contributing to our economy as a whole.
X. REFERENCES
1. Brassai, S., Bako, L., & Losonczi, L. (2011). Assistive Technologies for Visually Impaired People. Acta Universitatis Sapientiae: ….
2. Murthy, G. V. S., Gupta, S. K., Bachani, D., Jose, R., & John, N. (2005, March). Current estimates of blindness in India. British Journal of Ophthalmology.
Empowering citizens with disabilities online. In Proceedings of the European Conference on e-Government, ECEG (pp. 345–356).
4. Soltani, S. H. K., Sham, M., Awang, M., & Yaman, R.
(2012). Accessibility for Disabled in Public
Transportation Terminal. Procedia - Social and Behavioral Sciences, 35, 89–96.
5. Srivastava, P. K., & Jaiswal, B. (2017). Developing competency model using repertory grid technique: The case of spinning master. Qualitative Report, 22(3), 895– 914.
6. Baxter, D. I., Goffin, K., & Szwejczewski, M. (2014). The Repertory Grid Technique as a Customer Insight Method. Research-Technology Management, (July-August), 35–42.
7. Hogan, T., & Hornecker, E. (2013). Blending the repertory grid technique with focus groups to reveal rich design relevant insight (p. 116). Association for Computing Machinery (ACM).
8. Tapu, R., Mocanu, B., & Zaharia, T. (2014). Real time static/dynamic obstacle detection for visually impaired persons. In Digest of Technical Papers - IEEE International Conference on Consumer Electronics (pp. 394–395). Institute of Electrical and Electronics Engineers Inc.
9. Paisios, N. (2012). Mobile accessibility tools for the visually impaired. ProQuest Dissertations and Theses. New York University, New York, NY.
10. http://disabilityaffairs.gov.in/content/accessible_india.ph p
11. http://disabilityaffairs.gov.in/upload/uploadfiles/files/Em panelment%20of%20Access%20Auditors.pdf
12. http://disabilityaffairs.gov.in/upload/uploadfiles/files/Inlc usiveness%20and%20Accessibility%20Toolkit.pdf
XI. AUTHORS PROFILE Dr. Neha Patvardhan
is currently serving as an Assistant Professor in the department of Finance at Symbiosis Institute of International Business, SIDU Pune She has been awarded a Ph.D. degree in the board of management and is also NET qualified. She has received master’s degree in management studies (MMS Finance) and has graduated with a Bachelor degree in the field of Pharmacy. To her academic accomplishments include diverse teaching experience of 8+ years in both national and international universities.
Her research interests span both corporate financing and Psychological and behavioral aspects related to visually challenged and catering their accessibility requirements.
Few Publications-
“The analytical study of steel sethe analytical study of steel sector using Altman Z score method
(JETIR June 2018)
“The Best Way to Improve the Performance of Credit Risk Analytics Model is not to Look for Fancy Tools or Techniques but to Improve Data Quality First”(IJETMAS, July 2017 )
“Educational outreach: critically important for the beneficiaries to understand the pros and cons of PPP projects”(with special reference to NMC), (IJAR, April 2017)
“Green Banking: Management Innovation in India For Sustainable Development”(November 2016)
“Public Private Partnership (Ppp) Projects: Reducing Financial Burden And Achieving Sustainable Development (With Special Reference To Nmc)” (IJME, June 2016)
“Public Private Partnership (Ppp) Projects: Reducing Financial Burden And Achieving Rapid
Infrastructure Development (With Special Reference To Nmc)” ( IJMAR, June 2015)
Mrs. Smita Santoki
is presently working as an Assistant Professor with the Symbiosis Institute of International Business (under the Symbiosis International Deemed University). She is a Masters in Commerce and with MBA in International Business and is currently perusing her PhD. With a diverse experience in both the industry and academics for the past 14 years, she is a Faculty, Corporate Trainer & a Consultant in the field of Export-Import Management, Foreign Trade Policies, International Diversity Management, & Shipping.