1-1-1994
A scanning electron microscope study of rat sciatic
nerve fiber regeneration through silicone rubber
multiple-lumen nerve cuffs
Chih-Hui Chih-Hui
Iowa State University
Follow this and additional works at:
https://lib.dr.iastate.edu/rtd
Part of the
Engineering Commons
This Thesis is brought to you for free and open access by the Iowa State University Capstones, Theses and Dissertations at Iowa State University Digital Repository. It has been accepted for inclusion in Retrospective Theses and Dissertations by an authorized administrator of Iowa State University Digital Repository. For more information, please [email protected].
Recommended Citation
Chih-Hui, Chih-Hui, "A scanning electron microscope study of rat sciatic nerve fiber regeneration through silicone rubber multiple-lumen nerve cuffs" (1994).Retrospective Theses and Dissertations. 18018.
through silicone rubber multiple-lumen nerve cuffs
by
Chih-Hui Chung
A Thesis Submitted to the
Graduate Faculty in Partial Fulfillment of the Requirements for the Degree of
MASTER OF SCIENCE
Interdepartmental Program: Biomedical Engineering Major: Biomedical Engineering
Signatures have been redacted for privacy
Iowa State University Ames, Iowa
TABLE OF CONTENTS
1. INTRODUCTION
2.
3.
LITERATURE REVIEW 2.1. Background
2. 1.1. Organization of a peripheral nerve 2. 1.2. Nerve degenerarion
2.1 .3. Nerve regeneration
2.2. Review of previous work in repair techniques 2.2. 1. Present nerve repair techniques
2.2.2. Summary of pa t re earch 2.3. Multiple-lumen nerve cuff
2.3. 1. Organization of a multiple-lumen cuff 2.3.2. Silicone rubber in a nerve cuff
4 4 4 6 8
10
10
I l
16 16
16
2.4. Silver stain 17
2.4. l. The principle of si 1 ver stain
17
2.4.2. The chemistry of a silver stain 18
2.5. Backscattered electron imaging for the silver stained axons 19
MATERIALS AND METHODS 3.1. Sample preparation
3.2. Scanning electron microscope examination 3.3. Quantitative evaluations
3.4. Diameter frequency distribution 3.5. Statistical methods
2 1 2 1 23 23
4.
RESULTS4.1.
Microstructure4. l. l. Scanning electron microscope studies
4.1.2. Light microscope studies
4.2.
Fiber diameter frequency distribution4.2. l . 8 weeks post-implantation (animal #34) 4.2.2. 12 weeks post-implantation (animal #24) 4.2.3. 16 weeks post-implantation (animal #14)
4.2.4. 24 weeks post-implantation (animal #1, #2 and #3)
4.3.
Quantitative results5.
DISCUSSION6. CONCLUSION
BIBLIOGRAPHY
ACKNOWLEDGMENTS
APPENDIX: FIBER DIAMETER HISTOGRAMS
28 28 28 40 40 41 41 42 42 43
79
82
83
90
LIST OF FIGURES
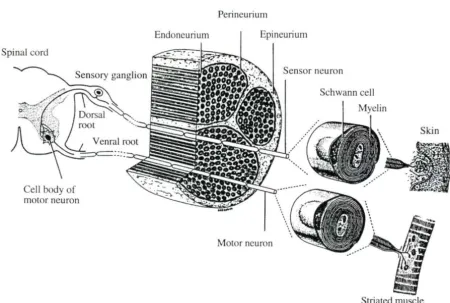
Figure 2. 1: Schematic representation of the structure of a typical mammalian peripheral nerve
Figure 2.2: Diagrams of the degeneration and regeneration of a single myelinated peripheral nerve fiber
Figure 4.1: Back cattered electron image of a cro section of the normal control right ciatic nerve (mid-thigh level)
Figure 4.2: Back cattered electron image of a cro ection of a regenerated nerve
5
7
30
from prox.imal, middle and di tal ections of animal #3 32
Figure 4.3: Back cattered electron image of one nerve trand of the middle ection
of animal #2 and of one nerve trand of the middle section of animal # 14 36
Figure 4.4: Back cattered electron image of one fascicle-like unit of the distal
LIST OF TABLES
Table 3. 1: SampJe list
Table 4. 1: Area examined, total area, percentage of area examined to total area, axon count for area examined, axon counts per unit area, mean axon diameter, and extrapolated counts based on total area in the proximal section observed
22
~~ ~
Table 4.2: Area examined, total area, percentage of area examined to total area, axon count for area examined, axon count per unit area, mean axon diameter, and extrapolated count based on totaJ area in the middle ection ob erved
by LM 48
Table 4.3: Area examined, total area, percentage of area examined to total area, axon counts for area examined, axon counts per unit area, mean axon diameter, and extrapolated counts based on total area in the distal section observed
byLM 50
Table 4.4: Area examined, total area, percentage of area examined to total area, axon counts for area examined, axon counts per unit area, mean axon diameter, and extrapolated counts ba ed on totaJ area in the proximaJ section ob erved
by SEM 52
Table 4.5: Area examined, total area, percentage of area examined to total area, axon count for area examined, axon count per unit area, mean axon diameter, and extrapolated counts ba ed on total area in the middle section ob erved
by SEM 53
Table 4.6: Area examined, total area, percentage of area examined to total area, axon counts for area examined, axon counts per unit area, mean axon diameter, and extrapolated counts based on total area in the distaJ section observed
by SEM 54
Table 4.7: Area examined, total area, percentage of area examined to total area, category I axon count for area examined, category I axon counts per unit area, mean category I axon diameter, and extrapolated category I
Table 4.8: Area examined, total area, percentage of area examined to total area, category I axon count for area examined, category I axon counts per unit area, mean category I axon diameter, and extrapolated category I
axon counts based on total area in the middle section observed by SEM 56
Table 4.9: Area examined, total area, percentage of area examined to total area, category I axon counts for area examined, catego1y I axon counts per unit area, mean category I axon diameter, and extrapolated category I
axon counts ba ed on total area in the distal section observed by SEM 57
Table 4.10: Area examined, total area, percentage of area examined to total area, category II axon counts for area examined, category II axon count per unit area, mean category II axon diameter, and extrapolated category II
axon counts ba ed on total area in the proximal section observed by SEM 58
Table 4.11: Area examined, total area, percentage of area examined to total area, category II axon counts for area examined, category II axon counts per unit area, mean category II axon diameter, and extrapolated category II
axon counts based on total area in the middle section ob erved by SEM 59
Table 4.12: Area examined, total area, percentage of area examined to total area, category II axon counts for area examined, category II axon counts per
unit area, mean category II axon diameter, and extrapolated category II
axon counts based on total area in the distal section ob erved by SEM 60
Table 4.13: Percentage of axons within± I µm of the mean axon diameter (LM) 61
Table 4.14: Percentage of axons within± 1 µm of the mean diameter for
catego1y I axons (SEM) 62
Table 4.15: Percentage of axons within± 1 µm of the mean diameter for
category II axons (SEM) 63
Table 4.16: Percentage of axons within± l µm of the mean diameter for all the
axons (Category I plus Category IT; SEM) 64
Table 4.17: Diameter ratios and predicted differences of measurements for
Table 4.18: Diameter ratios and predicted differences of measurements for catego1y I
axons (SEM) 66
Table 4.19: Diameter ratios and predicted differences of mea urements for category II
axons (SEM) 67
Table 4.20: Diameter ratios and predicted differences of measurements for total axons
(SEM) 68
Table 4.21: Mean axon diameter compari ons between LM and SEM tudies in the
ame nerve section 69
Table 4.22: Mean axon diameter compari on between repaired nerve ection and
normal control (LM) 70
Table 4.23: Mean axon diameter compari on between nerve ection in the anie
animal (LM) 7 l
Table 4.24: Mean axon diameter compmisons between repaired nerve sections and
normal control (SEM) 72
Table 4.25: Mean diameter compari ons of the same category axon between repaired
nerve sections and normal control (SEM) 73
Table 4.26: Diameter compari on between category I and category II stained axon
in the ame nerve section (SEM) 75
Table 4.27: Mean diameter compari ons of the same category of axons in different
nerve sections (SEM) 76
Table 4.28: Mean diameter compari ons of total tained axons between nerve ection
The choice of a peripheral nerve repair method depends on the type of nerve injury, severity of damage, and clinical considerations. End-to-end anastomosis, epineurial or perineuriaJ (fascicular) suture repair is u ed to direct coaptation of the nerve stump exhibiting small tissue los or defects of the order of l cm or less. However, nerve grafting is usually con idered if the gap i appreciable (~ 1.5 cm). The problem is that even though the e repair techniques have been improved, they still do not provide completely satisfacto1y re ult .
nde irable car tissue or trauma caused by fascicular or epine urial urgical manipulations or by postoperative stretching which results in tension along the suture line frequently interferes with the growth from the proximal stump to the distal tump in end-to-end anastamosis re pair. To date, biological materi als have served as autografts, allog rafts, or heterografts to pan such gaps between proximal and distal stumps of a severed nerve, but the primary require ments and the possibility of immunological unacceptance associated wi th a donor graft are difficult to predict. Therefore, the development of artificiaJ biocompatible conduit to aid in reuniting the proximal and distal Lumps of a evered nerve has been sugge ted as an aJternative.
olution, laminin gel, collagen gel, or cultured Schwann cells). In addition, omc ingle lumen
nerve cuff tudies showed that regenerating nerve cables become tapered toward the center of
the gap region into which the material grows or exhibit branching du ring growth across a gap
toward the di tal tump o f a severed nerve.
The first multiple-lumen nerve cuff syste m made of silicone rubber was developed by
Danie l (1991 ). It was made of silicone rubber and wa de igned to bridge a 0 .5 cm gap. Its
purpo e was to improve the alignment of regenerated nerve material across the gap and into the
di tal tump, to provide mechanical upport, to e liminate or minimize car ti ue at the
proximal stump, and to improve nerve axon organization as it regenerates across the gap to the
di tal tum p. Light micro copy, e lectrophy iological evaluations and videotape ob ervation
were conducted to determine advantages in using such a cuff configuration. Like other silicone
rubber nerve cuff , the multiple-lumen nerve cuff yste m also provide. an isolated regeneration
environment to inhibit proliferation o f fibroblasts and scar tissue that otherwise might come in
from urrounding tissues. Also, it provides a way to maintain growth factor in ide the cuff
that can be released from the distal stump .
A an extension of Daniel' . tudy, the current work includes microstructural tudie at
a relati vely highe r le ve l of magnification. This technique e mploys an electron back cattering
ignal from an e lectron beam inte raction with the sample whe n using a canning electron
micro cope y tern. T he neurofilament prote ins o f axons have a high pecific a ffi nity for ilver
and can be stained using Bodian's method . Because the increase in back cattered e lectron
igna l produc tion direc tl y correlates with an increasing atomic number, high ato mic number
(high contrast) silver sta ined axons can be easily seen within a relati vely low atomic number
ti ue matrix.
Following canning electron microscope (SEM) observations, the chm·acteri tics o f the
regenerated axon , s uch as patte rn , hapes, ize , organization, and o rie ntatio n, are
2. LITERATURE REVIEW
2.1. Background
2.1.1. Organization of a peripheral nerve
The primary functional and structural unit of the nervou ·yste m i the neuron. The periphe ral neuron i a pecialized cell that serve two major fu nctions : e n ation a nd conduction. In the peripheral nervous system, a typical neuron i comprised of a cell body ( oma or perikayon), an axon and a variable number of dendrites.
In the pe ripheral nervous system, nerve cells are classified as being either myelinated or unmyelinated ba ed on the structural relationship between an axon and it satellite Schwann cells which are capable of forming myelin sheaths. In unmyelinated nerves, usually more than one nerve fiber may be enfolded by a Schwann cell and one layer of its pla ma membrane. On the other hand, in myelinated nerves, a Schwann cell encompasses a single fiber by means of it lamellar wrapping heath, or myelin (Figure 2. 1). Along the le ngth of myel inated axon . nodes of Ranvier appear as exposed j unctions, where there is no myel in between con ecutive Schwann cell. .
Nerve fibers exhibit a range of possible diameters. There is a c lo e proportio nal correlation between the thicknes of a nerve fiber and the speed of e lectrical conduction. The absolute values vary according to the species and the site studied. The nerve fibers in human are arranged in three groups (Daniel and Terzis, 1977):
A -- diameter 2.5 µm - 16 µm, conduction velocities 15 m - 100 m per econd; B -- diameter about 3 µm, conduction velocities 3 m - 15 m per econd;
Spinal cord
Sensory ganglion
Cell body of motor neuron
Endoneurium
Perineurium
Epineurium
Sensor neuron
Motor neuron
Schwann cell Myelin
Skin
[image:13.572.65.516.98.401.2]Striated muscle
Figure 2.1. Schematic representation of the structure of a typical mammalian peripheral nerve (Junqueira e t al., 1983; Fig. 9-28)
A slender connective tissue sheath, the endoneurium, encompasses each peripheral nerve fiber and associated Schwann cell (Figure. 2.1). The components of the endoneurium include fibroblasts, an occasional macrophage, and collagenous and reticular fibers. Nerve
fibers collect into fascicles, enclosed entirely by a perineurium which is composed of compact cellular layers arranged concentrically. The inner layers are flattened epithelioid cells and the outer layers are connective tissue layers. The outer perimeter, the epineurium, possesses a thick areolar connective tissue sheath and is comprised of collagen fibers. The epineurium surrounds
the epineurium, where the arterie can branch. After branching, the passage of the precapillary ves els through the perineurium becomes difficult to follow. The smaller endoneurial vascular plexu it elf forms the endoneuriaJ circulation in terms of a capillary network (Low, 1976).
2.1.2.
Nerve degeneration
When a peripheral nerve has been damaged or evered, degenerative proces e spread into both nerve stumps along the axon from the zone of trauma. Then, the e tumps retract from one another and tart to well. After per i ting for about one week, thi welling lowly subsides. Because the proximal segment of an injured nerve still maintains continuity with the trophic center of the neuron, the proximal change (called traumatic degeneration or a cending degeneration) extend no further than the second or thi rd node of Ranvier from the point of
everance (Figure 2.2B).
In contrast to proximal changes over a hort di tance, Wallerian degeneration occur through the entire distal egment that i completely separated from the nerve cell body. Thi takes place with the involvement of Schwann cells and the loss of myelin and axons (Figure 2.2B). The evered axon located at the proximal end of the di tal stump tend to detach and become i olated from the rest of the di taJ stump. Then the remaining portion of the di. ta! axons break down more rapidly and become beaded. Accompanied by axonal retrogres ion, the myelin sheath retracts from the axon at the nodes of Ranvier, creating increased nodal gap , and there is a lo s of the laminated or layered organization. The sheath area becomes homogencou . Later, it further breaks apart into ovoids and ellipsoids surrounding the axonal fragment . Neurofilament and neurotubule , collectively termed as neurofibril (in the axopla m), disintegrate and disappear.
B
,•
.
•
•
O.~
e;o
12 weeks
c
D E'
I•'
3 weeks 3 months Several months
Figure 2.2. Diagrams of the degeneration and regeneration of a single myelinated
peripheral nerve fiber. A: Normal nerve fiber, B : Changes during two weeks after transection. C: Three weeks after the transection. D: ln this example, the nerve regeneration was successful.
E:
When the axon branches do not penetrate the connective tissue surrounding, its growth is not organized.(Junqueira et al.,1983; Fig. 9-18)
2.1 .3. Nerve regeneration
Regeneration i the re ponse of a peripheral nerve fiber to injury and it accompanying nerve degeneration. Regeneration initiates from the undegenerated proximal part of the neuron that is still connected to the trophic center cell body. Survival of ne urons is inver ely proportional to the distance from the cell body. Several factors influence the growth and development of the repairing nerve: location of the lesion ; age of the individual; length of the impaired nerve; width of the de ·troyed nerve which leaves a gap; alignment of the cut surface of the nerve tump ; extent of the injury and amount of the hemorrhage in urrounding ti ue (Swaim, l 987).
To complete a repair, the sequence of nerve regeneration require the cell body to expend con iderable energy. This process takes place similarly for both sen ory and motor nerves. During chromatoly is and enlargement of the cell body, RNA and DNA synthesis activitie increase within the cell. Simu ltaneously, this increases e nzymatic activity and incorporation of amino acids within the cell body causing an increase in metabolic activity which lead to axonal regeneration.
Jn
addition, ome peripheral nervou ti ue relea es ub tance , called nerve growth factor. , to timulate neuron growth. However, the cell body may die if the injury or severance gets too c lose to it, or if the metabolic capacity of the cell body does not sati fy the need of the amount of axon that must be regrown.the membrane. There i till a significant fraction that continues onto the terminal segments of the e lo ngating axons (Swaim, 1987). Furthermore, when axon regenerate in respon e to severance of a nerve, the outgrowth rates of the axons are apparently limited by the supply of cytoskeleton associated with the delivery rate-components. Growth cone function (sprouting) i determined by microfilaments (polymers of actin). The asyrrunetry of the elongating axon is tabilized by microtubules (polymers of tubulin). The radial growth of an axon (maturation) is maintained by neurofiJaments (polymers of triplet) (McQuarrie, 1983).
Nerve regeneration is influenced by the changes within the extracellular environment and the nerve stump . Fibroblasts and circumferential cells infiltrate the injury ite and migrate toward each other to establish a tissue bridge and capillary network between the proximal and distal stumps. Then axons initiate prouting from the proximal stump. This is associated with the increa ed metabolic activity of the cell body. The axons elongate toward the di tal stump along thi newly built tissue pathway. Depending on the degree of the injury, axonal budding starts 1 to 3 cm proximal to the damage site (in cases of diffuse traumatic severance) or begins a few millimeters retrograde to the last node of Ranvier (in the case of a sharply localized injury).
Williams et al. , 1983; Williams and Varon, 1985). Subsequently, the Schwann cells enclose the regenerated axons by multiple concentric wrappings, that is, they remyelinate the regenerating axons.
Unmyelinated fibers regenerate more rapidly than myelinated axon , (Allt, 1976; Williams et al., 1983; William and Varon, 1985). Axon branches pu ·h the Schwann cells of the tubule to the ide while migrating into pre-existing endoneurial tubules in the distal stump.
H owever, if the axon branche do not enter the endoneurial tubu le or are unable to penetrate the connective ti ue surrounding , their regeneration is blocked (Figure 2.2E). Even though everal axons may migrate into a tubule and develop, only one branch will become myelinated and ful ly mature once successful in contacting with a peripheral motor end plate or
en or receptor (Figure 2.2D).
2.2. Review of previous work in repair techniques
2.2.1. Pre ent nerve repair techniques
Scar ti sue or trauma in the perineurium, intrafa cicular tissue or perineurium can be cau ed by fascicula.r or perineuria1 surgical manipulations. This scar tissue frequently interferes wilh the growth of axon from the proximal tump into the di taJ nerve stump and after repair, some fascicles till can override, gap, buckle, or straddle the aligned components. In addition, if the injury i. extensive or if the gap between the nerve stumps is longer than 1.5 cm, these nerve tumps cannot be brought together . atisfactorily. A nerve grafl or a nerve tube (sutureless repair technique) provide an alternative to bridge this condition. To eparate a fibrou healing from axonaJ regeneration until Lhe perineurium re-e tabli he continuity, a cellular approach u ing a fa cicuJar Lube or a nerve coupler as an artificial perineurium was introduced by Ro en et aJ. ( 1979, 1983) and by Mar haJl et al. ( 1989). To deal with problem of central tapering and gapping, Daniel ( 1991 ) developed the first multiple-lumen cuff y tern. It wa made of ilicone rubber. These preliminary studie were performed to bridge 0.5 cm gaps in the sciatic nerves of rats. They demon trated the feasibility of using a multiple lumen cuff for upport, guidance and orientation of axon growth from proximal to di ta1 rump .
2.2.2.
Summary of past researchproblem of finding a vein with the appropriate dimen ·ion . Even though an allograft or a heterograft ha a potential to serve a · a nerve bridge, immune rejection might introduce problem .
Biocompatible materials have provided an alternative to serve as a nerve cuff when an autograft i unavailable. Many types of materials have been employed . Nonpermcable, or lightly permeable, and nonbiogradeable materials have been investigated such as ilicone rubber (Daniel, 199 1; Fields and Ellisman, I 986a, I 986b; Gib on and Daniloff, 1989; Jenq and Cogge hall, 1985; Le Beau et al. , l 988b; Lundborg et al. , I 982a; MUiier et al., 1987; Politi et al., 1982; Satou et al., 1986; William et al., 1983, 1984, 1987; William and Varon, 1985; Yannas et al., 1989), Teflon® (Cuadro and Granatir, 1987), cellulo e acetate (Bas elt et al., 1959), Goretex® (Young et al. , 1984), and polyethylene terephrhalate (Yo hii et al. ,
1987). Bioresorbable or biodegradable mate rials have been introduced to reduce the confineme nt of newly formed epineurial . heaths or to e liminate compres io n of the regenerating nerves. Examples inc lude polyglactin mesh (Molander et al. , 1983), polyglycolic
acid (Mathur et al. , 1983; Ro en, et al. , 1983, 1989), polyester (Henry et al. , 1985) and glycolide trimethylene carbonate (Rosen et al., 1992). In addition to providing axon guidance, certain nerve cuff may influence the regeneration process by modulating solute exchange between regenerating and extra-channel environments. The u e of semipermeable material
uch as polysulfone with a range of molecular weight cutoffs (Aebischer et al., I 989a, 1988),
hemodiaJysi -type acrylic copolymer with a 50,000 dalton cutoff (Uzman and Villega , I 983a, 1983b) and polyvinylchloride acrylic copolymer with a 50,000 dalton cutoff (Valentini et al., 1987) permits selected intra- and extra-channel factors to provide nutrition.
regeneration can be promoted to pan 2 cm interstump gap le ngth (William el al., 1987). Williams and Varon (1985) demon trated thal an increase in the chamber volume ( I 1, 25, and 75 µI) through an increase in the chamber diameter ( 1.2, 1.8, and 3. 1 mm inner diame ter) adver e ly affects the natural matrix formation and results in a s ignificant re tardation of regeneration in chambers that were empty when implanted.
Prefilling elected chambers with dialyzed plasma results in a 3.5 fold increa e in the endoneurial area of regeneration and in axon count (William et al., 1987). On the other hand, Le Beau et al. (1988b) and Fields and Ellisman (I 986b) u pected that a constrictive effect was pre ent during nerve regeneration in ilicone rubber nerve cuffs. Ducker and Haye (I 968) pointed out that the growth of axons regenerating through ilicone tubes ha been hown lo be stunted by the constricting and ischemic effect of the tube itself. The problem i accentuated as lhe length of the gap increases and vascularization is further re tricted. The authors sugge ted that the optimum cross-sectional area of the cuff for maximum fiber growth might be 2.5 lo 3 times that of the nerve.
The importance of the distal nerve a a ource of target-derived neurotrophic factors nece ary for successful regeneration of the proximal nerve has been recognized by several investigator. (Lundborg et al. , 198 1; Lundborg et al., l 982a, l 982b; Madi on et al.. 1985; Politi et aJ., 1982; Seckel et al., 1984; Williams et al., 1984). The distal stump innuence axonal regeneration over a limited di tance of the order of I cm.
still can follow the basal lamina tubes (Kumagai et al., 1990; Tohyama and Kumagai, 1992). The dead Schwann cells killed by repeated freezing are phagocytosed by macrophages. The basal laminae of the Schwann cells remain as tubular scaffolds and the regenerating axons can grow through uch scaffolds from the proximal stump (Ide et al., 1983).
To improve the environment of regeneration in the chambers, humoral or substrate-bound chamber components such as laminin gel (Madison et al., 1985, 1987; Yoshii et al.,
1987), collagen (Rosen, et al., 1989; Satou et al., 1986), collagen-glycosaminoglycan
(Yannas, et al., 1989), collagen and cultured dorsal root ganglia cells (Shine et al., 1985), collagen and laminin gels (Madison et al., 1988; Valentini et al., 1987), basic fibroblast growth factor (b-FGF) or b-FGF and a 1-glycoprotein (a l-GP) (Aebischer et al., l 989b), dialyzed
plasma (Williams et al., 1987), or saline (Gibson and Daniloff, 1989; Williams et al., 1987; Williams and Y aron, 1985) have been evaluated. The observations suggest that growth or
trophic factors which are secreted by reactive cells or introduced by prefilling materials diffuse into the regenerative environment. They contribute to allow nerve regeneration even in the case of a presence of long gap lengths (greater than l cm, and up to 2 cm) or the use of blind-ended or empty distal nerve chambers.
The ultrastructural and morphometric characteristics of regenerated nerves (i.e., axon diameter, fiber diameter, myelin thickness, myelinated and unmyelinated axon counts, and organization) correlate with nerve physiological function recovery. Even after long implantation times, regenerated nerves are smaller than comparable normal adult nerves of a rat. Fiber diameter histograms display a bimodal diameter distribution with a much broader diameter
range in control rats compared with similar aged animals used in nerve regeneration studies. For normal Sprague-Dawley rat sciatic nerves (Fields and Ellisman, l 986b), myelinated axons
period, the regenerated axon diameter range only extends to about 6 µm and the diameter distribution i kewed below the peak 3.5 µm diameter (Rosen et al., 1983, 1992).
This decrease in average diameters seen for regenerated axons also agrees with the ob ervations of Espejo and Alvarez ( 1986), Henry et al. ( 1985), Le Beau ct al. ( l 988b), and Rosen et al. ( 1989). Le Beau et al. (l 988b) found the rat sciatic mean fiber diameter at 435 days implantation to be 2.39
±
0. 10 µm. This is ignificantly smaller than that of normal rat, 5.1 3±
0. 13 µm. In addition, the myelin sheath thickness is also . ignificantly reduced in the regenerated myel inated fibers compared to tho e of the normal control animal . Sheath thickne becomes thicker with the increa e in recovery time after the urgery (E pejo and Alvarez, 1986; Le Beau et al., l 988b).2.3. Multiple-lumen nerve cuff
2.3.1. Organization of a multiple-lumen cuff
The first multiple-lumen ne rve cuff system was developed by Daniel ( 199 1). The mulliple-lume n tubular component lhat fi lls a 0.5 cm gap between proximal and dislal nerve . rumps i positio ned coaxially within a single-lumen Silastic® medical-grade tube ( ·ingle lume n: catalog number 602-265, Dow Corning Corp., Midland, Michigan) which is 11 mm in length. There i a 3 mm opening on each e nd of single lumen tube for in erting and anchoring lhe stump . The outer diam eter of thi ingle lumen tube is 2.4 1 mm (0.095 inch). The inner diam eter of thi ingle lumen tube i 1.57 mm (0.062 inch). The rat ciatic ne rve u ed in the tudy were approximately J .2 mm in diameler. The 7-lumen cuff consi t of one central lumen (0.38 mm in diam eter). Six lumens (each 0.38 mm in diameter) are paced 0.3 mm from the central lumen (wal l-to-waJJ distance) in a circular patlem.
2.3.2. Silicone rubber in a nerve cuff
Silicone rubber is predo minantly buill up utilizing Lhe dimethyl-siloxane unit. The medium and hard grades are made from polydimethyl iloxane copolymerized with very small amounts of methylvinyl siJoxane whose methylvinyl portion makes for a more e fficie nt vulcanization. On the other hand, a small fraction of phenyl methyl siloxane contributes lo the softne s for the soft medical grade silicone rubber variety.
triaceLoxy ilane--i activated by absorption of waler from the air. For the two-compo nent sy tern, stannous octoate is added a a cataly t.
Very pure, finely divided particles of about 30µm in diameter serve a fillers in two compone nt RTV silicone rubber to enhance its mechanical propertie . In general , the more fillers u ed, the higher the density of the rubber (Park, 1984). Othe r varieties of ilicone rubber utilized ilica partic les of the order of 120.A. in diameter (heat vulcanizing varieties).
Silastic® elastomer Q7-4750 wa u ed for the central 7-lumen component of the cuff. Thi two-part e nhanced tear re i tant heat etting e lastome r con i ts of dimethyl and methylvinyl iloxane copolymer and rein forcing silica particles. It i graded a being medium hard. The ela tomer i c ured w ith a platinum cataly t for 10 minutes at 240°F. It i then po
t-cured for I -hour at 350°F.
2.4. Silver stain
2.4.1 . The principle of silver stain
Bodian' ilver tain has a specific affinity for neurofilaments of nerve fiber (Katz and Wat on, 1985; Phillip et al., 1983). ft i ugge ted that the neurofilament contain an amino acid sequence or ome econdary modification which binds d irectly with the silver.
silver impregnatio n method stains the areas of axonal fibe rs according to the content and density of neurofilame nts and, thu , highlights individual axons.
SchJaepfer and Micko ( J 978a) howed the elective di appearance of 69,000, J 50,000, and 200,000 dalton ne urofilament proteins in transected peripheral ne rves. The same protein have been identified in isolates of intact neurofilaments from a rat peripheral nerve and pinal cord (Schlaepfer and Freeman, 1978b). This suggests that the organization of neurofilament protein i broke n down during Walle rian axonal di integratio n. Subseque ntly, axonal regeneration, particularly during the maturation phase (which emphasize the radial growth of the axon), involves the laying down of ne urofilame nts (McQuarrie, 1983). Newly-formed (immature axon ), contain relatively few neurofilaments and fine cell processes. The tandard Bodian method doe no t stain the m (Katz and Wat on, 1985). In add ition, if an amino acid equence which has bee n proposed to bind directly with the silver greatly decreases in the regenerated axon, the cross section of this regenerated axon would di play a non-uni form stain. Therefore, the inte nsificatio n procedure needs to be fo llowed in order to enhance and define more clearly the fine cyto 'keletal structures normally tained by the Bodian silver tain.
2.4.2. The chemistry of a silver stain
A silver stain technique has three common features (Kiernan, L 98 1 ):
J. impregnating fixed tis ue in a solution containing silver ions
(I o-5 M to 1.0 M concentration).
2. ub equently treating the pecimen with a reducing agent to initiate the reaction: Ag+ + e-
=
Ag.Silver is taken up in two ways in the first step of the staining procedure. During impregnation, mo t of the silver is bound chemically by proteins throughout the tissue. This chemically bound silver is not specifically related to any axons. A much smaller fraction of the silver i reduced at sites in the argyrophilic axons and is precipitated as small silver nuclei (about 2-6 atoms). Then the tissue sections a.re transferred to a solution similar to an alkaline photographic developer containing sodium sulphite and hydroquinone. First, the sulphite initially removes the chemically bound silver from the proteins and simultaneously stabilizes the spontaneous reduction of Ag+ by introducing [Ag(S03)2J3- ions into the solution. Second,
the hydroquinone then reduces this complex ion to metallic s ilver on the surfaces of the previously formed nuclei a sociated with the argyrophilic axons. The metallic silver nuclei present in the axons thus enlarge and coalesce. The axons will appear black or brown 111 reflected light.
To overcome an inadequate light microscopy contrast for axons impregnated with silver, the contrast can be enhanced by toning the ilver-stained tissue sections in gold chloride. After gold toning, provided that this still doe not produce adequate improvement in contrast, it is necessary to add a further reduction stage to the procedure by using oxalic acid. Substantial deposits of gold precipitate a.round each original particle of silver. Finally, the specimens are immersed in aqueou sodium thiosulphate to remove residual silver salts and to stop the silver impregnation (Kiernan, 1981).
2.5. Backscattered electron imaging for the silver stained axons
electron and the electron rebounds with negligible energy lo s. This leads to the production of backscattered electrons. The other interaction group comprises inelastic collisions which happen whenever a primary beam collides with an electron of the specimen atom. The beam provides substantial energy lo that atom, resulting in the generation of secondary electrons, Auger electrons, characteristic X-rays and continuum (Bremsstrahlung) X-rays, long wavelength electron magnetic radiation, electron-hole pairs, lattice vibrations (photons), and electron o cillation (plasmons).
Backscattered electrons can escape from a relatively large depth within the sample (approximately 1 to 2 µm for a low atomic number matrix containing a high atomjc number feature). Back cattered electron production how a strong correlation with increasing atomic number. As the atomic number of a region of the specimen increases, a backscattered electron image results in increased image contrast for a feature. For this rea on, based on the mean atomic number differences between features of a sample, several phases may be distinguished in the backscattered electron image. Thus, stained neuron fibers can be recogruzed ea ily due to higher contrast provided by electrons backscattering fro m the silver (atomic number Z=47) precipitated in the fibers compared to the low atomi.c number of the myelin and connective tissue components surrounding the nerve fiber ( primarily, nitrogen (Z=7), oxygen ( Z=8) and
3. MATERIALS AND METHODS
3.1. Sample preparation
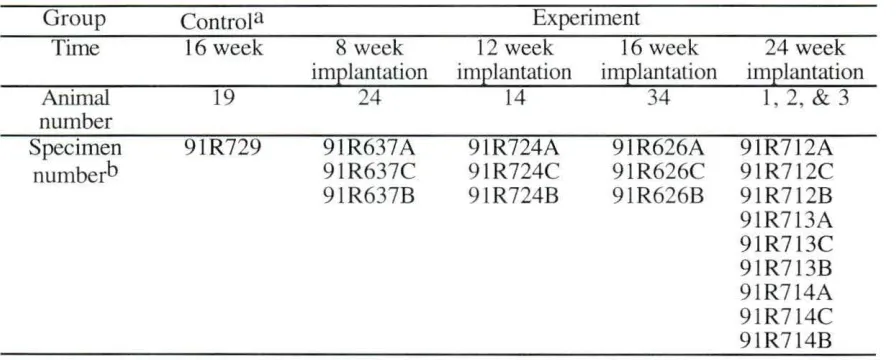
As an extension of the evaluation of the multiple-lumen cuff (Daniel, 199 1), the present study utilizes several of the thin sections from that study (Table 3.1). The nerve thin section specimens were stained with Bodian's silver stain for light microscopy studies. They were also suitable for an electron backscattered imaging study of axons. Three sections, about 2-3 mm long, had been removed from the proximal ection ( 4.5 mm proximal to the center of the cuff), the middle section (the center of the nerve cuff) and the distal section (4.5 mm distal to the center of the cuff) of experimental animals that had received a multiple-lumen cuff (8, 12, 16, or 24 week implantation periods). A 5 mm section of the sciatic nerve corresponding to the repair area of experimental animals was removed at the end of each implantation period for control animals. The male Sprague-Dawley rats used in this study were adults.
For the light microscope microstructural study, the specimens were processed with
10% neutral buffered formalin and then dehydrated in ascending concentrations of ethanol (from 70%, 80%, 90%, up to l 00% ). The samples were embedded (JB-4® embedding kit, Polyscience Inc., Warrington, PA) and then the 2-3 mm nerve blocks were ectioned ( 1.5 µm to 2.5 µm thickness sections). After the plastic matrix was removed by etching in a 10%
Table 3. 1. Sample list Group Time Animal number Specimen numberb Control a 16 week 19 91 R729 8 week implantation 24 91R637A 9 1R637C 91R637B Experiment 12 week 16 week implantation implantation
14 34
91R724A 9 LR724C 9 LR724B 91R626A 91R626C 91R626B 24 week implantation
1, 2, & 3
9 LR712A 9L R712C 91 R7 12B 91R713A 91R713C 91R713B 91R714A 91R714C 91R714B
a Control animal (no surgery during the 16 week period) was sacrificed for comparison of normal nerve with that of nerve samples from the multiple lumen experiments.
b Specimen number A, C, or B represents a proximal, middle or distal section, respectively (A= proximal, B =distal, and C =middle). The control animal has only one site and can be compared with section from the proximal, middle, and distal locations from retrieved multiple lumen experimental cases.
To generate the electron back cattered image of the surface of the thin sections directly, the glass cover slip had to be removed from the light microscope slides. The slides were immersed in xylene until the cover lip detached from the sample slide (within 4 to 5 days). The mounting medium that had been used to adhere the cover slip onto the thin section of the slide was acrytol (a mixture composed of methyl methacrylate, residual monomers, toluene, dibutyl phthalate, and 2,6-di-tert-butyl-p-cresol).
3.2. Scanning electron microscope examination
An adhesive (a mixture of colloidal graphite and isopropanol; Energy Beam Sciences, MA) is applied to the base of the slide and the top of the sample holder to hold the slide mount to the SEM stage. To reduce sample charging in the SEM, the four edges of the glass slide are
also covered by the conductive adhesive (Von Langsdorff et al., 1990). The specimens are examined in a JEOL JSM-840 scanni.ng electron microscope equipped with a backscattered electron detector. Secondary emission imaging (SE) is done using an accelerating voltage of 15
kV, probe current of 0.05 to 0.5 nA, aperture size of 70 µm or 110 µm, and a working di tance of 37 to 39 mm. The backscattered electron image (BSE) is then obtained using the san1e accelerating voltage, probe current, aperture size, but a shorter working distance of 6 mm
to 15 mm in order to collect sufficient backscattered electron signals for optimal contra t. The
image is collected using a digital imaging sy tern that averages multiple cans in order to decrea e noise in an image. Final photographic recording uti lizes Polaroid Type 55 film.
The same specimen is also examined at l 60x or 400x magnification (l 6x or 40x by lOx Optivar) using a light microscope (Dialux 20, Leitz). Photographic images are recorded using
the accessory camera (2.5x Optivar) with Kodak technical pan film (TP 135-36).
3.3. Quantitative evaluations
Morphometric parameters for the repaired peripheral nerve include axon core diameters, axon counts, total regenerated axon area, axon cross sectional area of the regenerated strand or
micrographs) and enlarged light microscope photographs (400X or lOOOX). The results are then compared.
Measurements were performed using the method of Vej sada et al. (1985) in which the axon core diameter is obtained by measuring the longest dimension of the axon (major
axis) and the longest axon dimension perpendicular to this (minor axis), and averaging the two measurements. The measurements are scaled by a machinist ruler with the smallest cale being markings 1/64 inch apart. Measurements of the current study are reported to ±0.2 µm on the lOOOX basis [1 /1 28 inch x 25.4 mm;i nch x 103 µm;mm + t03 (magnificatio n)]. After these
measurements, every axon feature is first classified according to its staining uniformity characteristics, and then grouped into diameter classes for frequency-size distribution plots. Axon features smaller than 0 .75 µm are exc luded from measurement (less than 0.1 % of the features measured).
The diameter ratio of major axis to minor axis is calculated to investigate the shape of regenerated axons. For comparison between Daniel's measurement method (an equivalent circle diameter method) done by automated image analysi and that of the current study (an equalized ellipse method, Vejsada et al., 1985), the differences in axon diameters are calculated and the differences are reported as percent.
±500 µm2 to include uncertainty from drawing. The area examined relative to tota l area is obtained by multiplying J 00 times the ratio of the area examined divided by total area.
The a xon counts are obtained from the area examined. T he extrapolated a xon counts for the total a rea are calculated by dividing the axon counts in the area examined by the percentage of the area examined to the total area. However, there are several nerve strands in the middle section and fascicle-like units in the distal section. To investigate variances for axon counts among different strands which bridge the gap, the number of strands in the middle section , the axon counts per stra nd, and the numbe r of fascicle-like units in the dista l section, and axon counts per fascicle-like unit are evaluated. T he a xon counts per unit area (axons/µm 2) represent Lhe axon counts divided by the area examined in which axons were counted and measured. For comparisons of the two observation methods, the identical strand or the fascicle-like unit is examined by both LM and SEM and is identified by the same series number in both measurement cases.
3.4. Diam ete r frequency distribution
The diameter hi togram i obtained from the um of the axon count ranked in each diameter range ba ed on the ame taining uniformity feature characteristic. Each diameter rank contains a diameter range of 0.5 µm (within plus 0.24 µm and minus 0.25 µm). For example, the 1-µm diameter rank includes diameter between 0.75 µm and 1.24 µm. The diameter histogram is plotted as percent versus the diameter ranks. The percent in a size range is calculated by 100 time the ratio of um of the axon found in the diameter rank divided by the total number of axons examined. Diameter frequency distributions for the proximal, middle and di tal ection of each animal are the n compared. To further examine the grouping characteristic, the sum of the percent in a size range of 2 µm (with plus and minu 1 µm of diameter rank in which the mean axon diameter i located) i also characterized.
3.5. Statistical methods
The Tukey method of multiple compari ons is applied. If all factor level ample izes are the ame, the Tukey method is exact. On the other hand, a modified Tukey-Kran1er method uitable for unequal ample ize . . Thi wa u ed in thi tudy. Variable name are et for compari on. The e include evaluation methods (SEM and LM), animal group (experimental and the normal control), implant periods (8, 12, 16 and 24 weeks), animal number, locations of the ections (proximal, middle and di tal ections) and stain uniformity characteri tics (category I, uniformly stained, and category If, nonuniformly stained). These tests are based on the a umption that there is no significant difference between the means obtained from pairs of factor levels such as SEM versus LM. The analysis is generated at the 0.05 level of
4. RESULTS
4.1. Microstructure
4.1.1. Scanning electron microscope studies
The BSE image emphasizes the composition contrast. Because Bodian's silver stain is specific to axons and silver has a relatively high atomic number atom, contra t for silver is relatively high in BSE imaging of regenerated axons compared with that for the low atomic number atoms of the surrounding tissue matrix. According to their appearance, regenerated axon features can be divided into two categories. Category I axons display unifo1m staining for axon features. Category II axons appear nonuniform in their staining for axon feature .
An example of normal adult rat axons is shown in Figure 4.1. These axons have a clearly defined cross section surrounded by a myelin sheath. Blood capillaries are present in the perineurium connective tissue matrix. Only a few blood capillaries are inside the fascicles. The shape of every fascicle appears as a flattened oval. After the nerve is transected and is then repaired utilizing a multiple lumen cuff, these general normal nerve structural characteristic. are absent. Examples from multiple lumen experiments of sections from the proximal, middle, and distal ections are shown in Figures 4.2A, B, and C for animal 3.
4.1.1.1. Proximal section
capi llarie appear in ide the endoneurial connective ti sue matrix and among the outer perineurium connective ti ue matrix. With time, more perineurium invade the endoneurial connective tissue matrix to form fascicle of nerve; however, the mean diameter of axon tiJI smaller than that of normal axons of the control.
4.1.1.2.
Middle sectionBecau e of the seven lumen multiple lumen nerve cuff design, one to even trand of nerve bundles are een for a repafr. The round hape of a strand is different from the flattened oval hape of the normal fa cicles. If nerve cuff are implanted and filled with aline . elution at the time of implantation, the regenerated nerve strand number appear to be higher compared with multiple lumen cuffs used with empty lumen at the time of implantation. There are 5, 6, or 7 regenerated strands in nerve cuffs implanted and prefilled with saline solution (at 16 weeks post-implantation) compared to 2, 5, or 6 regenerated trands of multiple lumen cuffs implanted empty (at 24 weeks post-implantation).
A regenerated strand has two prominent zone (shown in Figure 4.2B). The central zone is mainly filled by category I axons, category II axon , blood capillarie , endoneurial connective ti ue matrix, and invading perineurial cells. The ·e neural elements form a fa cicular regeneration unit. The peripheral zone primarily contains numerou di persed blood capillaries and collagenous connective tis ue (epineurial, perineurial, or perineurial-like cells). It is organized into concentric layers. Squamous cell layers line the periphery, occupying a large fraction of the total strand cross section. This zone contain. more collagen matrix between each !ayer than the control.
neuron axon (A) has a clearly defined fiber area containjng a myelin sheath (M), struned gray, and the bright whjte axon. Normal control animal #19.
(2A) Proximal, (2B) mjddle, and (2C) di tal ections. Bodian tain. Scale bar = l 0 µm
A) Category I, uniformly stained axon feature (U), and category II, non-uniformly stained axon feature (P). Mean diameter= 3.4
±
1.9 µm-wn
01
-wn
OI
There is more collagen and endoneurial matrix surrounding regenerated neural elements in animal #2 (no saline prefill) compared with that for the section from animal# 14 (saline prefill). The cuffs implanted with a saline prefill (animal #14) appear to exhibit better organization of the axons features of the middle region than the cuffs implanted with empty cuff lumen. (3A) Animal #2, 24 weeks
-wri
OI
24 weeks post-implantation, no saline prefill, Bodian Stain. (4B) Animal #14, distal section, 16 weeks post-implantation, with saline prefill. Bodian
-wri
OI
-wri
OI
organization (Figure 4.3B) of the axon features of the middle region than the cuffs implanted with empty cuff lumens (Figure 4.3A).
4.1.1.3. Distal section
Like the morphology seen for regenerated nerve strands in the middle section, every nerve bundle that crosses the gap and enters the distal stump maintains two zones: a central zone which includes neural elements and a peripheral zone which contains a connective tissue matrix (Figure 4.2C). The cuff specimens retrieved from saline prefill experiments show a clearly defined perineurial border between each regenerated fascicle or fascicle-like unit (16 week case) compared to a relatively poorly defined connective tissue perineurial border in specimens for which no saline prefill was used (24 weeks post-implantation period case). There are larger blood vessels and fascicular units in specimens implanted with saline in the lumens compared with those implanted with empty lumens (Figure 4.4A and B).
4.1.2. Light microscope studies
The patterns observed in light microscopy (LM) are similar to those results obtained from the backscattered electron image (BSE). In addition, it is as easy to identify axons in LM as it is in BSE images due to the Bodian's silver stain being specific to axons. However, BSE images have a supe1ior contrast range compared to the light microscope pattern.
4.2. Fiber diameter frequency distribution
certain proximal, middle and distal sections is plotted as a single diameter frequency distribution for either LM or SEM. In the SEM study, category I and category II plots represent uniformly stained axon features and non-uniformly stained axon features, respectively.
For the normal control animal, there is a broad, flat distribution covering the size range of 1.0 µm to 11.0 µm (LM result). In BSE cases, category I distributions indicate a broad diameter range from l µm to 8.5 µm, and category II distributions are somewhat broader (from 1.5 µm to 9.5 µm). The frequency distribution of the combinations of axons from the two categories also occurs with a broad diameter range (between 1.0 and 9.5 µm).
4.2.1. 8 weeks post-implantation (animal #34)
In LM, the mode of the middle section peaks at 3.5 µm but that of the distal section peaks at 4.0 µm. SEM studies indicate that category I axons have axon distribution peak ranges of 3.0 to 5.5 µm (proximal), 2.5 to 4.0 µm (middle), and 3.0 to 4.5 µm (distal). Category II axons of the middle and distal sections peak within a 1.5 to 3.0 µm size range. About 90% of axon diameters of the proximal section are grouped within a size range of 1.5 to 3.5 µm including a sharp peak at 2.0 µm. Combined data for category I and II axons shifts the distribution toward somewhat larger diameter sizes.
4.2.2. 12 weeks post-implantation (animal # 24)
from 1.0 to 3.5 µm and contains over 80% of the axons examined for this section; and the distal distribution has a larger diameter range (2.0 to 6,0 µm), with about 90% of the axons occurring within in this range. For category II axons, over of 90% of the proximal distribution are grouped into a small diameter range from 1.0 to 3.0 µm with over 85% of the middle section axons appearing within the same diameter range as for category I middle section axons. There is no category II axon count available for the distal section for this animal. This combination of category I and category II axons shows that 90% of the axons either in the proximal or in the middle section are sized between 1.0 and 3.0 µm. The distal spectrum of total axons (SEM) is the same as that of the category I axons.
4.2.3.
16 weeks post-implantation (animal
#14)
LM results show that the proximal distribution peaks between 1.5 and 3.5 µm and about 90% of the middle distribution are grouped between l.O and 3.5 µm. For category I axons, the proximal distribution peaks between 1.5 and 4.0 µm, with a mode at 3.0 µm. In the middle section, about 90% of the axons are found to be between 1.0 and 4.0 µm. The distal distribution is broad and ranges from 1.0 to 4.5 µm. For the category II axons, the proximal axons usually have a size between 1.0 and 2.5 µm. In the middle section, the principle distribution occurs between 1.0 and 2.0 µm. Approximately 90% of the axons of the distal section group between the 1.0 and 2.5 µm size range.
4.2.4.
24 weeks post-implantation (animals #1, #2 and #3)
diameters are grouped within the l .5µm to 4.0 µm range. The middle section axons have their mode at 3.0 µm. The distal axons are primarily between 2.0 and 4.0 µm. For category II axons, the data are more skewed with modes at 2.5 µm (proximal), 1.5 µm (middle) and 1.0 µm (distal). Eighty percent of the diameters of the combination of category I and II axons are located between 1.0 and 3.0 µm with a 2.0 µm mode (proximal), between 1.5 and 4.0 µm
with a 2.0 µm mode (middle), and between 2.0 and 4.0 µm with a peak at 3.0 µm (distal). LM data for animal 2 are imilar to those seen for animal 1. The most frequent (approximately 80%) sizes are within the 1.0 and 3.0 µm range (proximal), 1.0 and 4.0 µm range (middle), and 1.0 and 3.5 µm range (distal). Category I axons exhibit their principle
frequencies for the proximal, middle and distal sections between 1.5 and 3.5 µm, between 1.0 to 4.0 µm, and between 1.0 and 3.5 µm, respectively. For category JI axons, peaks occur at 2.0 (proximal), 2.0 (middle) and 1.5 (di cal) µm. For the total axon diameter distribution
(combination of category I and II axons), the spectra are similar to those of category II.
LM data for animal 3 show a sharp peak (40%; proxi mal) located at 2.0 µm. The
mjddle and distal di tributions are grouped between 1.5 µm and 3.5 µm and between 1.0 and 2.5 µm, respectively. In the frequency spectrum for category I axons, distributions have modes at 3.0 (proximal), 2.0 (middle), and 1.5 µm (distal). Compared to category II axons, more frequencies group among the smaller diameter range, between 1.0 and 3.0 µm, for all
section . For the total axonal diameter di tribution, the proximal ection has a mode at 3.0 µm, the middle section has a platykurtic peak curve between 1.5 and 2.5 µm, and the distal ection has a 1.5 µm mode.
4.3. Quantitative results
percentage of area examined to the total related axon area, axon counts for area examined, axon counts per unit area (#/µm2), mean axon diameter (with standard deviation) for area examined,
and extrapolated axon counts based on totaJ area. According to the methods of the studies and the uniformity of the staining, the tables are shown in the following order. LM results (Tables 4.1, 4.2, and 4.3), total axons results from SEM studies (Tables 4.4, 4.5, and 4.6), category I
axon results from SEM (Tables 4.7, 4.8, and 4.9), and category II axon results from SEM (Tables 4.10, 4.11, and 4.12). For each group, the tables present information for proximal, middle, and distal locations. Because of the multiple lumen cuff design, the "number of
strands" that occurred in the middle section and the results for each strand are also included in the appropriate table. One to seven fascicle-like units occured in the distal section. Tills was determined in association with the one to seven strands that crossed the gap and entered the
distal section. The individual fascicle-like unit series number does not correlate directly with position from the middle section data for these tabulations. On the other hand, the series number shown on the LM result tables is the same as that listed on the SEM result tables of the
same section for comparison.
All axon mean diameters determined for the experimental animals (except the category I axon mean diameter of the proximal section of animal 34, 8 weeks implantation) are always
smaller than that of the normal control animal. Axon counts per unit area obtained from examined area for an experimental animal usually indicate a larger density than that for the normal control animal. Axon counts per unit area of category I axons are usually higher than
those of category II axons in the same area examined. Although strand-to-strand or fascicle-like unit to unit variations are indicated by comparisons, they are not significant. Extrapolated axon counts (based on total axon area) of each (available) section point out that the number in the proximal section is much higher than that of the middle section or the distal section. There a.re
Table 4.13, Table 4.14, Table 4. I 5 and Table 4. I 6 list the percentage of the distribution of axons within
±
1 µm of the mean diameter for axons of the LM, category I, category II and total axons counted in a BSE image. Over 60% of the axon frequency pectra group within±
1 µm of the mean diameter range seen for axons of these experimental animals. By contrast, the axon distribution percentage for the normal control animal is lower (45%).Based on the equalized ellipse method, Table 4.17, Table 4.1 8, Table 4.19 and Table 4.20 show the major-to-minor axis ratios with standard deviations which are calculated for ratios of the major axis to the minor axis. The major axis is usually at least 1.4 times larger than the minor axis. Note that, the diameter ratio obtained from the normal animal is much higher than regenerated axons. In addition, there are differences between the equivalent circle diameter method and the equalized ellipse method. Based on the ame samples, the diameter differences are 2% to 10% larger when calculated by the equalized ellipse method.
The comparisons are tested at significance level (a ) 0.05. If the probability (P) of
accepting the hypothesi (there is no difference between a pair of axon diameter means) is less than the
a
chosen, the null hypothesis would be rejected. This is indicated by *** and the specific probability in the analysis appears in the table. Otherwise, a * is indicated for acceptingdiameter of category I axons is always larger than that of category II axons. In Table 4.27, result are provided for mean diameter compatisons of the same category of axons but between different examined locations of the same animal (SEM). Data listings in Table 4.28 indicate that mean diameters in the proximal section show significantly larger diameters than those in
strands in the middle sections of the same animal (SEM). [n addition, there is also no significant difference in axon counts per unit area between salined prefill cases (16 weeks) and
the non-saline prefill ca es (24 weeks) for the ame section. However, there are larger mean strand cross section areas shown at middle sections for aline prefill cases ( 16 weeks)
based on total area in the proximal section observed by LM
Area Axon Axon Mean Axon Extrapolated
Implant Animal Area Total Examined Count Counts Diameter for Arca Axon Counts
Period & Number Examined Arcaa Relative to for Area Per Unit Examined & Based on
Group ( µm2 ) (µm2) Total Area Examined Areab Standard Deviation Total Arca
( % ) ( #) (#I µm2) ( µm) ( #)
24 Weeks
Multi ple Lumen 286000 7 13000 40% 7296 0.026 2.5 ± 1.3 18240
24 Weeks
Multiple Lumen 2 294000 1204000 24% 4800 0.016 2.4 ± I. I 20000
24 Weeks
Multiple Lumen 3 295500 687000 43% 4020 0.014 3.4 ± 1.9 9349
16 Weeks ~ -..)
Multiple Lumen 14 276500 975000 28% 6020 0.022 3. 1 ± 1.5 2 1500
12 Weeks
Multiple Lumen 24 186500 200000 93% 5230 0.028 2. 1 ±0.8 5624
8 Weeks
Multiple Lumen 34 1146500
16 Weeksc
Normal Control 19 150000 165500 91 % 1836 0.0 12 4.4 ± 2.1 20 18
a Total area is obtained from the total axon area of the proximal section.
b The axon counts per unit area are obtained from axon counts for area examined divided by the area examined. c There is no surgery performed in lhe normal control animal but it was sacrificed for comparison with animals of the
based on total area in the middle section observed by LM
Total Area Axon Axon Mean Axon Extrapolated
Implant Animal Number St.rand Area Total Examined Counts Counts Diameter for Area Axon Counts
Period & Number of Strands Series Examined Areac Relative to for Area Per Unit Examined & Based on
Group Occurred Numberb ( µm2 ) ( µm2) Total Arca Examined Aread Standard Deviation Total Area
in Section ( % ) ( #) (#/ µm2) ( µm ) ( #)
24 Weeks
Multiple Lumen 2 8500 17000 50% 202 0.024 2.0 ± 0.8 404
- -
24 Weeks I 31500 37000 85%304 0.0 10 3.0 ± 1.4 358
Multiple Lumen 2 5a 2 30000 30000 100% 407 0.014 407
3 17500 17500 100% 337 0.019 337
24 Weeks I 7500 7500 100% 208 0.028 208
3 ~
Multiple Lumen 5 2 17500 19000 92% 588 0.034 2.4 ± 0.8 639 00
3 12000 12000 100% 137 0.011 137
16 Weeks 13500 13500 100% 435 0.032 435
Multiple Lumen 14 7 2 23000 23000 100% 27 1 0.012 27 1
3 18500 18500 100% 432 0.023 432
4 10500 10500 100% 303 0.029 303
5 17500 18000 98% 866 0.049 1.9 ± 0.8 892
6 15000 15000 100% 374 0.025 374
7 15000 15000 100% 393 0.026 393
a There are five bridging strands inside and a sixth proximal strand extends half way across cuff.
b Becau e ome artifacts are on this portion of the ample, part of the trand information might not be available. c Total area is obtained from the total axon area of a strand examined in the ection.
[image:56.773.76.687.119.401.2]Total Area Axon Axon Mean Axon Extrapolated
Implant Animal Number Strand Area Total Exan1ined Counts Counts Diameter for Area Axon Counts
Period & Number of Strands Series ExaTilined Areac Relative to for Area Per Unit Examined & Based on
Group Occurred umber!> (µm2) ( µm2) Total Area Examined Aread Standard Deviation Total Area
in Section ( % ) ( #) (#/ µm2 ) ( µm ) ( #)
12 Weeks 33500 33500 100% 355 0.0 11 355
Multiple Lumen 24 7 2 20500 22000 9 1% 484 0.024 2.6 ± 1.3 532
3 22000 22000 100% 115 0.005 11 5
4 12000 12000 100% 250 0.02 1 250
5 13500 13500 100% 63 0.005 63
6 33500 33500 100% 180 0.005 180
7 19000 19000 100% 266 0.014 266
8 Weeks
Multiple Lumen 34 40000 4 1500 96% 632 0.016 3.6 ± 1.3 658
16 week .p. \0
Normal Conlrole 19 2r 150000 165500 91 % 1836 0.0 12 4.4 ± 2. 1 20 18
b Becau e ome artifacts are on thi portion of the ample, part of strand information might not be available. c Total area is obtained from the total axon area of a strand examined in the ection.
d Axon counts per unit area are obtained from axon count for the area examined divided by the area examined. e There i no surgery performed in the normal control animal, but it was acrificed for comparison with animals of the
experiment .
based on total area in the distal section observed by LM
Total Total Fascicle- Area Axon Axon Mean Axon Extrapolated
Implant Animal Number Number of like Unit Area Total Examined Counts Counts Diameter for Area Axon Counts
Period & Number of Strands Fa~cicle- Series Examined Areab Relative to for Area Per Unit Examined & Based on
Group Occurred in like Unit in Numbe~ ( µm2) ( µm2 ) Total Area Examined Areac Standard Deviation Total Arca
Middle Distal ( % ) ( #) (#I µm2) ( µm ) ( #)
24 Weeks
Multiple 2 2 I 9000 9000 100% 137 0.0 15 137
Lumen 2 15000 19000 79% 24 1 0.0 16 2.5 ± 1.5 305
24 Weeks I 27000 27000 100% 292 0.0 11 292
Multiple 2 5 6 2 24000 24000 100% 71 0.003 71
Lumen 3 43000 43000 85% 728 0.020 2.3 ± I. I 856
4 35000 35000 100% 179 0.005 179 Vl 0
5 4000 4000 100% 78 0.020 78
6 24000 24000 100% 137 0.006 137
24 Weeks I 43000 43000 100% 3 12 0.007 312
Multiple 3 5 5 2 13000 13000 100% 70 0.005 70
Lumen 3 22000 22000 100% 5 10 0.023 510
4 9000 9000 100% 69 0.008 69
5 29000 29000 100% 704 0.024 2.0 ± 0.9 704
16 Weeks
Multiple 14 7 287000
Lumen
a The individual fascicle-like unit eries number does not correlate directl y from the middle po ition to the di tal po ition. b Total area i obtained from the axon area of a fa cicle-like unit examined in the di tal ection.
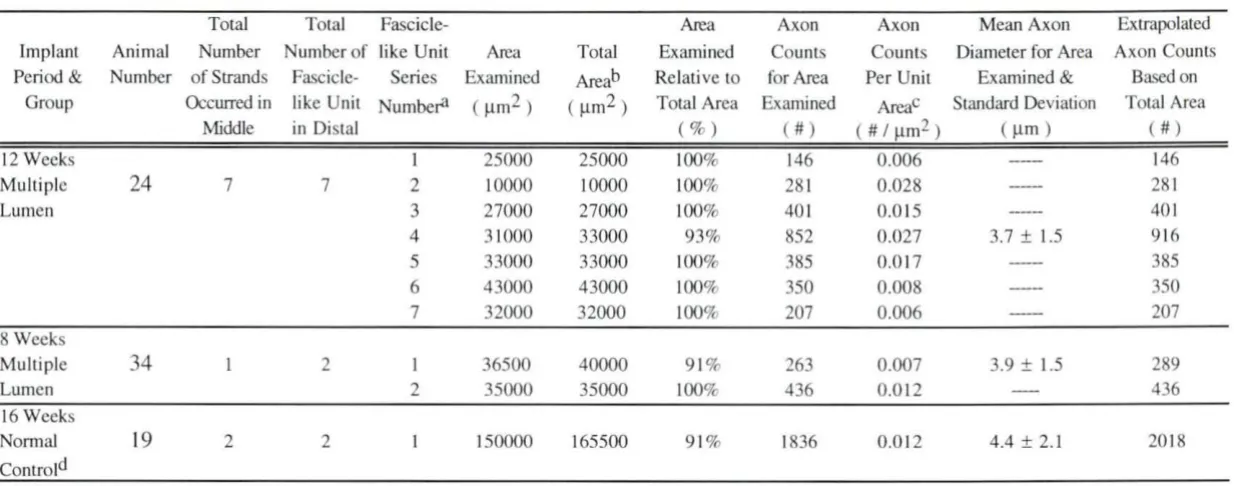
[image:58.773.77.687.119.427.2]Total Total Fascicle- Area Axon Axon Mean Axon Extrapolated
Implant Animal Number Number of like Unit Arca Total Examined Counts Counts Diameter for Area Axon Counts
Period & Number of Strands Fascicle- Series Examined Areab Relati ve to for Arca Per Unit Examined & Based on
Group Occurred in like Unit Numbe~ ( µm2) (µm2) Total Arca Examined AreaC Standard Deviation Total Arca
Middle in Distal ( % ) ( # ) ( #/µm2) ( µm) ( #)
12 Weeks I 25000 25000 100% 146 0.006 146
Multiple 24 7 7 2 10000 10000 100% 28 1 0.028 281
Lumen 3 27000 27000 100% 40 1 0.0 15 401
4 3 1000 33000 93% 852 0.027 3.7 ± 1.5 9 16
5 33000 33000 100% 385 0.0 17 385
6 43000 43000 100% 350 0.008 350
7 32000 32000 100% 207 0.006 207
8 Weeks
Multiple 34 2 I 36500 40000 9 1% 263 0.007 3.9 ± 1.5 289
Lumen 2 35000 35000 100% 436 0.0 12 436 U\
16 Weeks
Nom1al 19 2 2 150000 165500 91 % 1836 0.0 12 4.4 ± 2. 1 20 18
Controld
a The individual fascicle-like unit serie number does not correlate directly from the middle po ition to the di tal position. b Total area is obtai ned from the the axon area of a fa cicle-like unit exami ned in the distal section.
c Axon counts per unit area are obtained from axon counts for the area examined divided by the area examined. d There i no surgery perfolllled in the nollllal control animal but it wa sacri ficed for comparison with animals of the
[image:59.773.77.694.85.328.2]