Evaluation of Structural Integrity Through Dynamic Characteristics
Miguel GENOVESE, Jos6 L. V. de BRITO, Graciela DOZ
Departamento de Engenharia Civil e Ambiental - Universidade de Brasilia, Brazil ABSTRACT
Among common problems related to the study of structures, the determination of their integrity stands out as an important way to evaluate if structures are in condition to support their applied loads. Among the several types of tests to locate and quantify structural damages, there is the dynamic test that allows us to determine mode shapes and natural frequencies of vibration in structures, as well as their damping. From the analysis of those dynamic characteristics with the assistance of specific methods, it is possible to determine the location and the severity of the damage.
With this purpose, a method that utilizes the dynamic characteristics of structures to locate and to quantify the existing damage is presented in this work. Numeric simulations were accomplished in a beam, considering the damage as a reduction in the geometric properties of its transversal section of the damaged element. In this work the Finite Elements Method is used to model the beam with and without damage, and to obtain its mode shapes and natural frequencies. It was verified that the damage really affects the dynamic characteristics of structures, and that the presented method proved to locate and quantify it appropriately. Others methods were also tested.
INTRODUCTION
Usually during their useful lifetime structures are submitted to several types and forms of static and dynamic loads such as permanent or accidental loads, movement of people, vibration of machines, wind- introduced forces, earthquakes, impacts, fatigue, etc.
These loads, associated with corrosion phenomena, chemical attacks, carbonation, radiation, among others, can produce different types of damage, according to structure morphology and the material used in its construction.
When there is a doubt about structural integrity, it is necessary to accomplish tests in order to determine the conditions of such a structure. Damage detection techniques are divided into destructive and nondestructive.
The destructive techniques usually render the structure or model on which they are applied useless. Therefore, these techniques are restricted to research and development of new ones. Thus, they have a limited use in practical life.
The nondestructive techniques frequently consist in supplying a relatively small amount of energy, close to a suspected damage location and to examine the response of the structure. These techniques differ by virtue of the different forms and characteristics of the supplied energy.
Dynamic tests appear as an important technique, which consists in exciting the structure and measuring the vibrations that are produced. With these experimental responses, it is possible to obtain the dynamic characteristics of the structures, in other words, to determine mode shapes and natural frequencies of vibration, as well as their damping. From the analysis of these mode shapes and vibration frequencies, current structure conditions can be indirectly determined.
Because damages change the mass and the stiffness of structures, it is possible to assert that dynamic characteristics, such as mode shapes and natural frequencies, are also affected in some way, according to the location and severity of the damage.
In this work we studied the influence of damage in the dynamic characteristics of a simple structure using the Finite Elements Method. In this sense, a new formulation denominated Error Method in the Movement Equation is presented.
Other two methods existing in the literature are tested and compared in this study. One of them was proposed by Pandey et al [1] and is known as "Damage Detection from Changes in Curvature Mode Shapes". The other method consists of locating damage using indexes such as the Modal Assurance Criterion MAC [2] and Coordinate Modal Assurance Criterion COMAC [3].
SMiRT 16, Washington DC, August 2001 Paper # 1578
T H E P R O B L E M
If the structure does not present any damage, the equation that governs the undamped free vibration movement is given by:
K t b - A M ~ = 0 where:
K: stiffness matrix of undamaged structure, M" mass matrix of undamaged structure,
~ : matrix containing in each column the vibration mode shape of undamaged structure, and A: diagonal matrix of square the vibration frequencies, corresponding to the undamaged structure.
(1)
The damage in a structure can happen modifying its geometric and physical properties. In this case Equation (1) it is not valid anymore, and should be replaced by the following equation that governs the new movement:
K ' ¢P' - A ' M ' ~ ' = 0 where:
K': stif~ess matrix of damaged structure, M': mass matrix of damaged structure,
~ ' : matrix containing in each column the vibration mode shape ( ~b; ) of the damaged structure, and A': diagonal matrix of square the vibration frequencies ((o': j ), corresponding to the damaged structure.
(2)
The known data are the natural frequencies and mode shapes ( , ' , A') usually obtained from dynamic tests, and the unknown are the mass and stiffness of structure (M', K').
The number of lines and columns in Equation (2) depend on the number of elements adopted, in other words, depend on the degrees of freedom that structure possesses. Both systems from Equation (1) and (2) have the same degrees of freedom, which are usually hundreds or even thousands in some cases, depending on the analyzed structure.
It is important to notice that the responses given by the structure (output) in the dynamic tests are its mode shapes and vibration frequencies. These characteristics are measured experimentally, which shows us that in practice it is impossible to acquire all mode shapes and natural frequencies of vibration. This crucial point makes this problem an indeterminate one.
P R O P O S E D M E T H O D
The method named Error in the Equation of Movement proposed by Genovese [4], or more shortly called Error Method, consists of two stages. The first stage tries to locate the damage and the second stage tries to quantify it since it has already been located.
First we focus on the movement Equation (1) of a structure without any damage in free vibration. This means that we know all about its geometric and physical properties as well as its boundary conditions.
When the structure is damaged, its mass and stiffness are altered due to the damage. As a consequence of those alterations in mass and stif~ess, the responses of the structure are also modified, in other words, its mode shapes and natural vibration frequencies change. The balance Equation (1) changes into a new one, like Equation (2).
Adams et al [5] and Heam and Testa [6] state that damage does not usually affect the mass matrix as much as it affects the stiffness matrix of the structure. Hence, we can admit that:
M ' = M (3)
Using the hypothesis that the mass matrices stay unchanged from Equation (3), Equation (2) can be rewritten as:
Looking carefully at Equations (1) and (4), it can be affirmed that both equations have similar characteristics. Equation (1) and Equation (4) can be considered as operators (K, M, K') in the subspaces ( ~ , A, ~ ' , A'). The only difference among this operators is the stiffness matrix of the structure.
The main idea of this method is to apply the operator of Equation (1) (K, M) to the subspaces from Equation (4) ( ~ ' A'). When this happens we can see an unbalance of forces, and this error (E) allows us to locate the damage, thus giving us the new Equation (5).
E = K ¢ ' - A ' M ¢ ' (5)
where
E = [e~, e2, e3 .... , en] (6)
Note that et is the error vector in the movement equation for the i- mode shape of vibration. Equation (5) for i- mode shape of vibration leads us to:
in which:
~b~" i-mode shape of vibration from damaged structure, 0)~" i-natural frequency of vibration of damaged structure.
(7)
The location of the damage is given by the greatest value of vector ei. This is the place where the unbalance of forces in the degrees of freedom of the damaged dement is bigger than those of undamaged elements.
Using the mode shapes and natural frequencies of vibration of the undamaged structure in Equation (5), the error would be zero and Equation (5) becomes Equation (1).
The damage quantification process is made through the use of an iterative procedure where p is used as a coefficient that multiplies only the stiffness matrix of the damaged element previously located.
E(p) = K"(p) ¢ ' - A ' M ¢ '
(8)
where
K " ( p ) = K intact elements "l" p K damaged element (9) or in its matrix representation
K'(p)=
(dofx doO
N_
(aof~ ao0
The value of p is between 0 and 1. Zero represents the total loss of stiffness in the dement, and 1 is obtained when the dement is not damaged at all.
The iterative process consists in setting p between 0 and 1 and drawing the norm of vector E as a function of p (norm(E) = f(p)) in order to obtain the minimum between these limits. The value of p that produces the minimum of the norm in error E represents the ratio between the stiffness of the damaged element and the original undamaged element. With this value of p the quantification of damage can be obtained.
It is worth reminding that this method works directly with the mass matrix and stiffness of the undamaged structure, as well as the natural frequencies of vibration and mode shape of damaged structures. This can represent an advantage when the real conditions of the undamaged structure are well known.
D A M A G E D E T E C T I O N F R O M CHANGES IN C U R V A T U R E M O D E SHAPES
This method for locating damage in beam structures was first presented by Pandey et al [1 ]. It is necessary to determinate, in discrete points, the curvature mode shapes of damaged and undamaged beams. The curvature can be estimated with Equation (10) below:
Yi ''= (~+1- 2 ~ + #~.l)/h 2 (10)
where yi" is the curvature from point i and ~ is the value of the mode shape in the corresponding node. The h represents a common distance between all points (i+ 1, i, i-1).
From changes in curvature mode shapes of undamaged and damaged beams it is possible to locate the damage. This idea came from the principle that the bending moments are proportional to curvature and that mode shapes produce bending moments when acting in a beam.
Note that when we work with the same nodes in both beams (damaged and undamaged) it is no longer necessary to use the h term, because when we subtract this value, the h will be only a factor that will not have any information about the damage. For this reason it is possible to use only the numerator in the second member of Equation (10). However we must note that in this case we are no longer calculating the real curvature.
MAC and C O M A C
Modal Assurance Criterion (MAC) from Allemang [2] and Modal Coordinate Assurance Criterion (COMAC) from Lieven [3] are indices that compare two sets (~b i and ~b~ ) ofmodal data.
MAC uses the relationship between two sets of mode shapes (k and j) by testing their orthogonality. This is made with the use of following equation:
t =
(11)
T ~ ~ t T t
Notice that Equation (11) produces a matrix. Its diagonal will be close to one and outside the diagonal the values will be close to zero when the two compared sets are similar or close. Depending on the position of the damage and on its severity, it will affect one of the mode shapes more than the other. This idea along with the MAC index allows us to locate, and sometimes quantify, the damage with the fore mentioned changes.
The COMAC index is similar to the MAC index but, in this case, COMAC measures the difference between the two sets of mode shapes at one point (i). The equation that allows us to estimate the COMAC index for N mode shapes is:
N
C O M A C ( i ) = N k=l N
k = l k = l
( 1 2 )
N U M E R I C A L ANALYSIS
This numerical analysis employed The Finite Elements Method, considering Timoshenko beams theory, which includes the effects of shear deformation.
The beam used in this study was a common 2.40 m long concrete beam with a rectangular cross-section of 140 x 240 mm. Table 1 shows some of its properties.
Table 1- Physical and Geometrical
M o m e n t of Inertia of Cross-sectional Area 16128 cm +
Properties of the simple supported beam
Cross-sectional Area
J
Y o u n g M o d u l u s Density336 cm2 ! 3.5E10 N/m 2 2500 kg/m 3
Four beams were studied, one undamaged beam, labeled B0, and three damaged beams, labeled B1, B2 and B3. The damages were introduced to the ninth element with the reduction of inertia moment and cross- section area as indicated in table 2.
All studied beams were modeled with 24 elements represented in Figure 1. Every node has two degree of freedom, a transversal displacement and a rotation. Static condensation was applied to eliminate the rotation degree of freedom.
damage dernent
1 ,, $ ~ i 0
. , . . .... , . . , , , . . . .
/\ J l
.,',','Jr," "-I r 1 0 0 mm 2 4 0 0 mm
mC . . . . .
,. ,-~ ,".o
T
2 5 [l~-~".?i 2413 mm, :
/ , , !.:~.,.i" °":"" ._~
,tIt¢l~f 1 4 " - ' ~ : . l
._I I_. ._I 140 mm
-i I ..... I
Figure 1" Simple supported beam model
The first five natural frequencies from damaged and undamaged beams were obtained and are presented in table 2. The results show a small reduction in the frequencies of damaged beams.
Table 2" Natural frequencies of the first five modes for the intact and the damaged beams.
N a m e s Reduction of
Inertia % Area
%
B 0 0 0.00
B 1 10 3.45
B 2 20 7.17
B 3 30 11.22
First
7(t+1 67.6 67.4 67'.1
Frequencies (Hz)
Second Third Forth Fifth
273.5 591.8 999.7 1471.0 '261.0 556.0 920.1 1328.7'
260.4 555.7 91, 8.1' ... 13272 259.6 555.4 915.5 1325.4
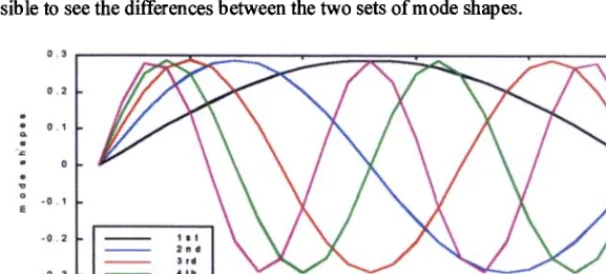
Figure 2 shows mode shapes for damaged (B 1) and undamaged (B0) beams together. Note that it is almost impossible to see the differences between the two sets of mode shapes.
0 . 3
0 2
0 1 o-
0 "o o - 0 1 E
0 2
3 r d _ 4 t h 5 t h
! ! ,
0 ~ ,'0 ,; 2o 2~
n o d e s
Figure 3 represents the alteration of the curvature of the vibration mode shapes. It is clearly noticeable that in element 9 (nodes 9 and 10) the biggest values in the graphs indicate the correct location of the damaged element.
1 0
5
0
-55 4 " i
2 5
+ '+ 2 0
5
m o d e s h a p e s I 0 n o d e s
Figure 3" Change in the curvature mode shapes method to locate damage used in a simple beam B 1.
A methodology was applied in order to obtain clearer results. It consists in multiplying point by point the values obtained ~om the curves on Figure 3. The result of this methodology, normalized with respect to the maximum value is shown in Figure 4.
1 !
~ 0 . 5 -
o 0 L,
0
0
-0.5 '10
2
O .
-1 I I
o 5 l o 20 25
Figure 4" Product of the 5 changes in curvature mode shape from Figure 3.
Figure 5 represents the COMAC index calculated for the first three mode shapes (N = 3). The damage was detected but with a small sensitivity because COMAC gets away from 1 only about 0.05 %. In this case, that small change gave this COMAC index a weak sensitivity for practical purposes.
I I I I
| | i |
| | i |
! ! - r . ~ . c -
' : l
i i i
0 15 1 0 1=5 2 0 215
r ' , , o d e :~
Figure 5: COMAC index applied to a simple beara with d ~ a g e in the 9 m element.
The diagonal of the MAC index matrix reveals that the most affected mode shapes of vibration are the forth and fifth. These mode shapes have their point of maximum displacement at the damaged location. This gives us a clue on the damage's possible location. However, the damaged element could be located at the corresponding symmetrical location on the other side of the same beam.
M A C =
0 . 9 9 9 9 9 7 2 7 2 . 3 7 4 e - 0 0 7 I. I 1 2 e - 0 0 7 3 . 8 4 6 e - 0 0 6 I. 9 6 5 e - 0 0 6
2. 3 8 4 e - 0 0 6 0. 9 9 9 9 9 6 3 9 2. 8 6 0 e - 0 0 9 3. 9 7 2 e - 0 0 7 5. 9 9 2 e - 0 0 7 3 . 2 6 4 e - 0 0 8 1 . 9 9 4 e - 0 0 7 0 . 9 9 9 9 9 8 1 7 2 . 8 7 0 e - 0 0 7 4 . 5 5 0 e - 0 0 8
2 . 2 1 9 e - 0 0 7 2 . 2 1 6 e - 0 0 6 1 . 1 9 7 e - 0 0 6 0 . 9 9 9 9 7 9 5 5 1 . 9 3 3 e - 0 0 6
3. 9 3 4 e - 0 0 8 5. 0 3 6 e - 0 0 7 2. 4 3 0 e - 0 1 2 9. 2 2 1 e - 0 0 6 0. 9 9 9 9 8 8 7 0
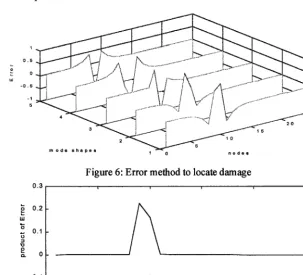
The results of the Error Method are presented in Figures 6, 7 and 8. From Figure 6, the correct location of the damage can be inferred. The graphics obtained with this method are smoother that the ones obtained with changes in curvature mode shapes.
Again, in Figure 7, the point-by-point multiplication methodology is applied to the curves obtained in Figure 6 in order to improve the results.
,_ 0 / . . . . "" - . . . " i
m o e s 1 0 n o d e s
0 . 3
Figure 6" Error method to locate damage
| | |
t - O 0 . 2 - t.. U J O
.,.. 0 . 1 -
o "1o o L Ca. 0 --
- 0 . 1
' ' ; o
0 5 10 1 2 25
Figure 7: Error method to locate damage (product of curve from Figure 6)
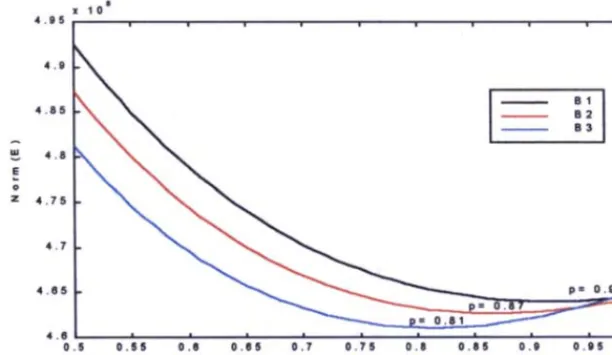
The second stage of the Error Method (quantification) for beams B 1, B2 and B3 is represented in Figure 6. Table 3 shows the results for this stage. All values obtained in the fourth column in table 3 are within the expected limits.
Table 3. Error Method Quantification
Reduction of E r r o r Method Beam
Inertia (%) Area (%) Quantification (%)
B1 1O 3.45 8
B2 20 7.17 13
B3 30 11.22 19 . ,
4 . 9 5
4 . 9
4 . 8 5
A
4 . 8
E
o
z 4 . 7 5
4 . 7
4 . 6 5
4 . 6 0 . 5
x 1 0 s |
B 1 - - - B 2 B 3
, = , , i 7 i 18 = , i 0 . 5 5 0 . 6 0 . 6 5 O . 0 . 7 5 O . 0 . 8 5 0 . 9 0 . 9 5 1
P
Figure 8: Error method to quantify damage
CONCLUSION
Damage provokes an alteration in mode shapes and natural frequencies of structures. A reduction in vibration frequencies was observed as shown in Table 2. The bigger the damage is, the bigger is the reduction in the value of the referred vibration frequencies. Depending on the position and the severity of the damage, these alterations can be very small. However, they can still be detected through damage detection methods.
All the methods reached good results. Nevertheless, MAC and COMAC appeared in this case less sensitive than the others. By means of curves obtained from changes in the curvature mode shapes, the damaged area can be observed clearly. The multiplication of the mentioned curves makes it easier to locate the damage (Fig. 4).
The Error method (Fig. 6) produced smoother curves than the change in curvature mode shapes method (Fig. 3). As in the previous case, the results were improved with the multiplication of the curves point by point (Fig. 7). Quantification through the Error method produced good results. The obtained percentage values of damage stayed within the expected limits, which are the reduction of cross-section area and the moment of inertia.
9. ACKNOWLEDGEMENTS
The authors gratefully acknowledge the financial support of CAPES and FINATEC, which made this research possible.
REFERENCES
1. Pandey, A. K., Biswas, M., Samman M., "Damage detection from changes in curvature mode shapes,"
Journal of SoundAnd Vibration, Vol. 145, No. 2, 1991, pp 321-332.
2. Allemang, R. J. and Brown, D. L., "Correlation Coefficient is Modal Vector Analysis," Proc. 1st. Int.
Modal Analysis Conference. Soc. it is Experimental Mech. Bethel, Conn, pp 110-116, 1982.
3. Lieven, N. A. J, Ewins, D. J., "Spatial Correlation of Mode Shapes, the Modal Coordinate Assurance Criterion (COMAC)," Proc, 6th. Int. Modal Analysis Conference, Soc. it is Experimental Mech. Bethel, Conn., pp 690-695, 1988.
4. Genovese, M. "Localiza~ e Quantifica~o de danos em Estruturas por meio das suas Caracteristicas Dinamicas" Master Degree, PECC, Universidade de Brasilia, UnB, 2000.
5. Adams, R.D., Cawley, P., Pye, C. J., Stone. B.J., "Vibration Technique goes Non-Destructively Assessing the Integrity of Structure", Journal Mechanical Engineering Science, Vo120, No. 2, 1978, pp 93-100. 6. Hearn, G., Testa, R. B., "Modal Analysis goes Damage Detection in Structure", Journal of Structural