InTrans Project Reports Institute for Transportation
5-2013
Improving the Accuracy and Usability of Iowa
Falling Weight Deflectometer Data
Halil Ceylan
Iowa State University, [email protected]
Kasthurirangan Gopalakrishnan
Iowa State University, [email protected]
Sunghwan Kim
Iowa State University, [email protected]
Follow this and additional works at:http://lib.dr.iastate.edu/intrans_reports Part of theCivil and Environmental Engineering Commons
This Report is brought to you for free and open access by the Institute for Transportation at Iowa State University Digital Repository. It has been accepted for inclusion in InTrans Project Reports by an authorized administrator of Iowa State University Digital Repository. For more information, please [email protected].
Recommended Citation
Ceylan, Halil; Gopalakrishnan, Kasthurirangan; and Kim, Sunghwan, "Improving the Accuracy and Usability of Iowa Falling Weight Deflectometer Data" (2013).InTrans Project Reports. 59.
Improving the Accuracy and Usability of Iowa Falling Weight
Deflectometer Data
Abstract
This study aims to improve the accuracy and usability of Iowa Falling Weight Deflectometer (FWD) data by incorporating significant enhancements into the fully-automated software system for rapid processing of the FWD data. These enhancements include: (1) refined prediction of backcalculated pavement layer modulus through deflection basin matching/optimization, (2) temperature correction of backcalculated Hot-Mix Asphalt (HMA) layer modulus, (3) computation of 1993 AASHTO design guide related effective SN (SNeff) and effective k-value (keff ), (4) computation of Iowa DOT asphalt concrete (AC) overlay design related Structural Rating (SR) and k-value (k), and (5) enhancement of user-friendliness of input and output from the software tool. A high-quality, easy-to-use backcalculation software package, referred to as, I-BACK: the Iowa Pavement Backcalculation Software, was developed to achieve the project goals and requirements. This report presents theoretical background behind the incorporated enhancements as well as guidance on the use of I-BACK developed in this study. The developed tool, I-BACK, provides more fine-tuned ANN pavement backcalculation results by implementation of deflection basin matching optimizer for conventional flexible, full-depth, rigid, and composite pavements. Implementation of this tool within Iowa DOT will facilitate accurate pavement structural evaluation and rehabilitation designs for pavement/asset management purposes. This research has also set the framework for the development of a simplified FWD deflection based HMA overlay design procedure which is one of the recommended areas for future research.
Keywords
Analysis tool, asset management, FWD, HMA, pavement, PCC
Disciplines
Civil and Environmental Engineering
Improving the Accuracy
and Usability of Iowa
Falling Weight
Deflectometer Data
Final Report
May 2013
Sponsored by
About the Institute for Transportation
The mission of the Institute for Transportation (InTrans) at Iowa State University is to develop and implement innovative methods, materials, and technologies for improving transportation efficiency, safety, reliability, and sustainability while improving the learning environment of students, faculty, and staff in transportation-related fields.
Disclaimer Notice
The contents of this report reflect the views of the authors, who are responsible for the facts and the accuracy of the information presented herein. The opinions, findings and conclusions expressed in this publication are those of the authors and not necessarily those of the sponsors.
The sponsors assume no liability for the contents or use of the information contained in this document. This report does not constitute a standard, specification, or regulation.
The sponsors do not endorse products or manufacturers. Trademarks or manufacturers’ names appear in this report only because they are considered essential to the objective of the document.
Non-Discrimination Statement
Iowa State University does not discriminate on the basis of race, color, age, religion, national origin, sexual orientation, gender identity, genetic information, sex, marital status, disability, or status as a U.S. veteran. Inquiries can be directed to the Director of Equal Opportunity and Compliance, 3280 Beardshear Hall, (515) 294-7612.
Iowa Department of Transportation Statements
Federal and state laws prohibit employment and/or public accommodation discrimination on the basis of age, color, creed, disability, gender identity, national origin, pregnancy, race, religion, sex, sexual orientation or veteran’s status. If you believe you have been discriminated against, please contact the Iowa Civil Rights Commission at 800-457-4416 or the Iowa Department of Transportation affirmative action officer. If you need accommodations because of a disability to access the Iowa Department of Transportation’s services, contact the agency’s affirmative action officer at 800-262-0003.
The preparation of this report was financed in part through funds provided by the Iowa Department of Transportation through its “Second Revised Agreement for the Management of Research Conducted by Iowa State University for the Iowa Department of Transportation” and its amendments.
Technical Report Documentation Page
1. Report No. 2. Government Accession No. 3. Recipient’s Catalog No. InTrans Project 11-415
4. Title and Subtitle 5. Report Date
Improving the Accuracy and Usability of Iowa Falling Weight Deflectometer Data May 2013
6. Performing Organization Code
7. Author(s) 8. Performing Organization Report No.
Halil Ceylan, Kasthurirangan Gopalakrishnan, and Sunghwan Kim InTrans Project 11-415
9. Performing Organization Name and Address 10. Work Unit No. (TRAIS) Institute for Transportation
Iowa State University
2711 South Loop Drive, Suite 4700 Ames, IA 50010-8664
11. Contract or Grant No.
12. Sponsoring Organization Name and Address 13. Type of Report and Period Covered Iowa Department of Transportation
800 Lincoln Way Ames, IA 50010
Federal Highway Administration U.S. Department of Transportation 1200 New Jersey Avenue SE Washington, DC 20590
Final Report
14. Sponsoring Agency Code SPR 90-00-RB04-012
15. Supplementary Notes
Visit www.intrans.iastate.edu for color PDF files of this and other research reports.
16. Abstract
This study aims to improve the accuracy and usability of Iowa Falling Weight Deflectometer (FWD) data by incorporating significant enhancements into the fully-automated software system for rapid processing of the FWD data.These enhancements include: (1) refined prediction of backcalculated pavement layer modulus through deflection basin matching/optimization, (2) temperature correction of backcalculated Hot-Mix Asphalt (HMA) layer modulus, (3) computation of 1993 AASHTO design guide related effective SN (SNeff)
and effective k-value (keff ), (4) computation of Iowa DOT asphalt concrete (AC) overlay design related Structural Rating (SR) and
k-value (k), and (5) enhancement of user-friendliness of input and output from the software tool.A high-quality, easy-to-use
backcalculation software package, referred to as, I-BACK: the Iowa Pavement Backcalculation Software, was developed to achieve the project goals and requirements. This report presents theoretical background behind the incorporated enhancements as well as guidance on the use of I-BACK developed in this study. The developed tool, I-BACK, provides more fine-tuned ANN pavement backcalculation results by implementation of deflection basin matching optimizer for conventional flexible, full-depth, rigid, and composite pavements. Implementation of this tool within Iowa DOT will facilitate accurate pavement structural evaluation and rehabilitation designs for pavement/asset management purposes. This research has also set the framework for the development of a simplified FWD deflection based HMA overlay design procedure which is one of the recommended areas for future research.
17. Key Words 18. Distribution Statement
analysis tool—asset management—FWD—HMA—pavement—PCC No restrictions.
19. Security Classification (of this report)
20. Security Classification (of this page)
21. No. of Pages 22. Price
Unclassified. Unclassified. 48 NA
I
MPROVING THE
A
CCURACY AND
U
SABILITY
OF
I
OWA
F
ALLING
W
EIGHT
D
EFLECTOMETER
D
ATA
Final Report May 2013
Principal Investigator Halil Ceylan, Associate Professor
Institute for Transportation, Iowa State University
Co-Principal Investigators
Kasthurirangan Gopalakrishnan, Research Assistant Professor Institute for Transportation, Iowa State University
Sunghwan Kim, Research Assistant Professor Institute for Transportation, Iowa State University
Authors
Halil Ceylan, Kasthurirangan Gopalakrishnan, and Sunghwan Kim
Sponsored by
Iowa Department of Transportation Federal Highway Administration
(SPR 90-00-RB04-012)
Preparation of this report was financed in part
through funds provided by the Iowa Department of Transportation through its Research Management Agreement with the
Institute for Transportation (InTrans Project 11-415)
A report from
Institute for Transportation Iowa State University 2711 South Loop Drive, Suite 4700
v
TABLE OF CONTENTS
ACKNOWLEDGMENTS ... ix
EXECUTIVE SUMMARY ... xi
INTRODUCTION ...1
Background ...1
Objective and Scope ...2
I-BACK: ENHANCEMENT FEATURES AND MODULES ...2
Deflection Basin Matching ...3
Temperature Normalization for HMA Modulus ...5
Computation of Effective Structural Number (SN) and Subgrade Support (k-value): AASHTO Pre ME-Design Approach...7
Computation of Structural Rating (SR) and Soil Support (k-value): Iowa DOT AC Overlay Design Procedure Using Road Rater Deflection Measurements ...8
I-BACK USER MANUAL ...17
Program Main Menus ...17
Pavement Analysis Menus ...19
Summary Result File...32
SUMMARY ...33
vii
LIST OF FIGURES
Figure 1. I-BACK analysis flow chart for flexible pavement ...3
Figure 2. I-BACK analysis flow chart for rigid pavement ...4
Figure 3. I-BACK analysis flow chart for composite pavement (HMA overlaid PCC pavement) .5 Figure 4. Generalized linear correlation equation with coefficients between FWD and Road Rater deflection measurements; Note. senor 1 deflection (d0), sensor 2 deflection (d12), sensor 3 deflection (d24), and sensor 4 deflection (d36) (adapted from Jones and Hanson 1991) ...9
Figure 5. Flexible pavement base relationship between SR and Road Rater D0 at 80F (adapted from Potter and Dirks 1989) ...10
Figure 6. Flexible pavement SR determination nomograph (adapted from Potter and Dirks 1989)10 Figure 7. Road Rater D0 temperature correction for flexible pavement: nomograph versus equation ...11
Figure 8. SR determination for flexible pavement: nomograph versus equation ...12
Figure 9. Rigid and composite pavement base relationship between SR and Road Rater D0 (adapted from Potter and Dirks 1989) ...13
Figure 10. SR determination for rigid and composite pavements: chart versus equation ...13
Figure 11. Flexible pavement base relationship for soil support k-value determination (adapted from Potter and Dirks 1989) ...15
Figure 12. Rigid and composite pavement base relationship for soil support k-value determination (adapted from Potter and Dirks 1989) ...15
Figure 13. k-value determination for flexible pavement: chart versus equation ...16
Figure 14. k-value determination for rigid and composite pavements: chart versus equation ...16
Figure 15. I-BACK program main menu ...18
Figure 16. ANN Information: (a) ANN Information button in main menu, (b) Screenshot of main menu on choosing ANN info show option, (c) Sample Excel sheet for ANN model information ...19
Figure 17. I-BACK pavement analyses menu for conventional flexible pavement analysis ...20
Figure 18. General information window ...22
Figure 19. Screen shot of effective PCC thickness equations sheet ...23
Figure 20. Screen shot of FWD data extraction through open FWD data file button ...24
Figure 21. Filtering the FWD data: (a) Filter options menu, (b) Filtering results (no filtered data in this example) ...25
Figure 22. ANN based preliminary backcalculation analysis: (a) Preliminary backcalculation analysis result outputs, (b) Progress report window after completing ANN based preliminary backcalculation analysis ...26
Figure 23. Deflection basin matching/optimization of backcalculation analysis: (a) Optimized backcalculation analysis result outputs, (b) Trial solution check message box ...27
Figure 24. Progress report window after completing optimization of backcalculation analysis: (a) flexible and composite pavements, (b) rigid pavement ...28
Figure 25. HMA modulus temperature correction: (a) Temperature corrected HMA modulus result outputs, (b) Progress report window after completing HMA modulus temperature correction ...29
Figure 26. Effective k-value (keff ) for rigid and composite pavements ...30
viii
Figure 28. Road Rater Based SR and k for flexible pavement ...32 Figure 29. Final Progress report window after completion of analysis ...32
LIST OF TABLES
ix ACKNOWLEDGMENTS
The authors would like to thank the Iowa Department of Transportation (DOT) for sponsoring this research and the Federal Highway Administration for state planning and research (SPR) funds used for this project.
EXECUTIVE SUMMARY
Highway agencies periodically evaluate the structural condition of roads as part of their routine maintenance and rehabilitation activities. The falling-weight deflectometer (FWD) test measures road surface deflections resulting from an applied impulse loading, simulative of a truck passing on the highway. The measured surface deflections are utilized to determine pavement layer stiffnesses through a backcalculation type structural analysis.
Although the Iowa Department of Transportation (DOT) has been collecting the FWD data on a regular basis, the pavement layer moduli backcalculation techniques used so far have been cumbersome and time consuming. More efficient and faster methods in FWD test data analysis were deemed necessary for routine analysis.
Previous Iowa DOT research projects focused on developing advanced pavement layer moduli backcalculation models using the artificial neural networks (ANN) methodology. The developed models were successfully validated using field data and incorporated into a Microsoft Excel spreadsheet-based backcalculation software toolbox with a user-friendly interface.
This study was undertaken with the objectives of improving the accuracy and usability of Iowa FWD data and the pavement inverse analysis tools. Based on the requirements by the technical advisory committee (TAC) members representing potential users of the developed
backcalculation software system at the Iowa DOT, significant enhancements were incorporated into the fully-automated software system for rapid processing of the FWD data.
These enhancements include the following:
Refined prediction of pavement layer modulus through deflection basin matching/optimization
Temperature correction of HMA layer modulus
Computation of 1993 AASHTO design guide-based effective structural number (SNeff)
and effective k-value (keff)
Computation of Iowa DOT asphalt concrete (AC) overlay design-based structural rating (SR) and k-value (k)
Enhancement of user-friendliness of input and output from the software tool
A high-quality, easy-to-use, backcalculation software package called Iowa Pavement
Backcalculation (I-BACK) software was developed to achieve the project goals and yielded the following highlighted benefits:
Provides temperature normalized/corrected hot-mix asphalt (HMA) layer modulus at a standard reference temperature for conventional flexible, full-depth and composite pavements
Provides effective SNeff and the effective k-value (keff ) as final outputs for pavement/asset management purposes
Provides SR and k-value (k) as final outputs to make FWD deflection measurements suitable for use in the existing Iowa DOT AC overlay design procedure
Produces separate smaller-sized output files from backcalculation analysis
1 INTRODUCTION
Background
Evaluating the structural condition of existing, in-service pavements is part of the routine maintenance and rehabilitation activities undertaken by the most Departments of Transportation (DOTs). In the field, the pavement deflection profiles (or basins) gathered from the
nondestructive Falling Weight Deflectometer (FWD) test data are typically used to evaluate pavement structural condition. FWD testing is often preferred over destructive testing methods because it is faster than destructive tests and does not entail the removal of pavement materials. This kind of evaluation requires the use of backcalculation type structural analysis to determine pavement layer stiffnesses and further estimate pavement remaining life. Although the Office of Special Investigations at Iowa Department of Transportation (DOT) has collected the FWD data on regular basis, the pavement layer moduli backcalculation techniques used so far have been cumbersome and time consuming. Thus, there was a need for more efficient and faster methods.
In a previous Iowa DOT project entitled, “Nondestructive Evaluation of Iowa
Pavements-Phase I,” advanced backcalculation models were developed using the Artificial Neural Networks (ANN) methodology (Ceylan et al. 2007). These ANN models are capable of predicting
pavement layer stiffnesses as well as pavement critical responses (forward modeling) fully based on FWD test results and pavement layer thickness information. For the three pavement types, over 300 models in total were developed for varying input parameters. The primary pavement types considered were flexible (conventional and full-depth), rigid, and composite.
Predicted flexible pavement parameters were, EAC-modulus of hot-mix asphalt (HMA) or asphalt
concrete (AC), Kb-base modulus parameter, ERi-subgrade resilient modulus, εAC-tensile strain at
the bottom of asphalt layer, εSG-compressive strain at the top of subgrade, and σD-subgrade
deviator stress. For rigid pavements, EPCC-modulus of portland cement concrete (PCC), ks
-coefficient of subgrade reaction, σPCC-tensile stress at the bottom of the PCC layer, and radius of
relative stiffness (RRS) were predicted. In the case of composite pavements (CPs), where an HMA/AC surface is overlaid on top of an existing PCC pavement, EAC, EPCC, ks, σPCC (tensile
stress at the bottom of the PCC), and εAC were predicted.
The developed methodology was successfully verified using results from long-term pavement performance (LTPP) FWD test results, as well as Iowa DOT FWD field data. All successfully developed ANN models were incorporated into a Microsoft Excel spreadsheet-based
backcalculation software toolbox with a user-friendly interface. The phase I study also concluded that the developed nondestructive pavement evaluation methodology for analyzing the FWD deflection data would be adopted by Iowa DOT pavement and material engineers and
technicians, who do not employ any preferable FWD backcalculation analysis technique.
A follow-up Phase II study of Iowa DOT Project (Ceylan et al. 2009) focused on the
2
developed during the phase I study. This system smoothly integrates the FWD data analysis algorithms and the computer program being used to collect the pavement deflection data. With the implementation of the developed software system the FWD data can be filtered, processed and analyzed on-the-fly.
Objective and Scope
The objective of this study is to incorporate significant enhancements into the developed fully-automated software system for rapid processing of the FWD data. Based on the requirements by the Technical Advisory Committee (TAC) members and engineers who will be using the
program on a routine basis, the following enhancements were incorporated into the fully-automated software system, referred to as I-BACK: the Iowa Pavement Backcalculation Software:
Deflection basin matching: After predicting the pavement layer modulus based on ANN models, adjust them to match the input deflection basin
Temperature normalization/correction of HMA layer modulus
Computation of overall pavement section effective Structural Number (SNeff) and
subgrade support (keff) following 1993 AASHTO design guide based procedures
Computation of Structural Rating (SR) and soil support (k) following Iowa DOT Road Rater based AC Overlay Design Procedure
Enhancement of user-friendliness of input and output from the software
I-BACK: ENHANCEMENT FEATURES AND MODULES
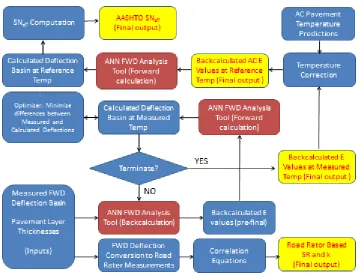
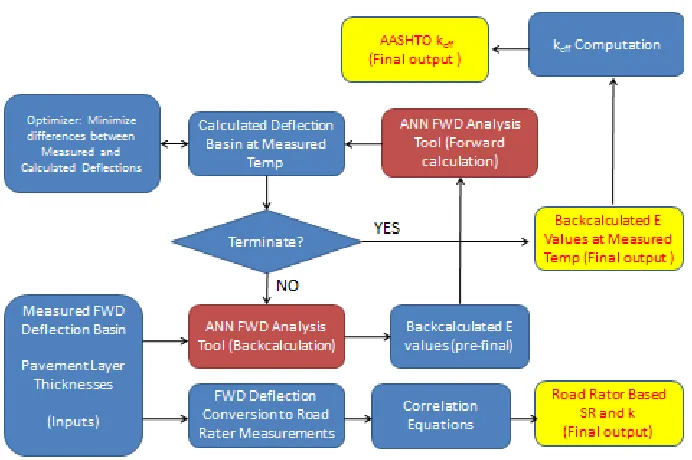
The I-BACK analysis flow charts are depicted in Figure 1 for flexible pavements (conventional HMA and full depth HMA pavements), Figure 2 for rigid pavements (PCC surface pavements), and Figure 3 for composite pavements (HMA overlaid PCC pavements).
As a first step in the I-BACK analysis, the pre-final pavement layer moduli are calculated from ANN backcalculation models (Ceylan et al. 2007, Ceylan eat al. 2009). Then, the pre-final pavement layer moduli are adjusted through a deflection basin optimizer in I-BACK to match the actual measured FWD deflection basin. Note that the backcalculated moduli resulting from deflection basin optimization in I-BACK are moduli at pavement temperature at the time of FWD testing.
In the case of flexible pavement analysis, the temperature normalization routine is then invoked to correct the adjusted HMA moduli from optimizer to a standard reference temperature.
The SNeff values are computed for conventional flexible and full-depth pavements in accordance
3
utilized to compute the overall section SNeff for flexible pavements in accordance with the 1993
AASHTO pavement design procedure (AASHTO 1993).
For rigid pavement analysis, the adjusted subgrade stiffness values from the deflection basin optimizer are utilized to compute effective subgrade support (keff) in accordance with the 1993 AASHTO design procedure (AASHTO 1993).
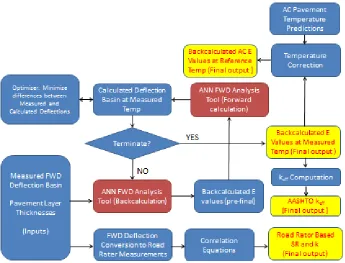
For composite pavement (HMA overlaid PCC pavements) analysis, the adjusted HMA moduli from the deflection basin optimizer are corrected to a standard reference temperature through temperature normalization routine similar to flexible pavement analysis. Similar to rigid
pavement analysis, the adjusted subgrade stiffness values from the deflection basin optimizer are utilized to compute keff values in accordance with the 1993 AASHTO design procedure
(AASHTO 1993).
[image:19.612.130.487.319.595.2]The SR and k values are also computed for all three types of pavement in accordance with Iowa DOT Road Rater based AC overlay design procedure.
Figure 1. I-BACK analysis flow chart for flexible pavement
Deflection Basin Matching
Deflection basin matching provides a fool-proof method to validate the ANN-based
4
models to predict the deflection basin and compare how closely the predicted deflection basin matches the measured deflection basin. The differences between the field measured and
predicted deflection basins are minimized by adapting the in-built Excel Solver tool (employing evolutionary optimization or GRG Nonlinear optimization) in I-BACK. Thus, the robustness of I-BACK predictions has been greatly improved by incorporating the deflection basin
[image:20.612.137.483.190.420.2]matching/optimization routine.
5
Figure 3. I-BACK analysis flow chart for composite pavement (HMA overlaid PCC pavement)
Temperature Normalization for HMA Modulus
The stiffness, or modulus, of HMA is very temperature-sensitive. The temperature normalization routine was incorporated into I-BACK in close consultation with the TAC in order to correct the backcalculated HMA moduli to a standard reference temperature for the section being analyzed. The incorporated temperature normalization routine consists of: (1) HMA pavement temperature estimation and (2) temperature correction algorithm for HMA modulus.
Prediction of HMA Pavement Temperature
6
𝑇𝑑= 0.95 + 0.892 × 𝐼𝑅 + {𝑙𝑜𝑔(𝑑) − 1.25}{−0.448 × 𝐼𝑅 + 0.621 ∗ (1𝑑𝑎𝑦) + 1.83 × 𝑠𝑖𝑛(ℎ𝑟18−
15.5)} + 0.042 × 𝐼𝑅 × 𝑠𝑖𝑛(ℎ𝑟18− 13.5) (1)
Where:
Td = Pavement temperature at depth d in °C
IR = Infrared surface temperature measured at the time of FWD testing in °C Log = Base 10 logarithm
d = Depth at which mat temperature is to be predicted, mm 1-day = Average air temperature the day before testing
sin = Sine function on an 18-hr clock system, with 2 radians equal to one 18-hr cycle hr18 = Time of day, in 24-hr clock system, but calculated using an 18-hr asphalt concrete
(AC) temperature rise and fall time cycle
Temperature Correction for HMA Modulus
Several equations (Ullidtz 1987, Baltzer and Jansen 1994, Deacon et al. 1994, Noureldin 1994, Kim et al. 1995, Ali and Lopez 1996, Lukanen et al. 2000, Chen et al., 2000) have been proposed relating the HMA modulus to a standard reference temperature. However, different values of standard reference temperature are found in literature for HMA modulus characterization. The commonly used standard reference temperatures are 68ºF in AASHTO 1993 design procedure (AASHTO 1993), 70 ºF in AASHTO Mechanistic-Empirical Pavement Design Guide (MEPDG) (AASHTO 2008) and Pavement ME (formerly, DARWin-ME) (AASHTO 2012), 77 ºF in some previous studies (Noureldin 1994). Among them, the temperature correction equation developed by Chen et al (2000) using Texas Mobile Load Simulator (MLS) data is the only available model with the flexibility to normalize to any reference temperature with good accuracy. Considering this advantage, it was incorporated into the temperature normalization routine in I-BACK:
𝐸𝑇𝑤 = 𝐸𝑇𝑐⁄[(1.8𝑇𝑊+ 32)2.4462∗ (1.8𝑇
𝐶+ 32)−2.4462] (2)
Where:
ETw= the adjusted modulus of elasticity at Tw, MPa
ETc = the adjusted modulus of elasticity at Tc, MPa
Tw = the temperature to which the modulus of elasticity is adjusted, ℃
Tc = the mid-depth temperature at the time of FWD data collection, ℃
7
Computation of Effective Structural Number (SN) and Subgrade Support (k-value): AASHTO Pre ME-Design Approach
The concept of SNeff is typically used for evaluating the overall structural condition of flexible
pavements. Similarly, the keff is used for determining the subgrade support for PCC rigid pavement and composite pavement analysis. Typically, when the ratio of SNeff to as-built SN
based on in-place pavement structure falls below 90%, the evaluated section is recommended for structural improvement. The AASHTO 1993 design procedure (AASHTO 1993) outlines a method for calculation of SNeff and the keff using the measured deflection data. The SNeff and the
keff equations in the AASHTO 1993 design procedure (AASHTO 1993) are expressed as follows:
𝑆𝑁𝑒𝑓𝑓 = 0.0045𝐷√𝐸3 𝑝 (3)
𝑘𝑒𝑓𝑓 = 𝑘𝑑𝑦𝑛𝑎𝑚𝑖𝑐/2 (4)
Where:
D = total pavement thickness, inch
EP = effective modulus of pavement layers, psi
kdynamic = effective dynamic modulus of pavement layers calculated from deflection basin,
psi
Following the AASHTO 1993 design procedure, the pseudo-codes and algorithms for implementing the computation of these two parameters (SNeff and keff ) in I-BACK were developed . First, the deflection basin at the reference temperature is computed using the temperature normalized AC modulus and the ANN forward models. Next, the computed deflection at the center of the load plate (d0) is related to the effective modulus of pavement
layers (EP), subgrade resilient modulus (MR) and other parameters as shown in the following
equation:
𝑑0 = 1.5𝑝𝑎
{
1
𝑀𝑅√1+(𝐷𝑎3√𝑀𝑅𝐸𝑝)
2+
[
1− 1
√1+(𝐷𝑎)2 ] 𝐸𝑃
}
(5)
Where:
d0 = deflection measured at the center of the load plate (inch) at the reference temperature
(68°F)
p = load pressure, psi a = load plate radius, inch
The unknown EP value required in the SNeff computation (See equation 3) is determined in
I-BACK by again employing the in-built Excel Solver Tool. Unlike SNeff computation for AC
8
straightforward. The backcalculated k-values (kdynamic) are inputted into equation 4 to obtain keff
values.
Computation of Structural Rating (SR) and Soil Support (k-value): Iowa DOT AC Overlay Design Procedure Using Road Rater Deflection Measurements
The Iowa DOT has developed an AC overlay design procedure for existing flexible, rigid and composite pavements using the Road Rater measurements (Heins 1979, Marks 1983, Potter and Dirks 1986, Potter and Dirks 1989). This overlay design procedure was patterned closely after the 1993 AASHTO design procedures. For the Iowa DOT AC overlay design procedure, the concept of SR as the estimated AASHTO SN was developed to characterize present structural condition of existing pavement. The SR was graphically related to average Road Rater sensor No. 1 deflection (d0) value to determine SR from Road Rater deflection measurement.
In addition to SR, the Iowa DOT AC overlay design procedure also adapted soil support k-value to estimate existing subgrade soil support condition. The base relationship chart for soil support value for flexible, rigid and composite pavements was developed by relating soil support k-values with Road Rater deflection measurements.
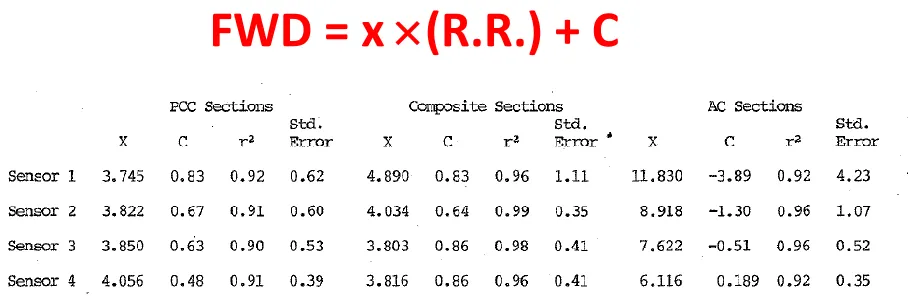
Correlation of Road Rater Deflection Measurements to FWD Deflection Measurements
9
Figure 4. Generalized linear correlation equation with coefficients between FWD and Road Rater deflection measurements; Note. sensor 1 deflection (d0), sensor 2 deflection (d12),
sensor 3 deflection (d24), and sensor 4 deflection (d36) (adapted from Jones and Hanson
1991)
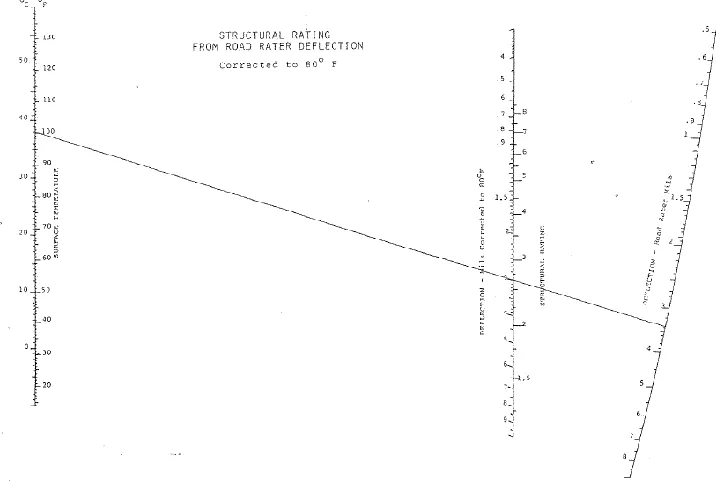
Determination of SR for Flexible Pavement
Figure 5 presents flexible pavement base relationship chart to determine SR from Road Rater d0
corrected to 80F. The Road Rater d0 at testing temperature were corrected to 80F. A
nomograph, as shown in Figure 6, was developed to correct the Road Rater d0 at testing
temperature to 80F and then use it to compute SR.
10
Figure 5. Flexible pavement base relationship between SR and Road Rater D0 at 80F
(adapted from Potter and Dirks 1989)
[image:26.612.136.494.422.663.2]11
To incorporate flexible pavement SR determination from nomograph and chart into I-BACK computation algorithms, a synthetic database was developed from chart in Figure 5 and nomograph from Figure 6. By using this synthetic database, two correlation equations were developed. These equations are Road Rater d0 temperature correction equation and SR
determination equation expressed as follows
𝑦 = (1.3804 − 0.0046𝑇)𝑥 + 1.2592 − 0.296 × 𝑙𝑛 (𝑇) (6)
Where:
y = Road Rater d0 corrected to 80°F, mils
x = Road Rater d0 at testing temperature, mils
T = Temperature, °F
𝑙𝑜𝑔10𝑦 = −0.74171 × 𝑙𝑜𝑔10𝑥 + 0.7831 (7)
Where:
y = SR at 80°F
[image:27.612.122.501.438.668.2]x = Road Rater d0 corrected to 80°F, mils
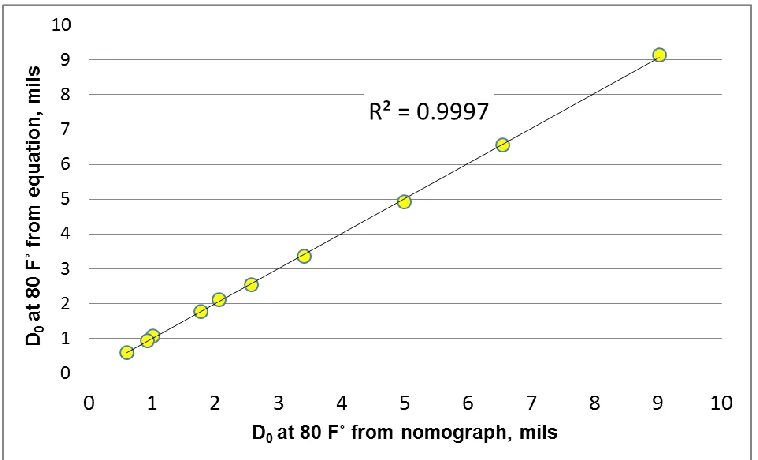
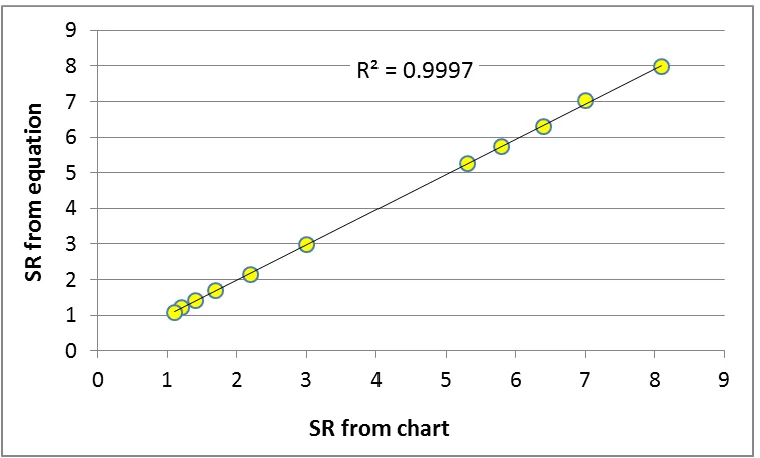
Figure 7 and Figure 8 compare Road Rater D0 at 80°F and SR determined from the nomograph
(see Figure 6) and the developed equations. The data not used in equation development were randomly selected and used in these comparisons. As seen in these figures, the developed equations provide good estimations of both Road Rater D0 at 80°F and SR determined from
nomograph.
Figure 7. Road Rater D0 temperature correction for flexible pavement: nomograph versus
12
Figure 8. SR determination for flexible pavement: nomograph versus equation
Determination of SR for Rigid and Composite Pavements
Figure 9 presents the rigid and composite base relationship chart to determine SR from Road Rater d0 in Iowa DOT AC overlay design procedure. No temperature correction is applied to d0
for both of rigid and composite pavements. However, for composite pavement, temperature correction to 70°F is applied to SR at testing temperature. Similar to the development of SR prediction equation for flexible pavement, a correlation equation between SR and Road Rater d0
was developed using synthetic database derived from chart in Figure 9. The chart based rigid and composite pavement SR determination procedures were then incorporated into the I-BACK computation algorithms. The developed correlation equation is expressed as follows:
𝑙𝑜𝑔10𝑦 = −0.81779 × 𝑙𝑜𝑔10𝑥 + 0.72032 (8)
Where:
y = SR at testing temperature
x = Road Rater d0 at testing temperature, mils
13
Figure 9. Rigid and composite pavement base relationship between SR and Road Rater D0
(adapted from Potter and Dirks 1989)
Figure 10. SR determination for rigid and composite pavements: chart versus equation
[image:29.612.117.497.409.638.2]14
of SR (Potter and Dirks 1989) for composite pavement expressed below has been incorporated into I-BACK computation algorithm.
𝑇𝑒𝑚𝑝. 𝐶𝑜𝑟𝑟𝑒𝑐𝑡𝑒𝑑 𝑆𝑅 = 𝑁𝑜𝑛 − 𝑇𝑒𝑚𝑝 𝐶𝑜𝑟𝑟𝑒𝑐𝑡𝑒𝑑 𝑆𝑅 + (70℉− 𝑃𝑎𝑣𝑒 . 𝑇𝑒𝑚𝑝) × (−0.0145) (9)
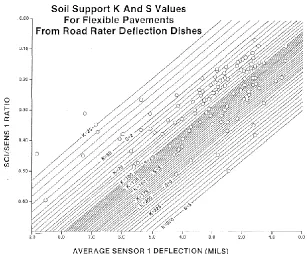
Determination of k-value for Flexible, Rigid and Composite Pavements
Figure 11 presents soil support k-value relationship charts for flexible pavement and Figure 12 presents soil support k-value relationship charts for rigid and composite pavements. The base relationship charts for soil support k-value used in Iowa DOT AC overlay design procedure graphically relate soil support k-values with average Road Rater d0 values and the ratio of
Surface Curvature Index (SCI) values to Road Rater d0 values (SCI/ d0). SCI is defined as the
difference in mils between Road Rater Sensor No. 1 (d0) and Sensor No. 2 (d12).
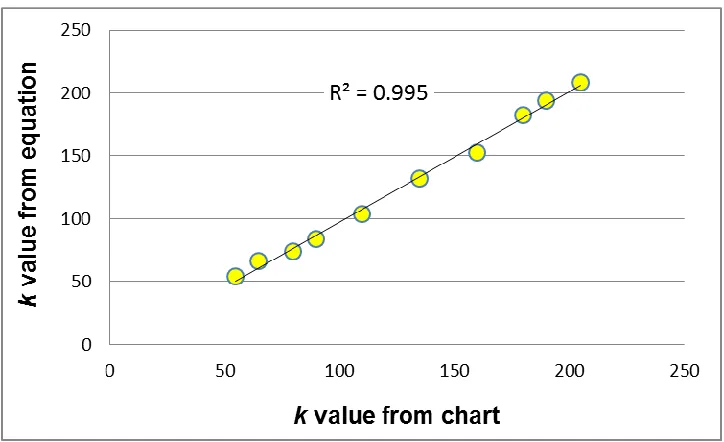
Similar to the development of SR determination equations described previously, the correlation equations for subgrade support k-values were developed using synthetic database derived from charts shown in Figure 11 and Figure 12. The developed equations were then incorporated into I-BACK computation algorithms. The developed correlation equations are expressed as follows:
𝑘 = 456.52𝑦2 − 68.295𝑥𝑦 + 2.554𝑥2+ 421.04𝑦 − 31.494𝑥 + 80.628 (10)
Where:
k = modulus of subgrade reaction for flexible pavement, psi/inch
y = SCI/Road Rater d0
x = Road Rater d0, mils
𝑘 = −2967.2𝑦2+ 561.988𝑥𝑦 − 26.61𝑥2 + 751.01𝑦 − 71.271𝑥 + 176.76 (11)
Where:
k = modulus of subgrade reaction for rigid and composite pavements, psi/inch
y = SCI/Road Rater d0
x = Road Rater d0, mils
15
[image:31.612.149.463.377.624.2]Figure 11. Flexible pavement base relationship for soil support k-value determination (adapted from Potter and Dirks 1989)
Figure 12. Rigid and composite pavement base relationship for soil support k-value determination (adapted from Potter and Dirks 1989)
16
[image:32.612.122.490.130.355.2]development. Figure 14 displays similar comparison for rigid and composite pavements. As seen in these figures, the developed equations provide good k-value estimates for both the flexible and rigid/composite pavements.
Figure 13. k-value determination for flexible pavement: chart versus equation
[image:32.612.125.487.392.613.2]17 I-BACK USER MANUAL
The password-protected, Excel Spreadsheet based I-BACK was developed by writing Macros using Microsoft’s Visual Basic for Applications (VBA) programming language. In case of troubleshooting, the user is requested to change the macro security (Tools Macro Security) to the “medium” or “low” level to allow the macros to run. I-BACK provides user interaction for data editing and pasting, and all other functionalities available in Excel. The Excel sheets in I-BACK include a main menu and analysis menu (for each pavement type) for recording inputs and displaying the results of analysis. The input and output space is divided by a control button with command buttons in each of the analysis spreadsheets. I-BACK also generates an output file in CSV format at the completion of analysis in the same folder where the software tool is saved.
Program Main Menus
I-BACK starts by displaying the main menu (Figure 15). As a first step, users are expected to select the pavement type (conventional, full-depth flexible, rigid or composite pavements) by clicking on it to activate the selected pavement analysis Excel sheet/interface. There are six Excel pavement analysis sheets, including the conventional flexible pavement analysis module with 9-kip and variable FWD load, the full-depth flexible pavements analysis module with 9-kip and variable FWD load, and the composite and rigid pavement analysis module with 9-kip FWD loadings. The software toolbox is programmed to give warning messages if the user the clicks anywhere else.
While working with the toolbox, all other Excel features are accessible, including open, close, copy, paste, save, save as, print, and print settings.
19 (a)
(b)
[image:35.612.81.513.65.583.2](c)
Figure 16. ANN Information: (a) ANN Information button in main menu, (b) Screenshot of main menu on choosing ANN info show option, (c) Sample Excel sheet for ANN model information
Pavement Analysis Menus
20
[image:36.612.124.487.231.501.2]pavement analysis menu. The analysis tool allows user processing data and executing analysis with several functions. The results of analysis are provided in the output part of pavement analysis menu.
Figure 17 illustrates the conventional flexible pavement analysis menu of I-BACK as a typical layout example. The analysis tool for all pavement types has four button functions, “Run”, “Filter”, “Open FWD data file” and “Main Menu”. The analysis tool for rigid pavements has additional submenus of “Equation.” The detail descriptions of these button functions are presented in the following subsection. Table 1 summarizes key inputs required and outputs produced through I-BACK.
21
Table 1. Key required inputs and outputs produced by I-BACK
Type Inputs Outputs
Flexible (conventional /full depth)
FWD loads applied and deflection measurements
Pavement layer thicknesses
EAC-modulus of HMA or AC, Kb
-base modulus parameter, and ERi
-subgrade resilient modulus at actual FWD testing temperature
EAC at reference temperature
SNeff - effective SN
Road Rater based SR and k
Rigid FWD loads applied and
deflection measurements
Pavement layer thicknesses
EPCC-modulus of PCC and ks
-coefficient of subgrade reaction
keff - effective k-value
Road Rater based SR and k Composite FWD loads applied and
deflection measurements
Pavement layer thicknesses
EAC, EPCC,and ks at actual FWD
testing temperature
EAC at reference temperature
keff
Road Rater based SR and k
General Information Inputs
After selecting one of the pavement types from the main menu, a general information window appears. Its purpose is to get information that represents a project site at the beginning of each analysis (see Figure 18). The information required in this window are project name, project location, FWD testing date, time, and temperature conditions of air and pavement surface. The user is required to fill in the information to continue with pavement analysis. Note that the Time, Infrared (IR) temperature at the time of FWD testing and previous day air temperature are
required inputs for carrying out temperature correction of AC modulus and subsequent SNeff
22 Figure 18. General information window
FWD Deflection Database and Inputs
At the next step, users are expected to enter the FWD deflection database and inputs for the I-BACK program. Required analysis parameters are deflection data, pavement layer information (layer thicknesses), and FWD load (for variable FWD load analysis). Depending on pavement type, the number of layers can be changed. If any of the required parameter is missing, the program will display an error message “No Data” in the results section. Clicking the “Main Menu” button allows the user to go back to I-BACK program main menu for selection of the pavement type.
The input requirements for conducting conventional flexible pavement analyses are FWD deflection data, asphalt concrete thicknesses, granular base thickness, and FWD load. The input requirements for conducting full depth asphalt pavement analyses are same as conventional flexible pavement analyses except not requiring granular base thickness.
Required input parameters for rigid pavement analysis are deflection data, PCC layer thickness, granular base thickness, degree of bonding, and estimated moduli ratio (Ebase/EPCC), and FWD
23
(Ceylan et al, 2007). During analysis, the effective PCC thickness is automatically calculated from pavement layer information (PCC layer thickness, granular base thickness, degree of bonding, and estimated moduli ratio) and used in backcalculation analysis. The clicking
[image:39.612.146.468.171.456.2]“Equation” button in rigid pavement analysis tool menu provides the equations sheet as shown in Figure 19. This equations sheet summarized the equations used for calculation of effective PCC thickness for fully bonded PCC layers, unbonded PCC layers and partially bonded PCC layers.
Figure 19. Screen shot of effective PCC thickness equations sheet
Required input parameters for composite pavement analysis are deflection data, pavement layer information (layer thicknesses, estimated PCC modulus, estimated coefficient of subgrade reaction), and FWD load.
The default units used in the program are based on US customary units. FWD deflection data (D0
till D60) should be entered in mils (10-3 inches), layer thickness in inches, and FWD load should
be in kips. The program will not run correctly if these input parameters are not in the desired ranges. The user is requested to refer to the report for the appropriate ranges of these parameters.
24
[image:40.612.111.501.113.419.2]kip-constant FWD load. The variable FWD load analysis uses the raw FWD deflection data corresponding to the raw FWD loads.
Figure 20. Screen shot of FWD data extraction through open FWD data file button
Filtering Menu
After entering the FWD data required, there is a data preprocessing unit for filtering the data. It is optional to use the filtering window. Figure 21 shows the available options for filtering. The two options are:
Range Check: Deflection basin should form a bowl shape and, therefore, deflections should be in decreasing order. Data that falls outside this range are red colored.
Model Check: ANN models are normalized according to the model ranges and, therefore, any input outside the range used in ANN training will form a poor quality input. As a result, the model check will determine the outliers and color them in red.
The filtering is applied by changing the color of the input parameter to red. Therefore, results for these parameters are also calculated. With this approach, engineers will have a better
25 (a)
[image:41.612.207.404.71.309.2](b)
Figure 21. Filtering the FWD data: (a) Filter options menu, (b) Filtering results (no filtered data in this example)
ANN Based Preliminary Backcalculation Result Outputs
After preprocessing the data, clicking the “Run” button will activate a neural network-based analysis of pavements. The program will analyze the employed ANN model for the pavement properties. For each model, the analysis results will be displayed on the right side of the screen. The user should scroll right to see all results. The default units used in the program are based on US customary units. Reported results are modulus values, strains, and stresses. Modulus and stress values are reported in psi and strains are reported in micro-strains (x106).
The conventional flexible pavement analysis results are EAC-modulus of AC, Kb-base modulus
parameter, ERi-subgrade resilient modulus, εAC-tensile strain at the bottom of asphalt layer, εSG
-compressive strain at the top of subgrade, and σD-subgrade deviator stress. The full depth
flexible pavement analysis results are EAC-modulus of AC, ERi-subgrade resilient modulus, εAC
-tensile strain at the bottom of asphalt layer, εSG-compressive strain at the top of subgrade, and
σD-subgrade deviator stress.
The rigid pavement analysis results include EPCC-modulus of PCC, ks-coefficient of subgrade
reaction, σPCC-tensile stress at the bottom of the PCC layer, and radius of relative stiffness
(RRS).
The composite pavement analysis results include EAC-modulus of AC, EPCC-modulus of PCC, ks
-coefficient of subgrade reaction, εAC-tensile strain at the bottom of asphalt layer, and σPCC-tensile
stress at the bottom of the PCC layer.
26
supply all the input parameters will be reflected in the results column of that model. The program will automatically write “No Data.” For example, if D48 is missing in the input data, then output
columns will display the error message of “No Data.” At the end of each column, a statistical summary (i.e., mean, standard deviation, and coefficient of variation) of the results is presented.
After completing ANN based preliminary backcalculation, a progress report window appears as shown in Figure 22(a). Its purpose is to give user the notice of completion of ANN based preliminary backcalculation and its intention to proceed to deflection basin matching analysis to determine final backcalculation results.
(a)
[image:42.612.145.468.197.627.2](b)
Figure 22. ANN based preliminary backcalculation analysis: (a) Preliminary
27
Deflection Basin Matching/Optimization of Backcalculation Analysis Result Outputs
Clicking the “OK” button in progress report window (see Figure 22 (b)) will activate deflection basin matching/optimization based backcalculation analysis. Figure 23 (a) illustrates the sample analysis results of a conventional flexible pavement. The analysis results will be displayed on the right side of ANN based preliminary backcalculation analysis result columns in the screen. The user should scroll right to see all results. If user have a trial solution checking screen shown in Figure 23 (b) during deflection basin matching analysis, user can hit “Stop” button (See Figure 23 (b)) to proceed with analysis since the solutions do not generally improve beyond this point.
(a)
(b)
Figure 23. Deflection basin matching/optimization of backcalculation analysis: (a) Optimized backcalculation analysis result outputs, (b) Trial solution check message box
[image:43.612.73.541.208.623.2]28
pavement type, FWD deflection predictions, and Mean Absolute Error (MAE) between measured and predicted FWD deflections for assessment of the accuracy of refined/optimized modulus.
After completing the deflection basin matching/optimization based backcalculation analysis, progress report window appears as shown in Figure 24(a) for flexible and composite pavements and Figure 24(b) for rigid pavement. Its purpose is to give user the notice of completion of analysis and its intention to proceed to HMA modulus temperature correction for flexible and composite pavements or computation of effective k-value (keff ) for rigid pavement.
(a)
[image:44.612.156.454.205.445.2](b)
Figure 24. Progress report window after completing optimization of backcalculation analysis: (a) flexible and composite pavements, (b) rigid pavement
HMA Modulus Normalization Result Outputs
29 (a)
[image:45.612.180.438.62.592.2](b)
Figure 25. HMA modulus temperature correction: (a) Temperature corrected HMA modulus result outputs, (b) Progress report window after completing HMA modulus temperature correction
After completing HMA modulus temperature normalization procedure, progress report window appears as shown in Figure 25(b). Its purpose is to give user the notice of completion of
procedure and its intention to proceed to the computation of effective SN (SNeff) for flexible
30
Output Results of the Effective SN (SNeff) for Flexible Pavement and the Effective k-value (keff ) of
Rigid and Composite Pavements
Clicking the “OK” button in progress report windows shown in Figure 24(b) will activate computation of effective k-value (keff ) for rigid pavement. Similar to this, clicking the “OK”
[image:46.612.272.340.264.586.2]button in progress report windows shown in Figure 25(b) will activate computation of effective SN (SNeff) for flexible pavement and effective k-value (keff ) for composite pavement.
Figure 26 illustrates the sample analysis results of rigid pavement. Reported results for rigid and composite pavements is effective k-value (keff ). Figure 27 illustrates the sample analysis results
of a conventional flexible pavement. Reported results for flexible pavement are effective modulus of pavement layer (Ep) and effective SN (SNeff). The user should scroll right to see all
results.
31
Figure 27. Effective SN (SNeff) with effective modulus of pavement layer (Ep) for flexible
pavement
Output Results of the Road Rater Based SR and k
Figure 28 illustrates the sample analysis results of Road Rater Based SR and k-value
32
Figure 28. Road Rater Based SR and k for flexible pavement
After completing computation of Road Rater Based SR and k-value, the final progress report window appears as shown in Figure 29. Its purpose is to inform the user about the completion of all analysis and to proceed with the generation of a summary result file which is a separate end result file.
Figure 29. Final Progress report window after completion of analysis
Summary Result File
[image:48.612.189.419.477.569.2]33 SUMMARY
The objective of this study is to incorporate significant enhancements into the fully-automated software system for rapid processing of the FWD data with the goal of improving the accuracy and usability of collected Iowa FWD data. These enhancements included: (1) deflection basin matching/optimization, (2) temperature normalization of HMA layer modulus, (3) computation of 1993 AASHTO design guide based effective SN (SNeff) and effective k-value (keff ), (4) computation of Iowa DOT AC overlay design based Structural Rating (SR) and k-value (k),and (5) enhancement of user-friendliness of input and output from the software.
A high-quality, easy-to-use backcalculation software package referred to as, I-BACK: the Iowa Pavement Backcalculation Software, was developed to achieve goals with the following
highlighted benefits:
Provide more fine-tuned ANN pavement backcalculation results by implementation of deflection matching optimizer for conventional flexible, full-depth, rigid, and composite pavements
Provide temperature normalized/corrected HMA layer modulus at a standard reference temperature for conventional flexible, full-depth and composite pavements
Provide effective Structural Number (SNeff) and the effective k-value (keff ) as final outputs for pavement/asset management purposes
Provide Structural Rating (SR) and k-value (k) as final outputs to make FWD deflection measurements suitable for use in existing Iowa DOT AC overlay design procedure
35 REFERENCES
AASHTO. 1993. AASHTO Guide for Design of Pavement Structures. Washington, DC.
AASHTO. 2008. Mechanistic-Empirical Pavement Design Guide, Interim Edition: A Manual of Practice. Washington, DC.
AASHTO. 2012. AASHTOWare Pavement ME Design. Washington, DC.
<http://www.darwinme.org/MEDesign/Index.html> (February 22, 2013).Ali, H. and Lopez, A., 1996. Statistical analysis of temperature and moisture effects on pavement structural properties based on seasonal monitoring data. Transportation Research Record 1540: 48-55. Washington DC: Transportation Research Board, National Research
Council.
Baltzer, S. and Jansen, J. M. 1994. Temperature correction of asphalt moduli for FWD
measurements. Proceedings of the 4th International Conference on Bearing Capacity of Roads and Airfields, Volume 1, Minneapolis, MN.
Ceylan, H., Guclu, A., Bayrak, M. B. and Gopalakrishnan, K. 2007. Nondestructive Evaluation of Iowa Pavements-Phase I. Final Report, CTRE Project 04-177, Ames, IA: Center for Transportation Research and Education (CTRE), Iowa State University.
Ceylan, H., Gopalakrishnan, K, Kim, S., Guclu, A., and Bayrak, M. B. 2009. Nondestructive Evaluation of Iowa Pavements-Phase II: Development of a Fully Automated Software System for Rapid Analysis/Processing of the Falling Weight Deflectometer Data. Final Report, CTRE Project 04-177Phase 2, Ames, IA: Center for Transportation Research and Education (CTRE), Iowa State University.
Chen, D., Bilyeu, J., Lin, H. H., and Murphy, M. 2000. Temperature correction on falling weight deflectometer measurements. Transportation Research Record 1716: 30-39. Washington DC: Transportation Research Board, National Research Council.
Deacon, J. A., Coplantz, J. S., Tayebali, A. A,. and Monismith, C. L. 1994. Temperature
considerations in asphalt-aggregate mixture analysis and design. Presented at the Annual 73thMeeting of the Transportation Research Board. Washington, DC: Transportation Research Board.
Heins, D. 1979. Road Rater Dynamic Deflections for Determine Structural Rating of Flexible Pavements. Final Report for IHRB 178, Ames, IA: Office of Materials, Iowa Department of Transportation.
Jones, K., and Hanson, T. 1991. Correlation of the Road Rater and the Dynatest Falling Weight Deflectometer. Final Report for MLR-91-4, Ames, IA: Office of Materials, Iowa
Department of Transportation.
Kim, Y. R., Hibbs, B. O., and Lee, Y. C. 1995. Temperature correction of deflections and backcalculated moduli. Transportation Research Record 1473: 55-62. Washington DC: Transportation Research Board, National Research Council.
Lukanen, E, O., Stubstad, R, and Briggs, R. 2000. Temperature Predictions and Adjustment
Factors for Asphalt Pavement. FHWA-RD-98-085, Mclean, VA: Federal Highway
Administration.
Marks, V. J. 1983. Dynamic Deflections to Determine Roadway Support Ratings. Final Report for IHRB 245, Ames, IA: Office of Materials, Iowa Department of Transportation. Noureldin, A.S. 1994. Temperature gradient in a full depth asphalt and its effect on modulus and
36
Potter, C. J., and Dirks, K. L. 1986. Structural Analysis and Overlay Design of Pavements Using the Road Rater. Final Report for MLR-84-3, Ames, IA: Highway Division, Iowa
Department of Transportation.
Potter, C. J., and Dirks, K. L. 1989. Pavement Evaluation Using the Road Rater Deflection Dish. Final Report for MLR-89-2, Ames, IA: Highway Division, Iowa Department of
Transportation.