Int. J. Electrochem. Sci., 9 (2014) 4114 - 4128
International Journal of
ELECTROCHEMICAL
SCIENCE
www.electrochemsci.org
A Novel Hybrid Composite Formed by Reaction of
4,5-Diphenyl-2-Imidazolethiol with Hexacyanoferrate (III) and
Subsequent Reaction with Copper (II): Preparation,
Characterization and a Voltammetric Application for
Determination of L-Glutatione
Daniela Rodrigues Silvestrini, Urquisa de Oliveira Bicalho, Devaney Ribeiro do Carmo*
Faculdade de Engenharia de Ilha Solteira UNESP - Universidade Estadual Paulista, Departamento de Física e Química, Av. Brasil Centro, 56 CEP 15385-000, Ilha Solteira, SP, Brazil. fax: 55 (18)3742-4868
*
E-mail: [email protected]
Received: 8 March 2014 / Accepted: 4 April 2014 / Published: 19 May 2014
A novel Hybrid composite formed by interaction of 4,5-Diphenyl-2-Imidazolethiol and copper hexacyanoferrate (III) (CuHDIT) was characterized by Fourier transform infrared spectra (FTIR), x-ray diffraction (XRD), scanning electron and energy dispersive (SEM). CuHDIT was incorporated into a graphite paste electrode and the electrochemical studies were conducted with cyclic voltammetry. The cyclic voltammogram of the modified graphite paste electrode with CuHDIT, showed two redox couple with formal potential Eθ’=0.24 and 0.74 V (vs Ag/AgCl(sat.),
KCl, 1.0 mol L-1; v = 20 mV s-1), attributed to the Cu+/ Cu2+ and Fe2+(CN)6/ Fe3+(CN)6 redox
processes respectively. The redox second redox couple (0.74V) presents an electrocatalytic response for determination of L-Glutatione. The modified electrode showed a linear response from 5.0×10⁻⁵
to 9.0×10⁻⁴ mol L-1. The method showed a detection limit of 5.33×10⁻⁵ mol L-1 with a relative standard deviation of 2% (n = 3) and amperometric sensitivity of 12.52 mA mol L-1.
Keywords: 4,5-Diphenyl-2-Imidazolethiol, Hexacyanoferrate (III), L-glutatione, cyclic voltammetry, graphite paste electrode.
1. INTRODUCTION
advantages over conventional electrodes in numerous applications areas including electrocatalysis and electrochemical sensors [1]. One of the advantages of CMEs is their ability to catalyze the oxidation and reduction of sites involved in electronic transfer reactions, there by increasing their sensitivity and selectivity of some electroactives species [2-4]. In addition, chemically modified carbon paste electrodes possess advantages of ease of preparation, ease of regeneration, stable response, very low Ohmic resistance [5] and CMEs posses distinct advantages over mercury electrodes because of their possible toxicity or because of rapid deterioation of electrode response [6]. Platinum and gold electrodes form surface oxide, causing complications with analytical applications also [7]. In this view point the graphite paste electrode offers advantages over methods of modification above mentioned.
In this paper, carbon paste electrode was modified with a new type of composite based on complexing of the 4,5-diphenyl-2-imidazolethiol following two stages; first with potassium hexacyanoferrate (III) and then cupric ions (CuHDIT). The modified graphite paste electrode with CuHDIT was characterized by cyclic voltammetry. We demonstrated that the modified paste electrode presents a responses towards L-Glutathione.
L-glutatione can exist in oxidized (GSSG) and reduced (GSH) forms [8] and it is involved in many cellular functions, especially in antioxidant defense [9]. The glutatione redox ratio is the major non-protein thiol in living cells [10].
GSH is capable of scavenging reactive oxygen and nitrogen species, which ar thought to contribute to the development of many common diseases including cancer, heart attack, stroke, arthritis [11].
Several methods have been described in the literature for determination of L-Glutatione, such as spectrophotometry [12, 13], potentiometry [14], high-performance liquid chromatography [15-18], spectrofluorimetry [19] and voltammetry [20-22].
Most of them are less susceptible to interference problems with sample preparation, as they often require extraction and pre-concentration steps [10]. However, electrochemical methods, present the advantages of simplicity and high sensitivity.
2. EXPERIMENTAL 2.1. Reagents and solutions
2.2. Techniques
The spectra in the in-frared region were obtained by a Nicolet 5DXB FT-IR spectrometer (Nicolet Instruments, Madison, WI). The pastils for analysis were prepared using 150 mg of previously dried KBr PA of the Synth brand and 1.5 mg (1.0% (w/w)) of each sample. A minimum of 64 “scans” with a resolution of ±4 cm-1 in a band of 4000 to 400 cm-1 was used. The X ray diffraction patterns (XRD) spectroscopy were obtained using a Siemens D 5000 diffractometer with CuK ( 1.5406 Å radiation), submitted to 40 kV, 30 mA, 0.05o s-1 and exposed to radiation from 5 up to 50o (2). The scanning electron microscopy (SEM) and Energy-dispersive X-ray spectroscopy (EDS) of the any materials were obtained using a JEOL JSM T-300 microscope. The samples were adhered over aluminum holders and covered with a thin layer (20–30 nm) of gold in Sputter Coater Bal-Tec SCD-050. The cyclic voltammetry readings were obtained by potentiostat of Microquímica (MQPG-01) on a scale ranging from - 0.2 to 1.0 V (versus Cl). The electrochemical system was composed of three electrodes: a working electrode (internal diameter 0.5mm) of graphite paste modified with 20% CuHDIT, 25μL Nujol, as reference electrode (Ag/AgCl(sat.)), and an auxiliary electrode made of platinum. In the electrochemical cell, the L-Glutatione solutions used in voltammetric experiments were prepared immediately before use and were deaerated with purified nitrogen.
2.3. Synthesis
2.3.1. Reaction of Hexacyanoferrate (III) and Copper with DIT to form CuHDIT
The CuHDIT composite were prepared as follows: 1.0 g of 4,5-diphenyl-2-imidazolethiol (DIT) was added to 25 mL of a solution of 1.0×10⁻² mol L-1 potassium hexacyanoferrate (III). The mixture was stirred for 1h at room temperature. The solid phase was then filtered and washed thoroughly with deionized water. The material resulting from this first phase were oven dried at 70oC and designated as HDIT. In the second stage, the HDIT was added to a solution of 1.0×10⁻² mol L-1 of copper (II) chloride and the mixture was stirred for 1h at room temperature and then the solid was thoroughly filtered, washed with deionized water and dried at 70oC. The materials resulting from this stage were described by CuHDIT.
2.4. Preparation of the graphite paste electrode modified with CuHDIT
2.5. Procedure
Initially, cyclic voltammograms (CV) were recorded for study the sensibility of L-Glutatione, by graphite paste electrode modified with CuHDIT. The supra analite solutions were prepared immediately before use and were deaerated with nitrogen. In most of the experiments, 1.0 mol L-1 KCl (pH~7.2) was used as the supporting electrolyte. The catalytic and or sensibility current was estimated by the difference between the electrode current in the presence of analite compounds and that which is established in the blank solution.
3. RESULTS AND DISCUSSION
4000 3500 3000 2500 2000 1500 1000 500
4000 3500 3000 2500 2000 1500 1000 500
4000 3500 3000 2500 2000 1500 1000 500
4000 3500 3000 2500 2000 1500 1000 500
C=S
D
CN
N-H S-H
C-H
C=C, C-N, C=N
Wavenumber (cm
-1)
C=S
CN
C=C, C-N, C=N
C-H
S-H
N-H
C
B
C=S C-H
S-H
C=C, C-N, C=N
N-H
T
rans
m
it
tanc
e
(%)
A
CNFigure 1. Vibrational spectrum of: (A) Potassium Hexacyanoferrate (III), (B) DIT, (C) HDIT and (D) CuHDIT.
[image:4.596.117.459.282.658.2]
stretching which corresponds to the cage-shaped structure of C≡N(υC≡N) [23].
Figure 1 (B), (C) and (D) illustrate the vibrational spectra of DIT, HDIT and CuHDIT, respectively.
Figure 1 (B) refers to the vibrational spectrum of the DIT ligand, and exhibits characteristic bands of this compound such as the bands ranging from 1300 to 1530 cm-1, related to the axial deformation vibrations of the imidazole ring bonds [23]. The broad and intense band at 2970 cm-1 was assigned to the axial deformation N-H(δN-H) [24, 25].
In the region between 3200 and 3500 cm-1 the bands observed were attributed to the axial deformation of N-H(ʋ N-H), these bands probably overlap the bands attributed to the axial deformation of C-H(ʋ C-H) ring bonds [23, 26].
10 20 30 40 50
10 20 30 40 50
10 20 30 40 50
C
Int
ensi
ty
(
a.
u.
)
2
B
[image:5.596.133.456.281.608.2]A
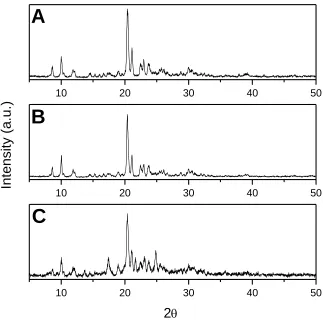
Figure 2. XRD of: (A) DIT, (B) HDIT e (C) CuHDIT.
Additionally, the Figure 1 (B), (C) and (D), the band is related to the stretching of the C=S group (υC=S) around 768 cm-1
A significant vibration, which can be observed in the spectra (C) and (D) are related to the vibrations of type C≡N(υC≡N) around 2042 cm-1, characteristic of the stretching of the potassium hexacyanoferrate (III) [20], and the composite (HDIT) the υC≡N is displaced about 49 cm-1
relative to the hexacyanoferrate (III) potassium.
As an application of this novel composite, DIT was firstly reacted with hexacyanoferrate (III), and then with Cu+2 to form (CuHDIT). The success of synthesis was verified by vibrational spectroscopy (FTIR) as illustrated by Fig. 1 (C) and (D).
Figures 2 (A), (B) and (C) corresponds to the XRD patterns of DIT, HDIT and CuHDIT respectively. According to the XRD patterns obtained, a crystallinity quite common. The DIT, HDIT and CuHDIT showed the following characteristics 2θ = 8.53; 10.23; 12.01; 14.53; 15.25; 15.97; 16.81; 17.53; 19.09; 20.63; 22.83; 23.91; 25.83; 27.54; 28.03; 28.87; 30.43; 39.22. So by the Scherrer equation [29], the size of the particles was estimate to be 288 nm for HDIT and 212 nm for CuHDIT.
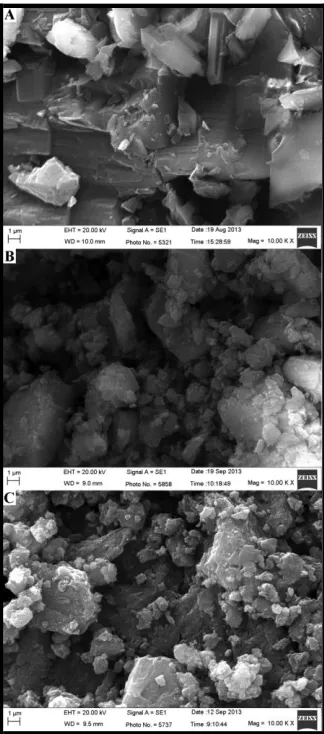
[image:6.596.217.379.358.725.2]The scanning electron microscopy (SEM) of the DIT, HDIT and CuHDIT with an increase of 10.000X, respectively. The scanning electron microscopy of DTI, HDIT and CuHDIT showed the presence of dispersed microparticles with sizes of around 9.0 and 10.0 micrometers, did not exhibit significant change in the size and topology of the materials.
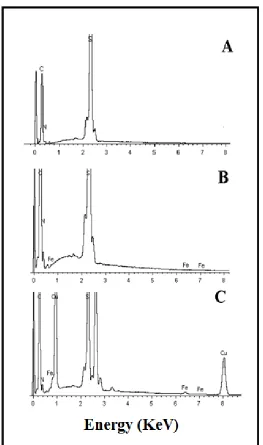
Figures 4 (A), (B) and (C) show energy dispersive spectroscopy analyses (EDS) for DIT, HDIT and CuHDIT samples respectively. It was observed in the EDS spectrum of DIT (A) revealed the presence of C, N and S. In the EDS spectrum for HDIT (B) the presence of C, N, S and Fe. For the composite materials CuHSDIT (C) revealed C, N, S, Fe and Cu, which clearly shows the success in the preparation of CuHDIT.
Figure 4. EDS of: (A) DIT, (B) HDIT e (C) CuHDIT.
[image:7.596.166.429.177.622.2]
-0.2 0.0 0.2 0.4 0.6 0.8 1.0
-15 -10 -5 0 5 10 15 20 (II) (I) I / A
E/V vs Ag/AgCl
Figure 5. Cyclic voltammograms of graphite electrode modified with CuHDIT (KCl 1.0 mol L-1; v = 20 mV s-1; 20% (w/w)).
-0.2 0.0 0.2 0.4 0.6 0.8 1.0
-15 -10 -5 0 5 10 15 20
-0.2 0.0 0.2 0.4 0.6 0.8 1.0
-8 -6 -4 -2 0 2 4 6 8 10
-0.2 0.0 0.2 0.4 0.6 0.8 1.0
-6 -4 -2 0 2 4 6 8
-0.2 0.0 0.2 0.4 0.6 0.8 1.0
-40 -20 0 20 40 60 80 100
-0.2 0.0 0.2 0.4 0.6 0.8 1.0
-20 -10 0 10 20 30 40 50 60
KCl 1 mol L-1
A (II)
(I)
I /
A
E/V vs Ag/AgCl
B (I) (II) I / A
E/V vs Ag/AgCl
NaCl 1 mol L-1
C (II) (I) I / A
E/V vs Ag/AgCl
LiCl 1 mol L-1
(I)
D
I /
A
E/V vs Ag/AgCl
KNO 3 1 mol L
-1 E (II) (I) I / A
E/V vs Ag/AgCl
NaNO 3 1 mol L
-1
[image:8.596.184.398.67.247.2] [image:8.596.136.446.305.711.2]
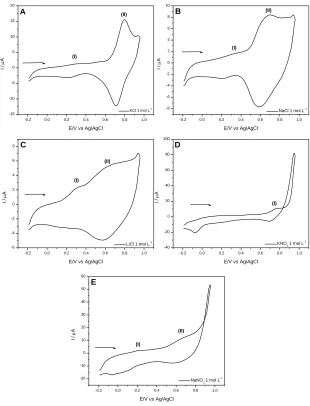
Studies on various supporting electrolytes (KCl, NaCl, LiCl, KNO3 and NaNO3) for studies of cations and anions are illustrated in Fig. 6. It was observed that the nature of the cations affected the average potential (Eθ’) and the current intensities, but was not verified any interference of anions with exception of chloride (Cl-).
[image:9.596.53.548.241.410.2]As shown in Table 1, which are also lists the main electrochemical parameters of the compounds and their respective hydration radii.
Table 1. Relation of the diameter of hydrated cations with the electrochemical parameters of CuHDIT (v = 20mV s-1, 1,0 mol L-1, 20% w/w).
Electrolytes |Ipa/Ipc|(I) ∆Ep(I) (V)*
Eθ’(I) (V)**
|Ipa/Ipc|(II) ∆Ep(II) (V)*
Eθ’(II) (V)**
Diameter of the hydrated cation (nm)***
KCl 0.40 0.06 0.24 0.70 0.08 0.74 0.240
NaCl - - - 1.21 0.09 0.62 0.360
LiCl - - - 0.65 0.04 0.60 0.470
KNO3 - - - 0.91 0.06 0.72 0.240
NaNO3 - - - 0.45 0.05 0.62 0.360
* ∆Ep = [Epa – Epc] ** Eθ’ = [Epa + Epc] / 2 *** Ref [30]
Analogous to studies on CuHDIT [31] and for being a compound analogous to Prussian blue, these materials exhibit a zeolite structure type, presenting cavities that allow the inflow and outflow of some metal ions with smaller hydration radii [32-34].
-0.2 0.0 0.2 0.4 0.6 0.8 1.0
-14 -12 -10 -8 -6 -4 -2 0 2 4 6 8 10 12 14 16 18
(II)
(I)
I /
A
E/V vs Ag/AgCl
KCl 1x10⁻³ mol L-1
KCl 1x10⁻² mol L-1
KCl 1x10⁻¹ mol L-1
KCl 1 mol L-1
KCl 2 mol L-1
[image:9.596.172.414.503.706.2]
-1.2 -1.0 -0.8 -0.6 -0.4 -0.2 0.0 0.2 0.4
0.68 0.70 0.72 0.74 0.76 0.78
R = 0.996
E
'/V
vs
A
g
/A
g
C
l
Log [K+]
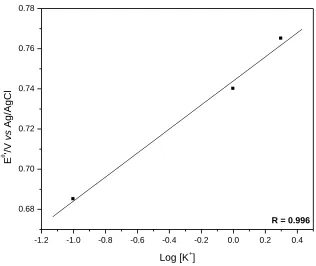
Figure 8. Average potential (Eθ’) of graphite paste modified with CuHDIT as a function of KCl concentration.
For this reason, the cations K+ (smaller hydration radii - Table 1) diffuse more easily between these cavities, resulting in a better electrochemical response of the modified electrode. With the data presented in Table 1, it was concluded that the electrolyte of KCl (K+) showed a better voltammetric performance compared to the others electrolytes.
Fig. 7 illustrates the cyclic voltammograms obtained with different concentrations of KCl (1.0×10⁻³ to 2.0 mol L-1). There is a small shift in formal potential to more positive values with increasing electrolyte concentration.
Fig. 8 shows that the average formal potential values (Eθ’) shifted linearly (R=0.996) to more positive potentials by varying the concentration of KCl from 1.0×10⁻³ to 2.0 mol L-1. This study enabled to see that for the graphite paste electrode modified with CuHDIT, the slope line is of 56 mV per decade of concentration of potassium ions, indicating that the behavior exhibited by the electrode moves close to quasi nernstian process with the transfer of one electron [35, 36].
The equations below describe the ratio of the concentrations of electrolytes in material CuHDIT.
[image:10.596.132.448.81.347.2]
-0.2 0.0 0.2 0.4 0.6 0.8 1.0
-15 -10 -5 0 5 10 15 20 (II)
(I) pH 8
pH 2
I /
A
E/V vs Ag/AgCl
KCl pH2,0 KCl pH6,0
KCl pH3,0 KCl pH7,0
KCl pH4,0 KCl pH8,0
KCl pH5,0
[image:11.596.167.413.84.289.2]Figure 9. Cyclic voltammograms of graphite paste electrode modified with CuHDIT at different pH values (v =20 mV s-1; KCl 1.0 mol L-1; 20% (w/w)).
Fig. 10 illustrates the cyclic voltammogram of CuHDIT at different scan rates (10 to 80 mVs-1), it was observed that by increasing the scan rate there is an increased anodic peak current and also a small shift of the average potential to more positive values [35].
-0.2 0.0 0.2 0.4 0.6 0.8 1.0
-14 -12 -10 -8 -6 -4 -2 0 2 4 6 8 10 12 14 16 18
0 10 20 30 40 50 60 70 80 90 -12 -10 -8 -6 -4 -2 0 2 4 6 8 10 12 14 16 I / A
V1/2 (mV s-1)1/2
v = 10m Vs-1
v = 50m Vs-1
v = 20m Vs-1
v = 60m Vs-1
v = 30m Vs-1
v = 70m Vs-1
v = 40m Vs-1
v = 80m Vs-1
I /
A
E/V vs Ag/AgCl
Figure 10. Cyclic voltammograms of CuHDIT at different scan rates (KCl 1.0 mol L-1; 20% (w/w)). Inserted Graphic: dependence of peak current intensity (anodic and cathodic) as a function of scan rate.
[image:11.596.170.414.431.635.2]
3.1. Electroanalytical application of composite CuHDIT electrocatalytic oxidation of L-Glutatione
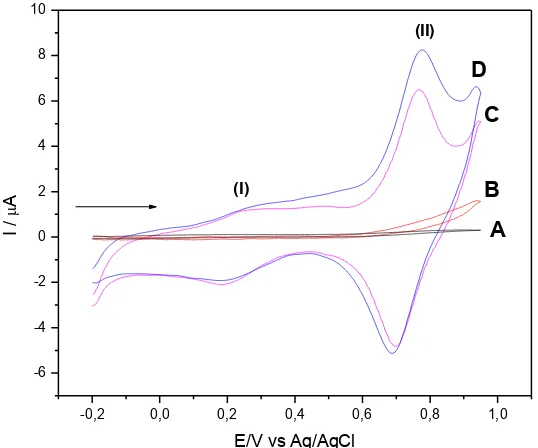
Fig. 11 illustrates the voltammetric behavior of the graphite paste electrode modified with CuHDIT for the electro-oxidation of L-Glutatione in 1.0 mol L-1 KCl. The graphite paste unmodified electrode in a solution of KCl 1.0 mol L-1 in the absence (curve A) and presence of L-Glutatione (curve B) did not show a redox pair in the potential range studied between -0.2 and 1.0 V. After the addition of L-Glutatione there was an increase in the anodic peak current intensity (curve D) when compared with the graphite paste electrode modified with CuHDIT in absence of L-Glutatione (curve C). There was an increase in the anodic current intensity of the peak at 0.77 V and a small shift to more negative potentials. Thus, it was determined that with de adding aliquots of the L-Glutatione, the analite was oxidized by an electrocatalyst oxidation process on the electrode surface.
-0,2 0,0 0,2 0,4 0,6 0,8 1,0
-6 -4 -2 0 2 4 6 8 10
D
C
B A
(II)
(I)
I /
A
E/V vs Ag/AgCl
Figure 11. Cyclic voltammograms: (A) of the graphite paste electrode; (B) graphite paste electrode and 9.0×10⁻⁴
mol L-1 of L-Glutatione; (C) graphite paste electrode modified with CuHDIT and (D) graphite paste electrode modified with CuHDIT and 9.0×10⁻⁴
mol L-1 of L-Glutatione (KCl 1.0 mol L-1; 20mV s-1; 20%(w/w)).
The electrocatalytic oxidation of L-Glutatione occurs as follows: Fe3+ produced during anodic scan, chemically oxidize the molecule L-Glutatione when it is reduced to Fe2+, which will again be electrochemically oxidized to Fe3+.
To this system, the electrocatalytic process can also be represented according to the equations 1 and 2:
2K2CuII [FeII(CN)6] 2KCuII [FeIII(CN)6] + 2K+ + 2e- (Eq.1)
[image:12.596.158.427.294.518.2]
Thus L-Glutatione is oxidized at the electrode surface, and this process occurs in the potential of 0.77 V. The oxidation process does not occur in this potential when is used glassy carbon electrode or unmodified carbon paste (Fig. 11 B).
-0.2 0.0 0.2 0.4 0.6 0.8 1.0
-6 -4 -2 0 2 4 6 8 10
(II)
(I)
L-Glutatione 9x10⁻⁴ mol L-1
L-Glutatione 5x10⁻⁵ mol L-1
I /
A
E/V vs Ag/AgCl
Figure 12. Cyclic voltammograms of applications of various concentrations of L-Glutatione graphite paste electrode modified with CuHDIT (KCl 1.0 mol L-1; 20 mVs-1; 20% (w/w)).
0.0 0.2 0.4 0.6 0.8 1.0
7.0 7.2 7.4 7.6 7.8 8.0 8.2
R = 0.998
Ip
a
/
A
[L-Glutatione] / mmol L-1
[image:13.596.156.422.169.391.2] [image:13.596.169.417.468.672.2]
The peak potential is not affected by the concentration of sulfite and the catalytic current is also linear with the square root of scan rate. The behavior of electrochemical oxidation of Glutatione in the CuHDIT. Fig. 13 illustrates the analytical curve used to determinate L-Glutatione. The modified electrode showed a linear response from 5.0×10⁻⁵
to 9.0×10⁻⁴ mol L-1 with the corresponding equation Y(μA) = 7.07017 + 12.53×10² [L-Glutatione], and a correlation coefficient of r=0.998. The method showed a detection limit of 5.33×10⁻⁵ mol L-1 with a relative standard deviation of 2% (n = 3) and amperometric sensitivity of 12.52 mA mol L-1.
4. CONCLUSION
A preliminary characterization by FTIR and cyclic voltammetry of a composite formed by interaction of a 4,5-diphenyl-2-imidazolethiol (DIT) potassium hexacyanoferrate (III) adsorption and subsequent reaction of copper (CuHDIT) was conducted using graphite paste electrode.
The cyclic voltammogram of the modified graphite paste electrode with CuHDIT, showed two redox couple, a redox pair (peak I) was observed with a midi potential Eθ’= 0.24 V and a redox pair (peak II) was observed with a Eθ’= 0.74 V ( = 20 mV s-1; KCl 1.0 M), attributed to the redox process CuI/CuII and FeII(CN)6/ FeIII(CN)6.
The redox couple presents electrocatalytic property for L-Glutatione. Quantitation in millimolar range of sulfite in pharmaceutical can be achieved using graphite paste electrode modified with CuHDIT. The modified electrode showed a linear response from 5.0×10⁻⁵ to 9.0×10⁻⁴ mol L-1 with the corresponding equation Y(μA) = 7.07017 + 12.5278×10²
[L-Glutatione], and a correlation coefficient of r=0.998. The method showed a detection limit of 5.33×10⁻⁵ mol L-1 with a relative standard deviation of 2% (n = 3) and amperometric sensitivity of 12.52 mA mol L-1
.Additionaly the modified electrode showed a excellent stability and good reproducibility during experiments.
ACKNOWLEDGEMENTS
The authors are grateful for Fundação de Amparo à Pesquisa do Estado de São Paulo (FAPESP - Procs. 2012/05438-1 and 2012/11306-0) and Coordenação de Aperfeiçoamento de Pessoal de Nível Superior (CAPES) for financial support..
Reference
1. D. R. Do Carmo, L. L. Paim, D. R. Silvestrini, A. C. Sá, U. O. Bicalho, N. R. Stradiotto, Int. J. Electrochem. Sci., 6 (2011) 1175.
2. H. S. El-Desoky, M. M. Ghoneim, Talanta, 84 (2011) 223.
3. A. Salimi, K. Abdi, G. R. Khayatiyan, Electrochim. Acta, 49 (2004) 413. 4. M. H. Pournaghi-Azar, R. E. Sabzi, J. Electroanal. Chem., 543 (2003) 115.
5. Y. M. Issa, H. M. Abdel-Fattah, N. B. Abdel-Moniem, Int. J. Electrochem. Sc., 8 (2013) 9578. 6. R. F. Bergstron, D. R. Kay, J. E. Wagner, J. Chromatogr., 222 (1981) 445.
7. M. E. Jobll, D. G. Williams, D. C. Johnson, Electroanalysis, 9 (1997) 1397.
9. R. Herrero, J. L. Barriada, J. M. López-Fonseca, M. R. Moncelli, M. E. Sastre de Vicente, Langmuir, 16 (2000) 5148.
10. N. Pereira-Rodrigues, R. Cofré, J. H. Zagal, F. Bedioui, Bioelectrochemical, 70 (2007) 147. 11. P. R. Lima, W. J. R. Santos, A. B. Oliveira, M. O. F. Goulart, L. T. Kubota, J. Pharm. Biomed.
Anal., 47 (2008) 758.
12. N. B. Besada, N. B. Tadros, Y. A. Gawargious, Acta, 3 (1989) 143.
13. M. A. Raggi, L. Nobile, A. G. Giovannini, J. Pharm. Biomed. Anal., 9 (1991) 1037. 14. D. Compagnone, R. Massoud, C. Di. Ilio, G. Federici, Anal. Lett., 24 (1991) 993. 15. W. Buchberger, K. Winsauer, Anal. Chim. Acta, 196 (1987) 251.
16. K. Fukunaga, N. Nakazono, M. Yoshida, Chromatographia, 48 (1998) 690.
17. C. Parmentier, P. Leroy, M. Wellman, A. J. Nicolas, Chromatogr., B, Biomed. Sci. Appl. 719 (1998) 37.
18. G. Y. Shi, J. X. Lu, F. Xu, W. Il. Sun, L. T. Jin, K. Yamamoto, S. G. Tao, J. Y. Jin, Anal. Chim. Acta, 391 (1999) 307.
19. X. P. Chen, R. F. Cross, A. G. Clark, W. L. Baker, Mikrochim. Acta 130 (1999) 25. 20. H. Karimi-Maleh, M. Keyvanfard, K. Alizad, V. Khosravi, M. Asnaashariisfahani, Int. J.
Electrochem. Sci., 7 (2012) 6816.
21. H. Shayani-Jam, D. Nematollahi, Electrochim. Acta, 56 (2011) 9311.
22. S. Kim, J. I. Kim, H. R. Park, M. K. Kim, Y. Chong, W. Yeo, Bull. Korean Chem. Soc., 30 (2009) 2574.
23. R. M. Silverstein, F. X. Welbster, Spectrometric identification of organic compounds. New York: John Wiley and Sons, 1996.
24. A. Barth, Prog. Biophiys. Mol. Biol., 74 (2000) 141.
25. J. Coates, Interpretation of Infrared Spectra, A Practical Appoach. In Encyclopedia of Analytical Chemistry. John Wiley & Sons LTD, Inc.: Chichester, 2000.
26. D. R. Do Carmo, L. L. Paim, N. L. Dias Filho, N. R. Stradiotto, Appl. Surf. Sci., 253 (2007) 3683. 27. A. G. S. Prado, J. A. A. Sales, R. M. Carvalho, R. J. Rubim, C. Airoldi, J. Non-Cryst. Solids, 333
(2004) 61.
28. S. M. Evangelista, E. Oliveira, G. R. Castro, L. F. Zara, A. G. S. Prado, Surf. Sci., 601 (2007) 2194.
29. P. H. Klung, E. L. Alexander, X-ray diffraction procedures for polycrystalline and amorphous materials. 2 Ed. New York. Wiley, 1954.
30. D. Engel, E. W. Grabner, Ber. Bunsen-Ges. Phys. Chem., 89 (1985) 982.
31. L. A. Soares, T. F. S. Da Silveira, D. R. Silvestrini, U. O. Bicalho, N. L. Dias Filho, D. R. Do Carmo,Int. J. Electrochem. Sci., 8 (2013) 4654.
32. M. A. Maliki, P. J. Kulesza, Electroanalysis, 6 (1996) 113. 33. S. S. Narayanan, F. Scholz, Electroanalysis, 11 (1999) 465. 34. M. B. Soto, F. Scholz, J. Electroanal. Chem., 528 (2002) 27. 35. D. Jayasri, S. Narayanan, Sens. Actuators, B, 119 (2006) 135.
36. A. L. Bard, L. R. Faulkner, Electrochemical methods: fundamentals and Applications. John Wiley & Sons, New York, 1980.