SDR 48/2013 26 March 2013
Further Education, Work-based Learning and Community Learning in Wales,
2011/12
This Statistical First Release for 2011/12 summarises information on post-16 learning collected through the Welsh Government’s Lifelong Learning Wales Record (LLWR). Early figures for December 2012 are also included in Annex A. The data coverage excludes enrolments at Higher Education institutions and at school sixth forms but includes provision at Further Education (FE) institutions, Work-based Learning (WBL) providers and Local Authority Community Learning (CL) providers. Additional detail is
available on the Welsh Government's interactive data dissemination service StatsWales.
Summary
• The figures in this release show a decline in overall learner numbers between 2010/11 and 2011/12 (continuing since 2005/06) but with variations between the individual sectors and age groups. • In 2011/12 there were 228,430 distinct learners at FE Institutions, Community Learning (CL) or
Work-based Learning (WBL) providers, 5.0 per cent lower than in 2010/11.
• Total numbers at FE institutions fell by 3.8 per cent, with full-time learner numbers changing little (0.8 per cent fall) and part-time learner numbers at FEIs 5.1 per cent lower.
• Learners in local authority community learning fell by 7.5 per cent, relative to 2010/11.
• For WBL provision, learner numbers on a full year basis fell by 6.3 per cent though the number of trainees in learning on the last day of the year was 2.8 per cent higher than at 31 July 2011, the latter date having immediately preceded a change in the structure of Welsh Government support to WBL providers.
Chart 1: Learners by provision type
0 20,000 40,000 60,000 80,000 100,000 120,000 140,000 160,000 180,000 200,000
2004/05 2005/06 2006/07 2007/08 2008/09 2009/10 2010/11 2011/12
(a) See Trends section for changes in scope of FEI sector betw een 2005/06 and 2007/08
N
u
m
b
er
o
f lear
n
er
s
Full-time (a) learners at FEIs
Part-time (a) learners at FEIs
WBL provision
LA CL
Statistician: Phil Lovell Tel: 029 2082 5139 Email: [email protected]
Next update: November 2013 (provisional)
Learners enrolled with FE institutions, Work-based Learning or Local Authority
Community Learning providers
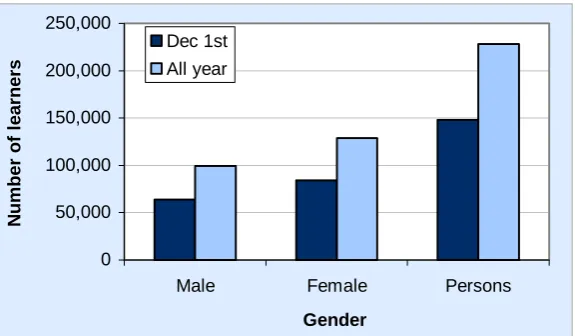
• There were 228,430 unique learners pursuing one or more learning activities with FE Institutions, Local Authority Community Learning or Work-based Learning providers during 2011/12, of which 128,810 (56 per cent) were female and 99,620 (44 per cent) were male. The number in-learning in the week of 1 December 2011 was 148,325 [Table 1].
• The number of learners in 2011/12 at FE, WBL and Local Authority Community Learning providers was 5.0 per cent lower than the equivalent figure for 2010/11.
• Within this fall in total FE/WBL/CL distinct learner numbers, full-time learner numbers at FE institutions had changed little (0.8 per cent fall) but part-time learner numbers at FEIs fell by 5.1 per cent.
• 25 per cent of learners were aged under 19 and 43 per cent were aged under 25.
[image:2.595.47.335.582.750.2]• Males outnumbered females for all ages below 20. However, the number of females aged 20 or above was 51 per cent higher than the number of males.
Table 1: Numbers of learners at Further Education Institutions, Local Authority
Community Learning and Work-based Learning providers by age and gender,
2011/12 (a)
Age 1st December All Year 1st December All Year 1st December All Year
Under 16 1,605 2,615 1,205 2,235 2,810 4,855
16 8,620 10,020 7,990 9,285 16,605 19,305
17 8,930 10,415 8,090 9,450 17,015 19,865
18 5,895 7,310 4,985 6,400 10,885 13,710
19 3,775 5,105 3,215 4,500 6,990 9,605
20-24 8,995 14,760 10,085 16,015 19,085 30,775
25-49 17,845 34,260 31,960 53,805 49,805 88,070
50-64 5,400 10,740 11,015 18,580 16,415 29,320
65+ 2,745 4,215 5,720 8,195 8,465 12,415
Not Specified 90 175 165 340 250 510
Total 63,895 99,620 84,430 128,810 148,325 228,430
Males Females Persons
Source: Lifelong Learning Wales Record (a) Age at 31 August 2011
Reports on contain the information provided in table 1 with a breakdown by ethnicity.
Chart 2: Learner numbers by gender
0 50,000 100,000 150,000 200,000 250,000
Male Female Persons
Gender
N
u
m
b
er
of
l
ear
ner
s
Trends in full year learner numbers
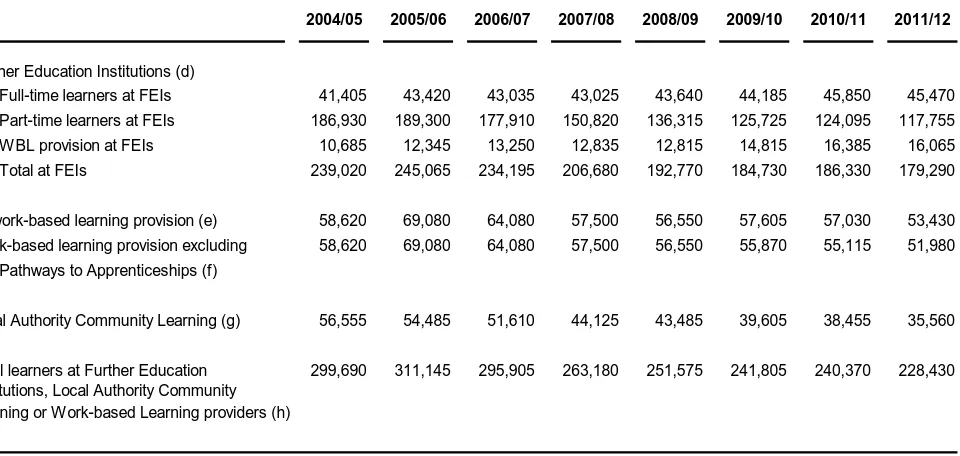
• Table 2 illustrates the trend in learner numbers for three (overlapping) areas of learning: total learners at FE institutions (including WBL at FEIs); total work-based learning provision (also
including WBL at FEIs); and local authority community learning (including learners enrolled at FEIs but taught by local authority staff).
[image:3.595.60.540.250.478.2]• The figures for 2010/11 had been at a similar level to those of 2009/10 but 2011/12 shows an overall reduction of 5.0 per cent against 2010/11. The larger declines relative to earlier years (resulting from trends in part-time provision) are not fully comparable as they do not take into account learners now included as part of HE institutions (and so outside the scope of this release).
Table 2: Trends in learner numbers at Further Education institutions, Local Authority
Community Learning and Work-based Learning providers, 2004/05 to 2011/12
(a)(b)(c)
2004/05 2005/06 2006/07 2007/08 2008/09 2009/10 2010/11 2011/12
Further Education Institutions (d)
Full-time learners at FEIs 41,405 43,420 43,035 43,025 43,640 44,185 45,850 45,470
Part-time learners at FEIs 186,930 189,300 177,910 150,820 136,315 125,725 124,095 117,755
WBL provision at FEIs 10,685 12,345 13,250 12,835 12,815 14,815 16,385 16,065
Total at FEIs 239,020 245,065 234,195 206,680 192,770 184,730 186,330 179,290
All work-based learning provision (e) 58,620 69,080 64,080 57,500 56,550 57,605 57,030 53,430
Work-based learning provision excluding 58,620 69,080 64,080 57,500 56,550 55,870 55,115 51,980
Pathways to Apprenticeships (f)
Local Authority Community Learning (g) 56,555 54,485 51,610 44,125 43,485 39,605 38,455 35,560
299,690 311,145 295,905 263,180 251,575 241,805 240,370 228,430
Learning or Work-based Learning providers (h)
Source: Lifelong Learning Wales Record
(a)
(b)
(c)
(d)
(e)
(f) (g)
(h)
Work-based learning provision includes learners pursuing work-based learning (and Pathways to Apprenticeships) programmes at FE institutions as well as provision at other training providers.
WBL provision excluding the Pathways to Apprenticeships scheme introduced in 2009/10.
Includes both those learners enrolled at local authorities directly and learners who are enrolled at FEIs but whose teaching is contracted out to local authorities.
The use of unique learner counts and definitional overlaps mean, for any given year, that the total for FE/WBL/CL learners is lower than the sum of the figures in the preceding rows.
Counts in all columns except 2004/05 and 2005/06 exclude learners at Merthyr Tydfil college, following the merger of the college into the University of Glamorgan.
In calculating each in-learning count, the population is largely determined by the actual start and end dates of learning programmes and activities. However an additional constraint is applied to each year in that learning activities with an expected end date more than two years before the start of the given academic year are excluded.
Learner numbers at FE institutions (FEIs) include learners pursuing work-based learning (and Pathways to Apprenticeships) programmes at FEIs and learners, enrolled at FEIs, whose teaching is contracted out to local authorities.
Total learners at Further Education Institutions, Local Authority Community
Counts are of unique learners, so removing, from each individual row, multiple counting of learners present at more than one learning provider and/or provision type.
• Also included under HE institutions from 2006/07 onwards (and therefore excluded from those years in this release) is Merthyr Tydfil College, now part of the University of Glamorgan.
• Within the overall decline relative to 2010/11, the reductions were 3.8 per cent for FEIs, 6.3 per cent for work-based learning provision and 7.5 per cent for local authority community learning. Within the FEI reduction, the full-time component had changed little (0.8 per cent fall).
• Recent years have often seen increasing numbers of learners aged 19 and under at FE institutions, even when the older age groups have declined. However, between 2010/11 and 2011/12 there was a fall of 4.0 per cent for those aged 20 and over and also a decrease of 3.3 per cent in those aged 19 and under at FEIs (though the full-time component of this age group remained almost static).
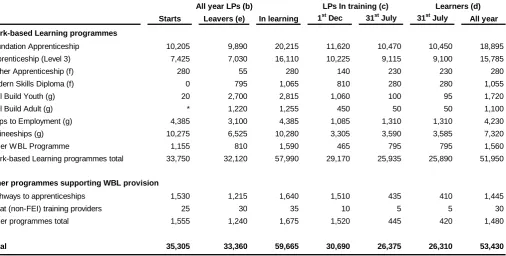
• The Pathways to Apprenticeships (PTA) scheme (comprising programmes at FEIs supporting WBL provision – see later WBL provision section and notes) is included in the WBL provision category but excluded from WBL programme counts (see Table 4).
Learning programmes
• Over the academic year 2011/12 there were 295,175 enrolments on learning programmes in total, 64 per cent of which were part-time, 16 per cent of which were full-time and 20 per cent of which were in work-based learning [Table 3].
[image:4.595.44.552.390.724.2]• Further commentary on the individual areas of provision is given below.
Table 3: Enrolments on learning programmes at Further Education Institutions,
Community Learning or Work-based Learning providers by provision type, mode
of study and gender, 2011/12 (a)
1st Dec All Year 1st Dec All Year 1st Dec All Year
Full-time 20,850 22,845 21,255 23,165 42,105 46,010
Part-time 29,465 64,455 39,050 80,720 68,515 145,175
Total 50,315 87,300 60,305 103,885 110,620 191,185
Higher Education at FEIs
Full-time 115 130 100 110 220 240
Part-time 880 945 1,145 1,225 2,025 2,170
Total 995 1,075 1,245 1,335 2,245 2,410
Work-based Learning Provision
WBL programmes at FEIs 5,225 8,825 3,700 6,800 8,930 15,625
Pathways to Apprenticeships (FEIs) 1,370 1,470 150 170 1,520 1,640
Programmes at other training providers 9,070 19,120 11,465 23,280 20,535 42,400
Total 15,670 29,420 15,315 30,245 30,985 59,665
Local Authority Community Learning (b)
Full-time: enrolled at FEIs 30 35 45 45 75 80
Part-time: enrolled at FEIs 3,240 5,740 7,625 12,935 10,865 18,675
Full-time: enrolled at LEAs 0 0 0 0 0 0
Part-time: enrolled at LEAs 3,125 5,940 9,155 17,215 12,285 23,165
Total 6,395 11,710 16,825 30,200 23,220 41,915
All Levels of Study
Full-time 21,000 23,010 21,400 23,325 42,400 46,330
Part-time 36,710 77,075 56,975 112,100 93,690 189,180
Work-based Learning 15,670 29,420 15,315 30,245 30,985 59,665
Total 73,380 129,505 93,690 165,665 167,070 295,175
Source: Lifelong Learning Wales Record Persons
Males Females
(b) Excludes 'assisted' Community Learning provisions. See notes. (a) See notes for definitions of level and mode.
Further Education
excluding Local Authority CL at FEIs
FE Provision (excluding local authority community learning)
During the 2011/12 academic year, 191,185 Further Education learning programmes (excluding those taught by local authority staff) were pursued, 46,010 of which were full-time (0.4 per cent down on 2010/11) and 145,175 were part-time (5.1 per cent down on 2010/11).
Higher Education Learning Programmes
[image:5.595.57.564.245.501.2]2,410 learning programmes were pursued under Higher Education provision at FE Institutions during 2011/12, compared with 2,875 in 2010/11 and 2,005 in 2009/10.
Table 4: Work-based learning provision: Numbers of learning programmes (LP) starts,
leavers and in-training and of learners in-training by programme type, 2011/12 (a)
Starts Leavers (e) In learning 1st Dec 31st July 31st July All year
Foundation Apprenticeship 10,205 9,890 20,215 11,620 10,470 10,450 18,895
Apprenticeship (Level 3) 7,425 7,030 16,110 10,225 9,115 9,100 15,785
Higher Apprenticeship (f) 280 55 280 140 230 230 280
Modern Skills Diploma (f) 0 795 1,065 810 280 280 1,055
Skill Build Youth (g) 20 2,700 2,815 1,060 100 95 1,720
Skill Build Adult (g) * 1,220 1,255 450 50 50 1,100
Steps to Employment (g) 4,385 3,100 4,385 1,085 1,310 1,310 4,230
Traineeships (g) 10,275 6,525 10,280 3,305 3,590 3,585 7,320
Other WBL Programme 1,155 810 1,590 465 795 795 1,560
Work-based Learning programmes total 33,750 32,120 57,990 29,170 25,935 25,890 51,950
Pathways to apprenticeships 1,530 1,215 1,640 1,510 435 410 1,445
FE at (non-FEI) training providers 25 30 35 10 5 5 30
Other programmes total 1,555 1,240 1,675 1,520 445 420 1,480
Total 35,305 33,360 59,665 30,690 26,375 26,310 53,430
(a)
(b) (c) (d) (e)
(f)
(g)
Higher Apprenticeships were introduced in 2011/12, replacing the Modern Skills Diploma programme which was closed to new entrants and consequently has no new starts in this year.
The Skill Build Youth and Skill Build Adult programmes were superseded (and therefore have very few starts) in 2011/12 and were replaced by the Traineeships and Steps to Employment programmes respectively.
Other programmes supporting WBL provision
Learners (d)
Source: Lifelong Learning Wales Record
Represents cumulative count of learning programmes enrolled at any point during the academic year. Number of learning programmes on the reference date.
Distinct learners categorised according to their most recent learning programme of the year.
Counts of leavers exclude those who have transferred to another learning programme at the same provider. They are also restricted to those identifiable from the standard database of contracted learning providers for 2011/12.
Note that the definition of WBL provision differs slightly from that of WBL programme type. For the purpose of this release, Pathways to
Apprenticeships programmes conducted at FE institutions are regarded as WBL provision but not necessarily WBL programmes. This categorisation also applies to a small number of 'non-WBL' learning programmes pursued at W BL subsidiaries of FEIs.
All year LPs (b) LPs In training (c)
Work-based Learning programmes
Work-based Learning Provision
59,665 learning programmes were pursued in 2011/12 within work-based provision, of which 17,265 were provided by FE institutions and 42,400 by other training providers. Table 3 splits the figures for WBL provision at FEIs between 15,625 WBL programmes and 1,640 Pathways to Apprenticeships (PTA) programmes. The Pathways to Apprenticeships scheme was introduced in 2009/10 to Wales in
The number of trainees in learning on 31 July 2012, the last day of the academic year 2011/12, was 2.8 per cent higher than at 31 July 2011. There is often a seasonal reduction in the in-learning count (notably for Pathways to Apprenticeships) between March and July – see Annual Volume (Tables T2.1 and T2.2; referenced at the end of this release) and day of week effects contribute some variability to the year on year change of such snapshot figures. 31 July 2011 was immediately followed by the new academic year 2011/12 which introduced a change in the structure of Welsh Government support to WBL providers, with funding being directed through a smaller number of contracted providers, including some consortia and lead providers.
In contrast to the change in the year end WBL learner count, the full year learner count for those in WBL provision during 2011/12 (taking each learner’s most recent learning programme of the year only) was 6.3 per cent lower than in 2010/11. Learner numbers fell slightly for those on Level 3 Apprenticeship programmes (by 1.4 per cent) and Foundation Apprenticeship programmes (by 3.2 per cent).
Local Authority Community Learning Provision
41,915 learning programmes were pursued in 2011/12. The number of distinct learners pursuing local authority CL learning activities was 35,560 (see Table 2), 7.5 per cent lower than in 2010/11 and 37 per cent lower than in 2004/05. However part of this longer term reduction was associated with the change in the treatment of Welsh for Adults data (between 2006/07 and 2007/08) referred to in previous
releases and above which had an impact on the element of LA CL sub-contracted from FEIs.
Learning activities and qualifications
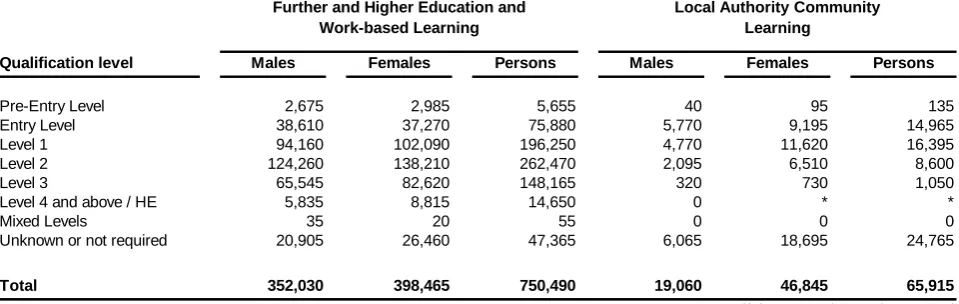
• Of learning activities for which the qualification level was known (a), 29 per cent were at level 1, 36 per cent were at level 2 and 20 per cent were at level 3 [Table 5]. Compared with 2006/07, a slightly higher proportion were at level 3 (18 per cent in 2006/07) and a lower proportion at level 1 (33 per cent in 2006/07).
• The proportion of entry and pre-entry level learning activities (combined) rose fairly steadily from 8 per cent in 2003/04 and 2004/05 to 10 per cent in 2005/06 and 2006/07 before progressing upwards to 13 per cent in 2011/12.
• 23 per cent of qualifications being studied for were Key Skills/Essential Skills Wales, 18 per cent were OCN (Open College Network) credits but 29 per cent were classed as ‘Other’ qualification types, including specific vocational qualifications not grouped elsewhere for the purpose of this release.
Chart 3: Learning activities by qualification level
0% 10% 20% 30% 40%
Pre-entry level or entry level
Level 1 Level 2 Level 3 Level 4/5
or HE
Mixed levels
Qualification level of learning activity
Percent
a
ge of
know
n l
e
vel
s
(a) 9 per cent of qualification levels were unknown or not applicable. For Further Education provision the figure was 7 per cent but for Local
• The most popular subjects for learning activities (whose subject was specified) were Care/Personal Development (30 per cent), Science/Mathematics (8 per cent) , Media /Communications (including Communication Skills) (8 per cent), Information Technology (8 per cent) and Health (including Health & Safety) (8 per cent), although popularity varied across types of provision.
Table 5: Enrolments on learning activities at Further Education Institutions, Community
Learning or Work-based Learning providers by qualification level and gender,
2011/12
Qualification level Males Females Persons Males Females Persons
Pre-Entry Level 2,675 2,985 5,655 40 95 135
Entry Level 38,610 37,270 75,880 5,770 9,195 14,965
Level 1 94,160 102,090 196,250 4,770 11,620 16,395
Level 2 124,260 138,210 262,470 2,095 6,510 8,600
Level 3 65,545 82,620 148,165 320 730 1,050
Level 4 and above / HE 5,835 8,815 14,650 0 * *
Mixed Levels 35 20 55 0 0 0
Unknown or not required 20,905 26,460 47,365 6,065 18,695 24,765
Total 352,030 398,465 750,490 19,060 46,845 65,915
Further and Higher Education and Work-based Learning
Local Authority Community Learning
Source: Lifelong Learning Wales Record
Reports on contain the information provided in table 5 with a breakdown by qualification type and subject, provider type, provision type and language of delivery.
Notes
1. Context
1.1 General
This Statistical First Release (SFR) summarises data on learner numbers in post-16 education and training at providers receiving funding from DfES (Department for Education and Skills) for the
academic year 2011/12. However, the figures are not restricted to fundable learners at those providers. The release contains information on the post-16 sector excluding HE institutions, HEI-based Welsh for Adults centres and school sixth forms but including Further Education institutions, Work-based Learning providers and Local Authority Community Learning providers. Further information on this series, the first release of which was SDR 38/2005, and earlier sources is given in the ‘Data for previous years’ section.
1.2 Policy Context
Within the Welsh Government the release and other outputs from the LLWR data underlying it play a role in supporting decision making processes in relation to:
• The Transformation Agenda – “The Transformation policy, launched in September 2008, challenged all providers of post-compulsory education and training in Wales to set aside traditional, narrow, institutional arrangements and to plan provision collectively; direct more of the funding available to teaching and learning and learner support; and transform the network of providers.”
Transforming Education and Training Provision in Wales
•
The Learning and Skills (Wales) Measure 2009 – “ .. aims to provide wider learner choice, reduce
expected to establish effective collaboration to underpin 14-19 entitlement and maximise the chances
of successful learner outcomes.”
Learning and Skills (Wales) Measure 2009
See also section 5.1 on ‘Relevance’.
2. Data Source
Lifelong Learning Wales Record (LLWR)
The Lifelong Learning Wales Record is the data collection system employed by the Welsh Government to enable FE, WBL and local authority community learning providers to report on-line individualised data on learners, their learning programmes, activities and awards. DfES systems load the data on to a post-16 database to facilitate analysis. Further information on LLWR including user support manuals can be found at:
https://llwrinform.wales.gov.uk/info/Documents.aspx
Our statement of administrative sources, which also refers to this data source, can be found at : http://wales.gov.uk/topics/statistics/about/compliance/administrative/?lang=en
The primary purpose of the LLWR is to provide FE/WBL/CL data for the National Planning and Funding System (NPFS). The NPFS is a learner-centred single planning and funding system for all post-compulsory learning in Wales, other than Higher Education. The LLWR data are also a basis for the DfES Quality Framework, monitoring of performance and outcomes, informing strategy and
development and the provision of statistics on FE/WBL/CL learners in Wales.
3. Definitions and methods
Learner numbers, learning programmes and learning activities
• The Lifelong Learning Wales Record (LLWR) from which tables 1 to 5 were derived has datasets based on learners, their learning programmes and their constituent learning activities as well as awards which are not included in the current release. Table 1 and 2 are based on counts of
individual learners using a methodology which counts only once a learner present at more than one provider. Tables 3 and 4 are based on counts of learning programmes, apart from the final two columns of table 4 which use unique learners. A learner represented in table 1 or table 2 will have one or more learning programmes in tables 3 and 4. Table 5 is based on counts of learning activities, there being one or more of these constituents to each learning programme.
• A learning activity, typically, is a specific qualification or course pursued by a learner. A learning programme is a group of related activities (and awards where applicable) such as a work-based learning framework (e.g. Apprenticeship).
Learners at Further Education Institutions, Local Authority Community Learning or
Work-based Learning providers (tables 1,2,3 and 5)
• Information was collected from FE institutions, local authorities and other training providers via the LLWR, from which data were extracted on 21 February 2013.
• Community Learning is a broad definition that can encompass, for instance, provision at FE
institution outreach centres and Adult Basic Education. This release only identifies Local Authority Community Learning provision (see "Provision Type" notes) and hence this is the term used
• WBL provision is included whether at an FE college, at a WBL subsidiary of an FE institution or at another training provider.
• Where a provider is part of a WBL consortium, the assignment to ‘WBL at FEIs’ or to ‘WBL at Other training providers’ has been made according to the status of the consortium member (which may differ from the status of the lead provider of the consortium).
• December 1st counts are based on a snapshot of the week of 1 December 2011. All-year counts are based on all learners enrolled during the academic year.
• Ages are as at 31 August 2011.
• Includes students on courses at the Workers Educational Association (WEA) and the Young Men’s Christian Association (YMCA).
Apart from in the years 2004/05 and 2005/06 (in Chart 1 and Table 2), the figures in this release exclude FE learners at Merthyr Tydfil College which merged into the University of Glamorgan in April 2006. These learners are now included within the University of Glamorgan data collected by HESA (the Higher Education Statistics Agency) and hence within, for example, the Welsh Government’s Bulletin ‘Students in Higher Education Institutions, 2011/12’. Learners with the Merthyr Tydfil College work-based learning subsidiary are however included in all years of this Statistical First Release as their data are not collected by HESA.
Work-based Learning (Table 4)
This table summarises enrolments on work-based learning programmes.
• Starts and leavers denote the cumulative number of new starts and leavers on each programme during the academic year.
• Counts of leavers exclude those who have transferred to another learning programme at the same provider. They are also restricted to those leavers who are identifiable from the standard database population used for this release.
• In-training figures are the number of training episodes at December 1st 2011 or July 31st 2012. These are for single days (and therefore vulnerable to ‘day of week’ effects), in contrast to the December 1st counts in tables 1 and 3 which are based on a full week (and are therefore slightly higher).
In addition to the learning programme columns, Table 4 includes two columns based on distinct learner counts, one as at the end of July 2012 and the other for the full academic year.
Provision type
The provision type is determined at the learning programme level. Note that this is not a funding report and definitions can differ from those used for funding purposes. For example, some of the WBL provision included in this release will not have been included in the calculation of funding for WBL providers.
For the purpose of this statistical release,
• Further Education (FE) provision is defined as that submitted to the LLWR by an FE provider excluding:
learning programmes categorised below as HE or WBL; and
learning delivered by a Local Authority via a subcontracted arrangement with an FE provider.
• Higher Education (HE) provision comprises learning programmes categorised as higher education namely:
Higher National Certificate; Higher National Diploma; HE professional / HE vocational programme;
The figures for HE include learners whose programme is designated as HE level but exclude learning programmes where the overarching learning programme is not designated as ‘HE’ although an element of the learning (i.e. one or more learning activities) is at HE level.
• Local Authority Community Learning provision is defined as that submitted to the LLWR: by a Local Authority directly ('maintained' or 'contracted-out' provision); or
by an FE provider but where the learning is delivered by a Local Authority through a partnership, franchise or subcontracted arrangement ('contracted-in' provision).
The Local Authority Community Learning figures exclude 'assisted' provision, i.e.courses controlled and managed by another organisation but which the local authority supports either financially or by providing premises or other facilities free of charge or at subsidised rates.
• WBL provision is defined as that submitted to the LLWR by a (non-FEI) WBL provider as well as designated provision at FE institutions including the following (or their predecessor) programmes:
Apprenticeship (Level 3);
Foundation Apprenticeships (Level 2; including Young Recruits programme); Higher Apprenticeship (Level 4 plus; introduced from 2011/12);
Modern Skills Diploma (Level 4 plus; discontinued for new entrants from 2011/12); Steps to Employment (introduced from 2011/12);
Traineeships (introduced from 2011/12);
Skill Build (Adult and Youth programmes but discontinued for new entrants from 2011/12); Other WBL programmes (including Flexible Learning, Pre-employment training [Local Employer
Partnership], ‘Young Person’s Guarantee: Routes into Work’, bespoke programmes and smaller programmes).
The Pathways to Apprenticeships scheme was introduced in 2009/10 to Wales in anticipation of a drop in recruitment of apprentices as a result of the economic downturn. In this release it is included in the WBL provision category but excluded from WBL programme counts (see Table 4).
Subjects
References to subjects are based on an abbreviated form of the category associated with the first character of the LDCS code under the LearnDirect Classification System (LDCS).
Mode of learning
Mode of learning has been derived from the LLWR using guided contact hours. In Table 3 the methodology is used to derive learning programme counts which are not directly comparable with mode of learning splits of learner numbers in Table 2. The methodology has also been applied to learner numbers elsewhere, for instance in the Welsh Government publication ‘Further Education, Work-based Learning and Community Learning in Wales Statistics 2010/11’.
• Learning programmes classified for statistical purposes as full-time are defined as those containing at least 450 guided contact hours per year.
• Learning programmes classified as part-time are defined as those containing fewer than 450 guided contact hours per year. (Note that this definition of part-time learning embraces short courses which learners pursue on a full-time basis for a limited number of weeks.)
4. Rounding
Figures are rounded to the nearest 5 and there may be apparent slight discrepancies between the sum of the constituent items and the total. An asterisk ‘*’ represents numbers greater than 0 and less than 5.
5. Key Quality Information
5.1 Relevance
The statistics are used both within and outside the Welsh Government to monitor educational trends and as a baseline for further analysis of the underlying data. Some of the key users are:
• Ministers and the Members Research Service in the National Assembly for Wales; • Officials in the Welsh Government;
• Other government departments;
• Further Education Institutions, Work-Based Learning providers and local authorities; • Estyn, Her Majesty’s Inspectorate of Education and Training in Wales;
• Students, researchers, and academics;
• Individual citizens, private companies, and the media.
These statistics are used in a variety of ways. Some examples of these are: • general background and research;
• inclusion in reports and briefings; • advice to Ministers;
• informing and evaluating the education policy-making process in Wales. (See section 1.2 on ‘Policy Context’.)
LLWR data are used to underpin funding and performance reports for learning providers, to calculate NEET (Not in Education, Employment or Training) figures and in student finance modelling.
5.2 Accuracy
Statisticians within the Welsh Government review the data and query any anomalies with the LLWR data collection team and, where relevant, with learning providers before tables are published.
The LLWR data underlying this release are intended to be final for non-funding purposes.
Provisional figures for 2011/12 were published on 27 November 2012 in SDR 203/2012. Since then learning providers have updated their data, such updates being permissible only in the interests of improving accuracy and data quality. An overview of revisions to data between provisional and final releases is presented below.
Percentage change between provisional and final release
Learners Learning programmes Learning activities
Dec 1st All year Dec 1st All year All year
2003/04 +1.3 +1.4 +1.3 +2.0 +1.5
2004/05 +0.4 +1.7 +1.2 +3.0 +1.4
2005/06 +1.0 +1.3 -1.3 0.0 +0.4
2006/07 -0.6 +0.5 -1.0 +0.5 +0.2
2007/08 +0.2 +0.9 +0.4 +1.3 +0.9
2008/09 -1.5 -0.8 -1.4 -0.7 -2.2
2009/10 -1.3 -0.5 -1.6 -0.5 -2.1
2010/11 -0.9 +0.3 -1.5 +0.2 -0.9
5.3 In-learning Population
In-learning counts for all years in the current release (and in the other bulletins using LLWR data listed at the end of this release) are on an adjusted population basis. The effect of introducing this population was described in the Key Quality section of the 2008/09 release SDR 60/2010.
The in-learning population is adjusted by excluding unclosed activities with an expected end date more than two years earlier than the start of the given academic year. Having excluded these activities, the population is then determined from the remaining activities by means of the actual start and end dates (in conjunction with the learning programme end date, where available separately for WBL
programmes).
The adjusted population was introduced in order to produce a more accurate reflection of ‘live’ activity after identifying an increasing number of unclosed activities since the inception of the LLWR.
5.4 Timeliness and Punctuality
The annual timescale for the production of data balances timeliness against the need for accurate data quality. Statistics on a given academic year are drawn from a database based on the LLWR as at February following the end of the academic year. The corresponding first release is produced and published as soon as possible during March. This timetable was accelerated for the 2010/11 final release. Previously the LLWR freeze had been taken near the end of March with the SFR published in April.
The statistics of the current release are drawn from the database as at 21 February 2013.
5.5 Accessibility and Clarity
This statistical release is pre-announced and then published on the Statistics section of the Welsh Government website. It is accompanied by more detailed tables on StatsWales, a free to use service that allows visitors to view, manipulate, create and download data.
5.6 Comparability
Data for previous years
This series, the first Release of which was SDR 38/2005 containing provisional data for 2003/04
(finalised in SDR67/2005), replaces an earlier quarterly series on work-based learning enrolments (final edition SDR 22/2005) and an annual Statistical Bulletin on Adult Continuing Education (SB 52/2003) published by the Welsh Government.
The 2003/04 releases were based on LLWR data for Further Education, Community Learning and the component of Work-based Learning provided through FE institutions. However, WBL figures at other training providers (such as those included in a specific table of SDR 38/2005) were, then and previously, based on data collected through the National Trainee Database (NTD). Release SDR22/2005 contained the final data from the NTD as at June 2004. Data on all DfES-funded Work-based Learning providers have subsequently been collected solely via the LLWR and contribute to all areas of WBL provision in post-16 education releases in Wales from 2004/05 onwards.
Owing to changes in data collection, comparisons with years prior to 2003/04 should only be made with caution. Previously data on Further Education provision, sourced from the Individualised Student Record (ISR), were available through the ELWa/HEFCW annual volume ‘Higher Education, Further Education and Training Statistics in Wales’ ending with the edition covering the 2002/03 academic year, published in November 2004. The first equivalent volume to be based on the LLWR, ‘Further Education, Work-based Learning and Community Learning in Wales Statistics 2003/04’, was published by ELWa in March 2006 and the eighth of the series, based on 2010/11, was published by the Welsh Government in September 2012.
UK nations
Examples of similar outputs from other UK nations can be found at:
England - www.thedataservice.org.uk/statistics/statisticalfirstrelease/sfr_current/
Northern Ireland - http://www.delni.gov.uk/index/statsandresearch/further-education-stats/further-education-enrolments-2/
Scotland - http://www.scotland.gov.uk/Topics/Statistics/Browse/Lifelong-learning
However, owing to differences in methodology and data collection, caution should be exercised in making direct comparisons with the figures contained in this release.
StatsWales
Only summary tables have been provided in this release. Additional tables supplying greater detail, including analysis by programme and qualification type, subject, age, disability status and ethnicity, are available via the Welsh Government's online dissemination service StatsWales. Tables related to this SFR can be found at:
Other Bulletins and Publication using LLWR data underlying this release
This release and other statistical outputs can be found on the Welsh Government’s Statistics site.
Outputs available on the site using the LLWR data underlying this release will include 2011/12 versions of the following bulletins and a publication:
• ‘National Comparators for Further Education and Work-based Learning, 2010/11’ - Statistics on learner outcomes at FE institutions and WBL providers. 2011/12 release due to be published (as ‘Learner Outcome Measures for Further Education and Work Based Learning, 2011/12’ on 28 March 2013.
• ‘Learning Network Analysis 2010/11’ – bulletin providing analysis at both national and local authority level for post-16 learners (excluding learners at HEIs) at FE Institutions, other training providers and school sixth forms in Wales, with extended coverage to include Welsh domiciled learners at similar providers located in England - published May 2012. Associated StatsWales tables include figures for individual FE institutions.
• ‘Further Education, Work-based Learning and Community Learning in Wales Statistics, 2010/11‘– Annual Volume, published September 2012. See statistical publications site:
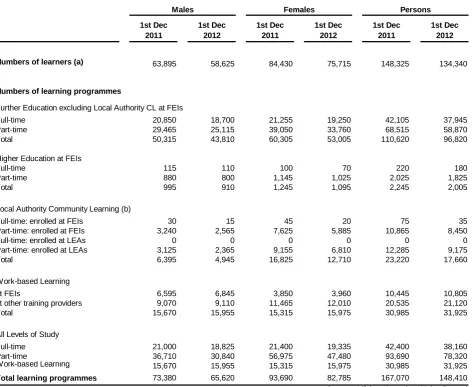
ANNEX A
[image:14.595.49.522.167.554.2]EARLY STATISTICS (December 2012) – PROGRESS REPORT ONLY
Table A: Numbers of learners and learning programme enrolments at Further Education Institutions, Community Learning or Work-based Learning providers in week of
1 December, 2011 andin week of 1 December 2012 (INCOMPLETE RECORDS RECEIVED)
1st Dec 2011
1st Dec 2012
1st Dec 2011
1st Dec 2012
1st Dec 2011
1st Dec 2012
Numbers of learners (a) 63,895 58,625 84,430 75,715 148,325 134,340
Numbers of learning programmes
Further Education excluding Local Authority CL at FEIs
Full-time 20,850 18,700 21,255 19,250 42,105 37,945
Part-time 29,465 25,115 39,050 33,760 68,515 58,870
Total 50,315 43,810 60,305 53,005 110,620 96,820
Higher Education at FEIs
Full-time 115 110 100 70 220 180
Part-time 880 800 1,145 1,025 2,025 1,825
Total 995 910 1,245 1,095 2,245 2,005
Local Authority Community Learning (b)
Full-time: enrolled at FEIs 30 15 45 20 75 35
Part-time: enrolled at FEIs 3,240 2,565 7,625 5,885 10,865 8,450
Full-time: enrolled at LEAs 0 0 0 0 0 0
Part-time: enrolled at LEAs 3,125 2,365 9,155 6,810 12,285 9,175
Total 6,395 4,945 16,825 12,710 23,220 17,660
Work-based Learning
at FEIs 6,595 6,845 3,850 3,960 10,445 10,805
at other training providers 9,070 9,110 11,465 12,010 20,535 21,120
Total 15,670 15,955 15,315 15,975 30,985 31,925
All Levels of Study
Full-time 21,000 18,825 21,400 19,335 42,400 38,160
Part-time 36,710 30,840 56,975 47,480 93,690 78,320
Work-based Learning 15,670 15,955 15,315 15,975 30,985 31,925
Total learning programmes 73,380 65,620 93,690 82,785 167,070 148,410 Source: Lifelong Learning Wales Record
Persons
Males Females
(b) Excludes 'assisted' Community Learning provision. (a) Unique learner basis
Early Statistics and potential revisions
As noted in section 5.4 Timeliness and Punctuality, this release was produced one month earlier than previous equivalents apart from SDR 51/2012 and is based on correspondingly earlier LLWR data. This does not appear to have had a detrimental effect on the final 2010/11 figures. However, as noted in SDR 51/2012, the Early December 2011 returns appeared to be incomplete and have subsequently been confirmed as having been understated in the providers’ early submissions. Similarly, the Early
December 2012 figures above represent only a progress report (compared with final December 2011) on the receipt of this component of 2012/13 data from learning providers and should not be regarded robust.
Table B: Numbers of learners at Further Education Institutions, Community Learning or Work-based Learning providers in week of 1 December of academic year
Year (as at week of
1 December) Early (a)
Figures
Final (b) Figures
December 2005 (c) 170,330 212,160 80.3
December 2006 (c) 200,965 209,840 95.8
December 2007 (c) 189,405 192,730 98.3
December 2008 (d) 166,105 169,430 98.0
December 2009 (e) 160,530 161,735 99.3
December 2010 (e) 158,455 157,345 100.7
December 2011 (e)(f) 134,320 148,325 90.6
(f) LLWR freeze date moved from March to February
(e) Adjusted population basis; included in First Release (commencing with Early Statistics for December 2009)
(d) Adjusted population basis; no corresponding First Release of Early Statistics
Source: Lifelong Learning Wales Record
(a) From previous year's standard LLWR database freeze (b) From standard LLWR database freeze
(c) Original population basis; no corresponding First Release of Early Statistics Numbers of distinct learners